
|
|||||
|
 | |
| |
| |
| |
| |
| |
|
Gene: MAGI3 |
Gene summary for MAGI3 |
| Gene information | Species | Human | Gene symbol | MAGI3 | Gene ID | 260425 |
| Gene name | membrane associated guanylate kinase, WW and PDZ domain containing 3 | |
| Gene Alias | MAGI-3 | |
| Cytomap | 1p13.2 | |
| Gene Type | protein-coding | GO ID | GO:0000165 | UniProtAcc | Q5TCQ9 |
Top |
Malignant transformation analysis |
| Identification of the aberrant gene expression in precancerous and cancerous lesions by comparing the gene expression of stem-like cells in diseased tissues with normal stem cells |
| Entrez ID | Symbol | Replicates | Species | Organ | Tissue | Adj P-value | Log2FC | Malignancy |
| 260425 | MAGI3 | CCI_1 | Human | Cervix | CC | 1.63e-17 | 1.86e+00 | 0.528 |
| 260425 | MAGI3 | CCI_2 | Human | Cervix | CC | 1.54e-18 | 1.90e+00 | 0.5249 |
| 260425 | MAGI3 | CCI_3 | Human | Cervix | CC | 4.04e-27 | 1.55e+00 | 0.516 |
| 260425 | MAGI3 | HTA11_3410_2000001011 | Human | Colorectum | AD | 8.43e-42 | -1.00e+00 | 0.0155 |
| 260425 | MAGI3 | HTA11_2951_2000001011 | Human | Colorectum | AD | 3.02e-09 | -1.23e+00 | 0.0216 |
| 260425 | MAGI3 | HTA11_347_2000001011 | Human | Colorectum | AD | 1.32e-19 | 7.77e-01 | -0.1954 |
| 260425 | MAGI3 | HTA11_411_2000001011 | Human | Colorectum | SER | 4.09e-04 | 5.13e-01 | -0.2602 |
| 260425 | MAGI3 | HTA11_3361_2000001011 | Human | Colorectum | AD | 7.32e-04 | -4.98e-01 | -0.1207 |
| 260425 | MAGI3 | HTA11_866_3004761011 | Human | Colorectum | AD | 8.70e-23 | -7.77e-01 | 0.096 |
| 260425 | MAGI3 | HTA11_4255_2000001011 | Human | Colorectum | SER | 4.36e-10 | -8.80e-01 | 0.0446 |
| 260425 | MAGI3 | HTA11_9408_2000001011 | Human | Colorectum | AD | 1.01e-07 | -1.04e+00 | 0.0451 |
| 260425 | MAGI3 | HTA11_8622_2000001021 | Human | Colorectum | SER | 3.35e-09 | -8.70e-01 | 0.0528 |
| 260425 | MAGI3 | HTA11_10711_2000001011 | Human | Colorectum | AD | 1.66e-15 | -7.20e-01 | 0.0338 |
| 260425 | MAGI3 | HTA11_7696_3000711011 | Human | Colorectum | AD | 1.40e-29 | -7.80e-01 | 0.0674 |
| 260425 | MAGI3 | HTA11_11156_2000001011 | Human | Colorectum | AD | 2.76e-03 | -8.77e-01 | 0.0397 |
| 260425 | MAGI3 | HTA11_6818_2000001021 | Human | Colorectum | AD | 1.45e-08 | -6.80e-01 | 0.0588 |
| 260425 | MAGI3 | HTA11_99999970781_79442 | Human | Colorectum | MSS | 7.56e-50 | -9.02e-01 | 0.294 |
| 260425 | MAGI3 | HTA11_99999971662_82457 | Human | Colorectum | MSS | 5.63e-18 | -6.70e-01 | 0.3859 |
| 260425 | MAGI3 | HTA11_99999973899_84307 | Human | Colorectum | MSS | 2.76e-11 | -8.72e-01 | 0.2585 |
| 260425 | MAGI3 | HTA11_99999974143_84620 | Human | Colorectum | MSS | 1.17e-65 | -1.12e+00 | 0.3005 |
| Page: 1 2 3 4 5 6 7 8 9 |
| Tissue | Expression Dynamics | Abbreviation |
| Cervix | 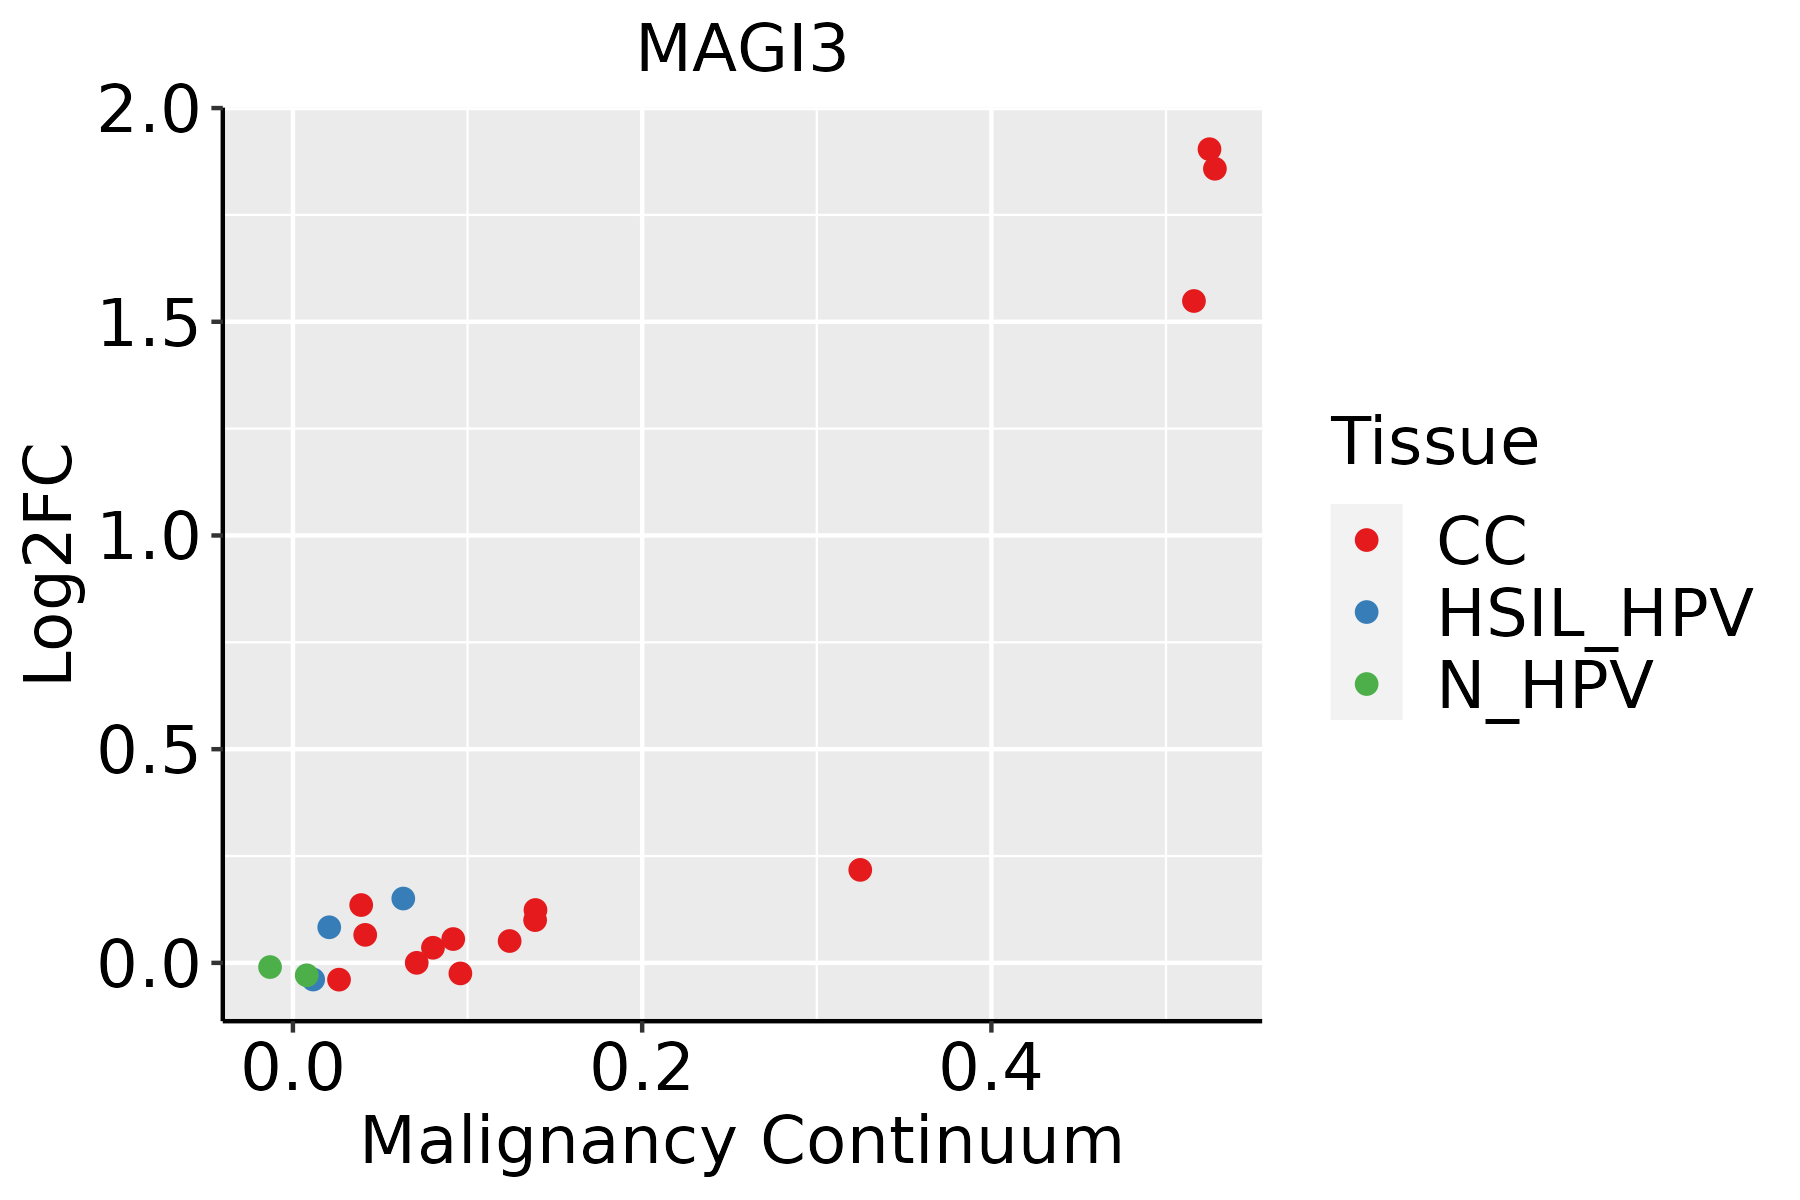 | CC: Cervix cancer |
| HSIL_HPV: HPV-infected high-grade squamous intraepithelial lesions | ||
| N_HPV: HPV-infected normal cervix | ||
| Colorectum (GSE201348) |  | FAP: Familial adenomatous polyposis |
| CRC: Colorectal cancer | ||
| Colorectum (HTA11) |  | AD: Adenomas |
| SER: Sessile serrated lesions | ||
| MSI-H: Microsatellite-high colorectal cancer | ||
| MSS: Microsatellite stable colorectal cancer | ||
| Endometrium | 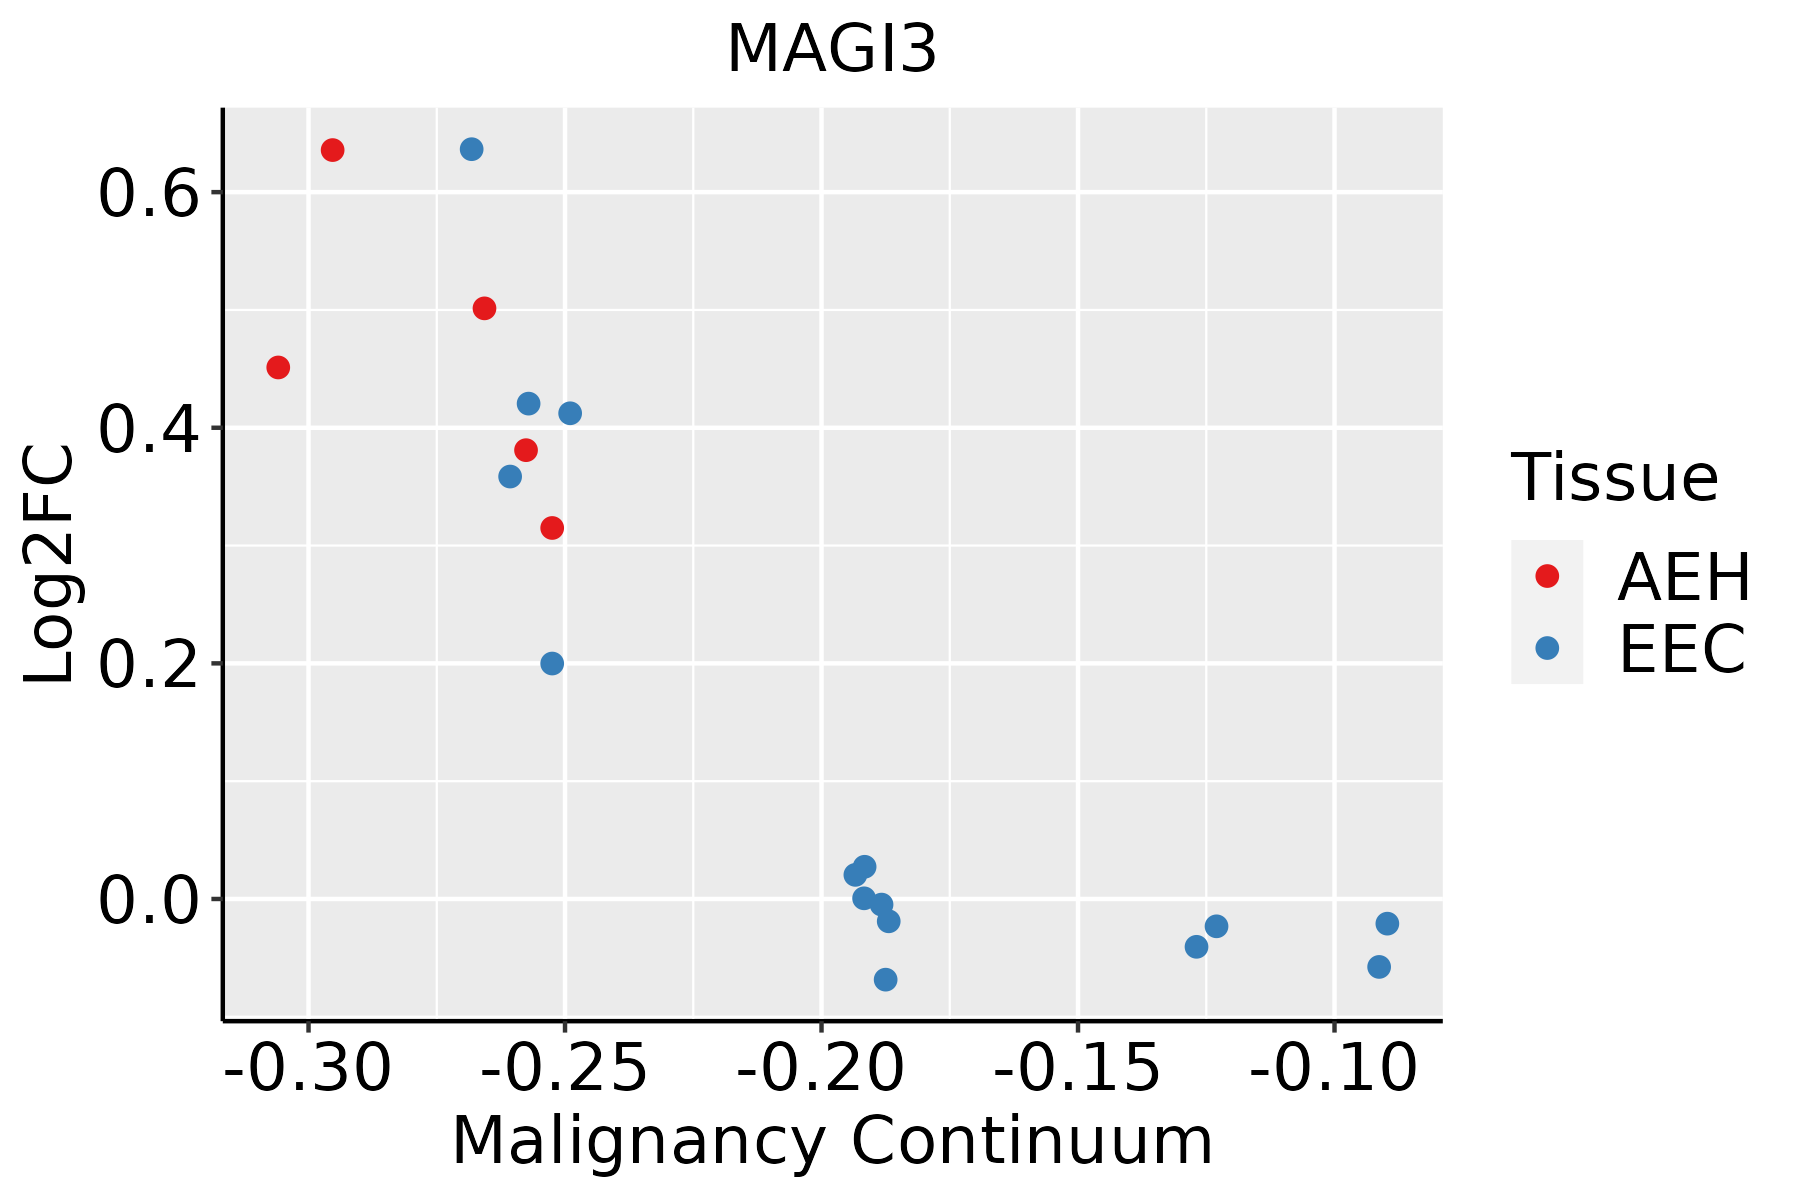 | AEH: Atypical endometrial hyperplasia |
| EEC: Endometrioid Cancer | ||
| GC | 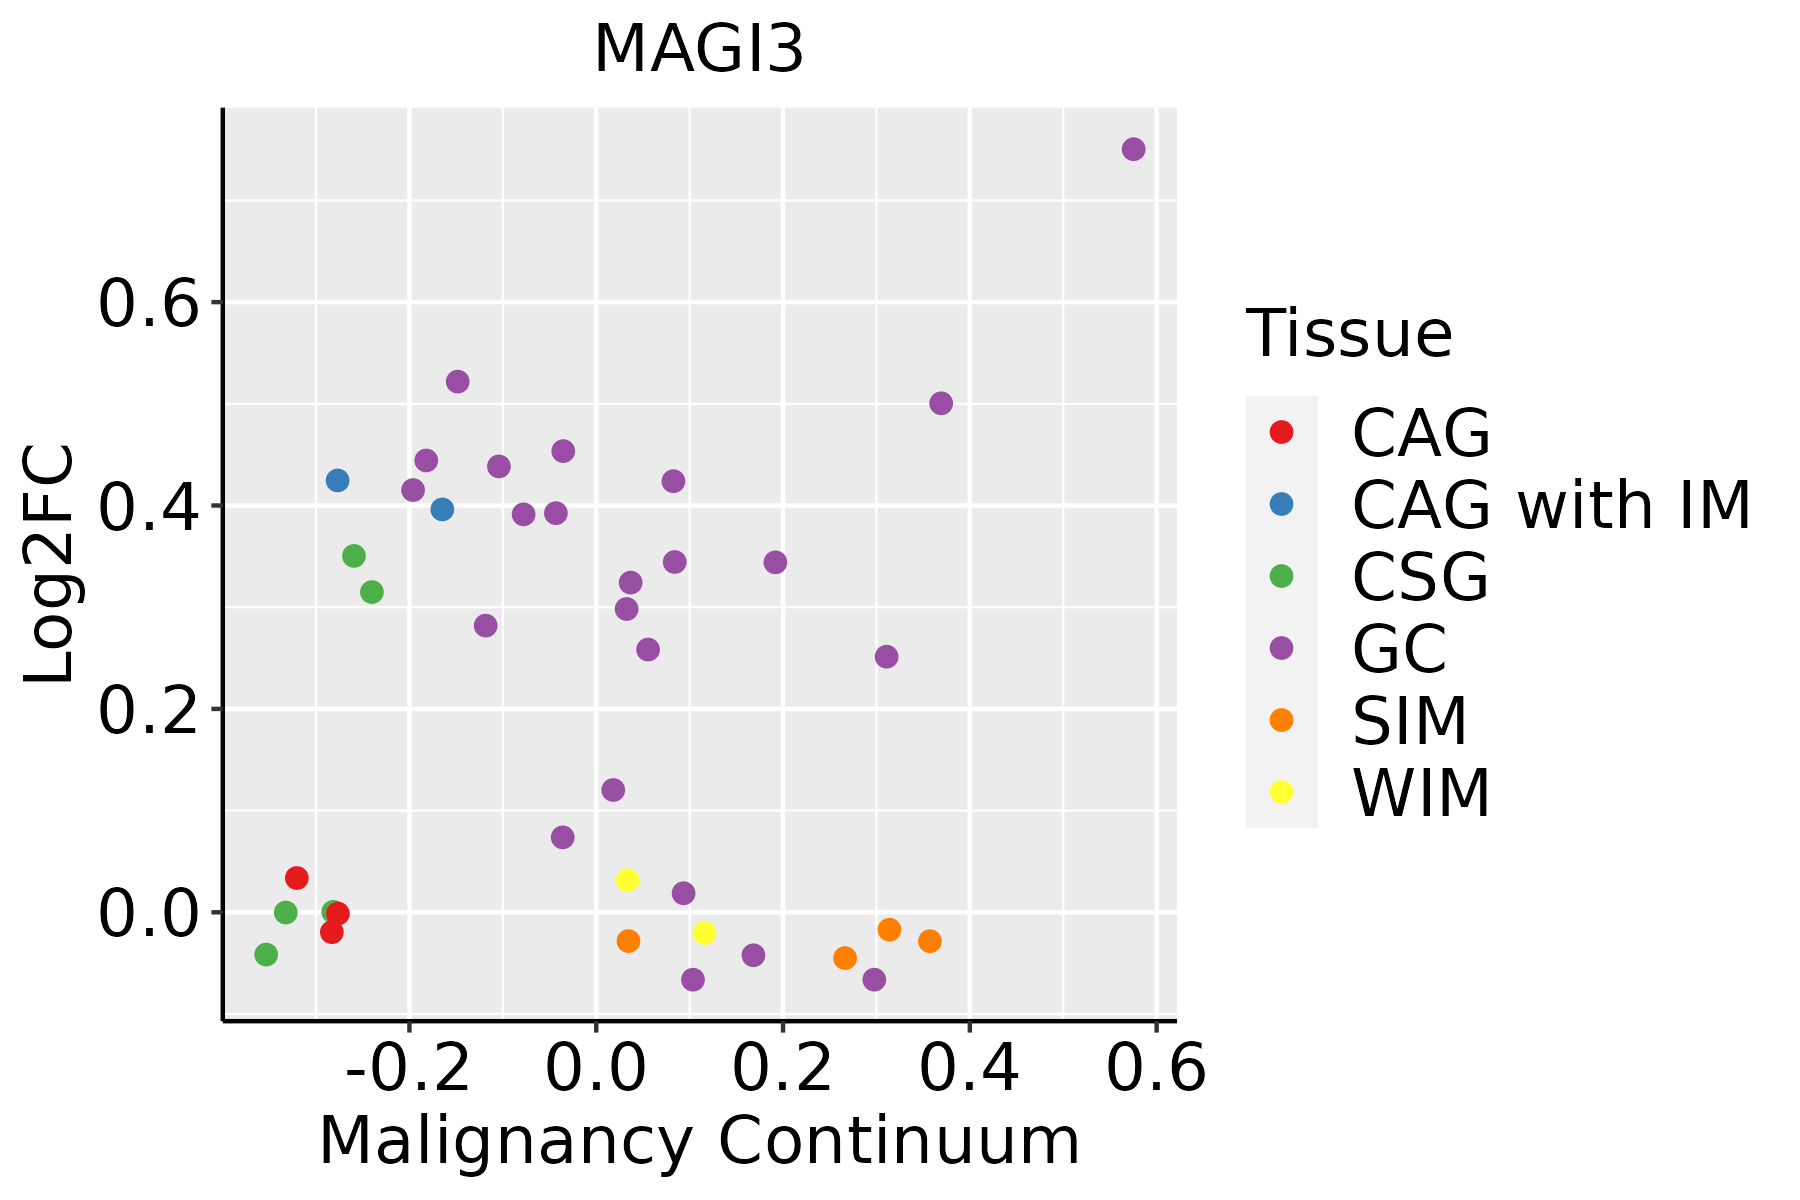 | CAG: Chronic atrophic gastritis |
| CAG with IM: Chronic atrophic gastritis with intestinal metaplasia | ||
| CSG: Chronic superficial gastritis | ||
| GC: Gastric cancer | ||
| SIM: Severe intestinal metaplasia | ||
| WIM: Wild intestinal metaplasia | ||
| Liver | 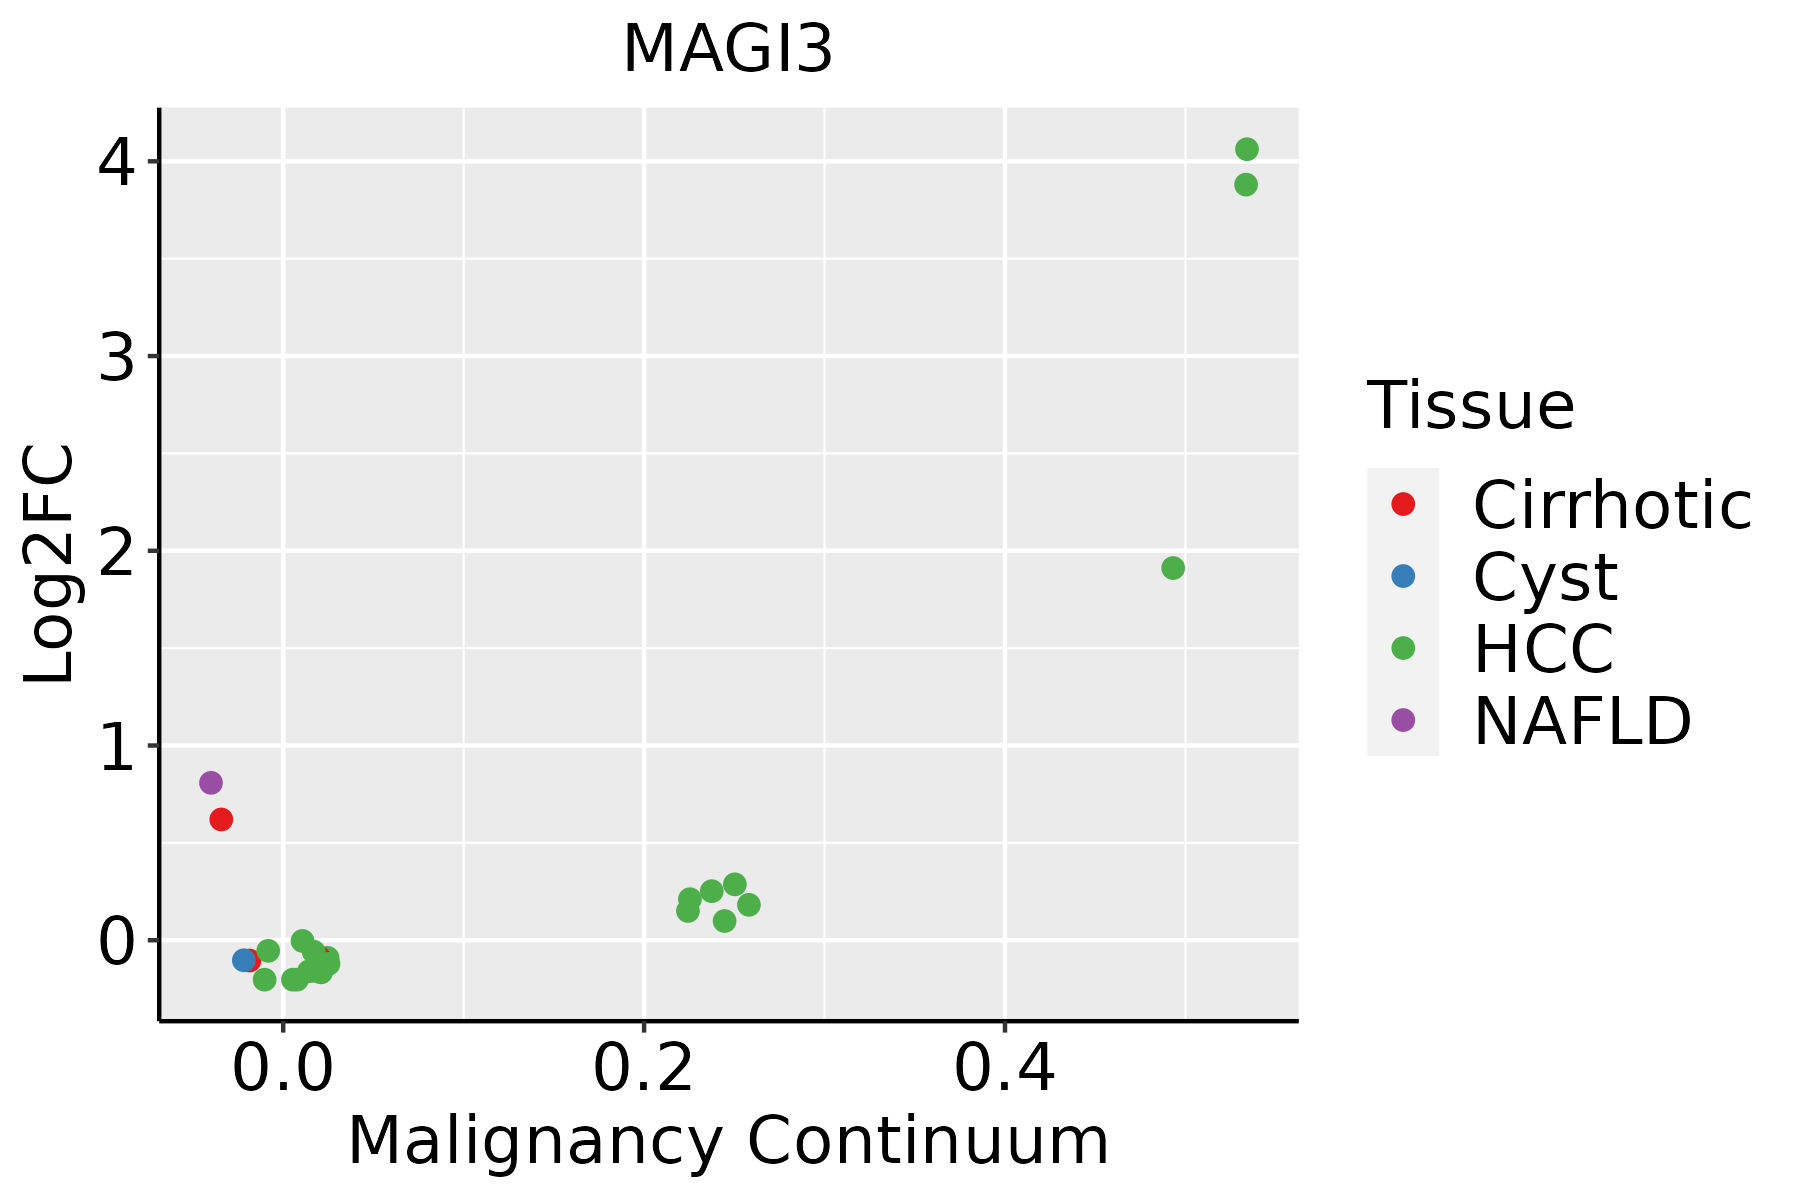 | HCC: Hepatocellular carcinoma |
| NAFLD: Non-alcoholic fatty liver disease | ||
| Lung |  | AAH: Atypical adenomatous hyperplasia |
| AIS: Adenocarcinoma in situ | ||
| IAC: Invasive lung adenocarcinoma | ||
| MIA: Minimally invasive adenocarcinoma | ||
| Oral Cavity | 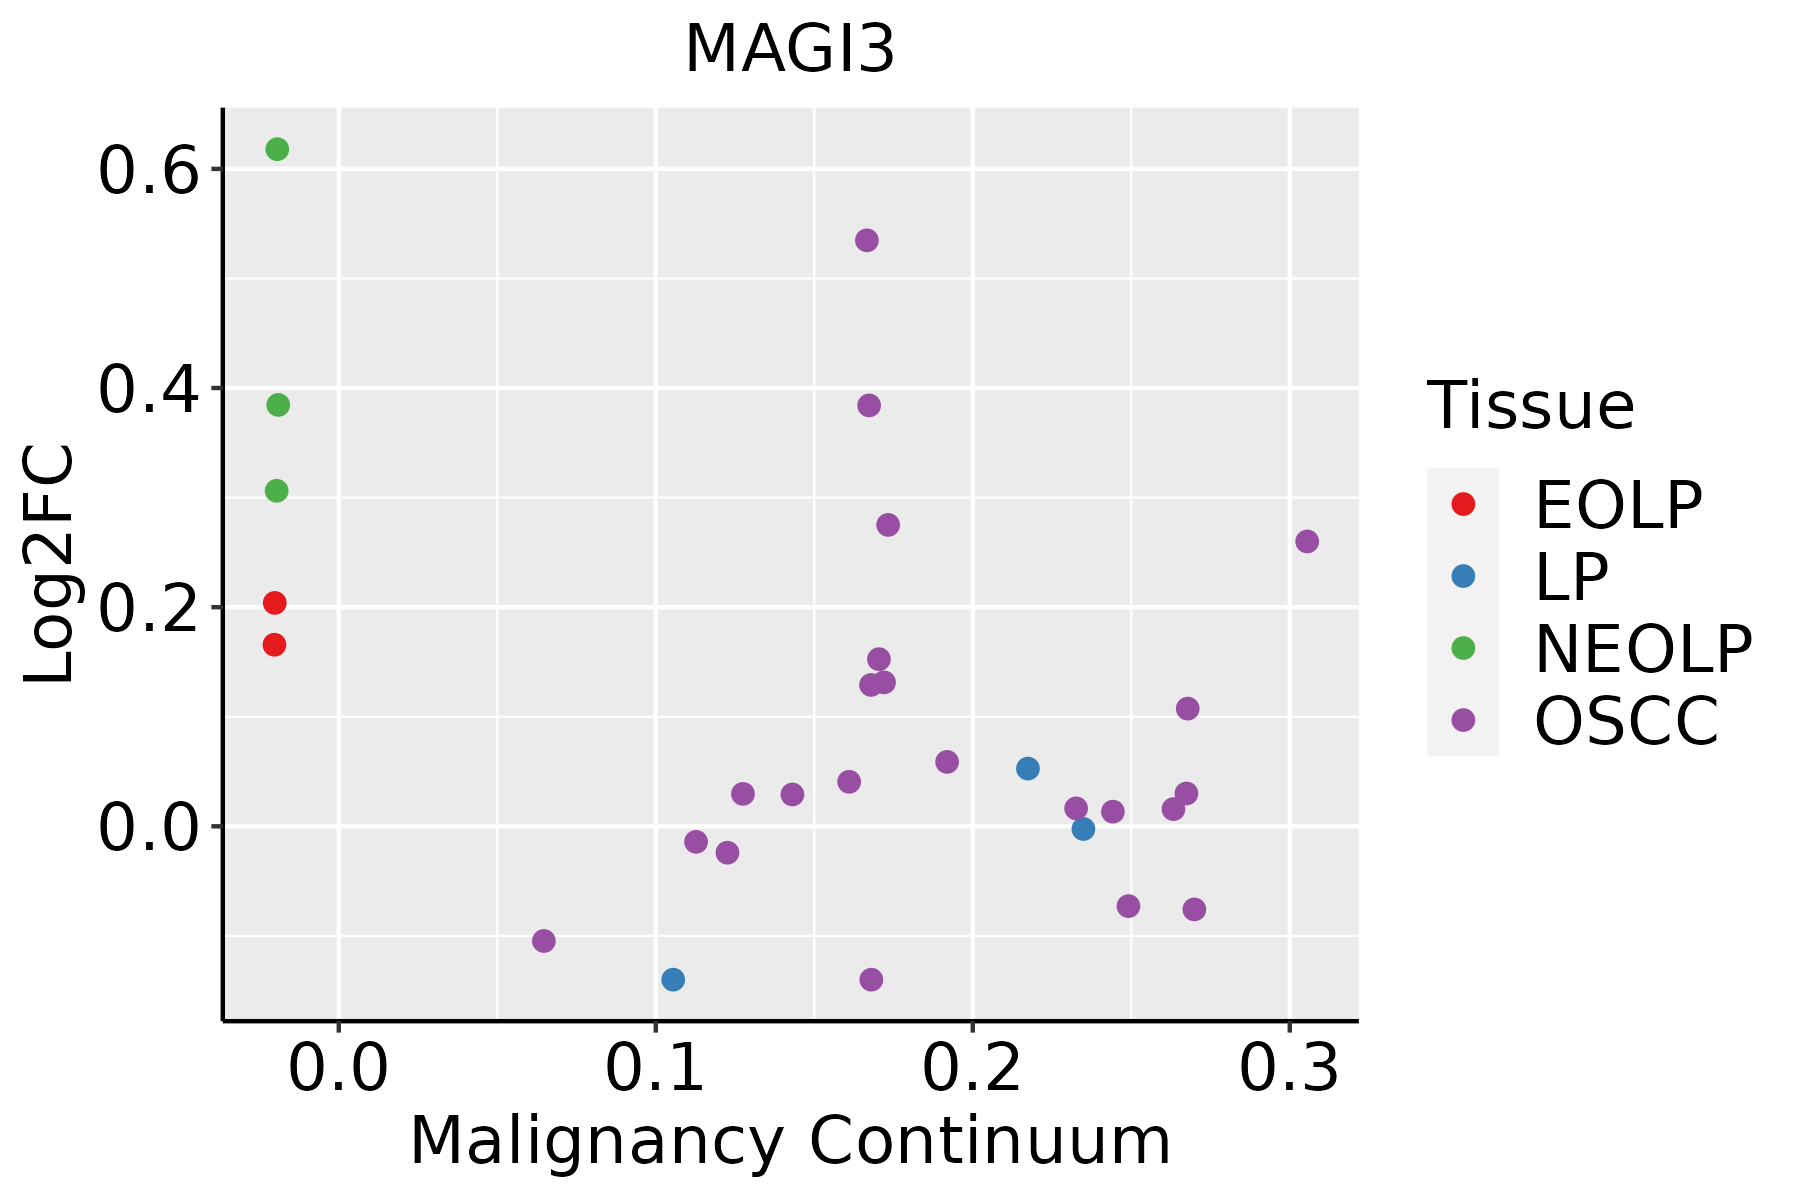 | EOLP: Erosive Oral lichen planus |
| LP: leukoplakia | ||
| NEOLP: Non-erosive oral lichen planus | ||
| OSCC: Oral squamous cell carcinoma | ||
| Prostate | 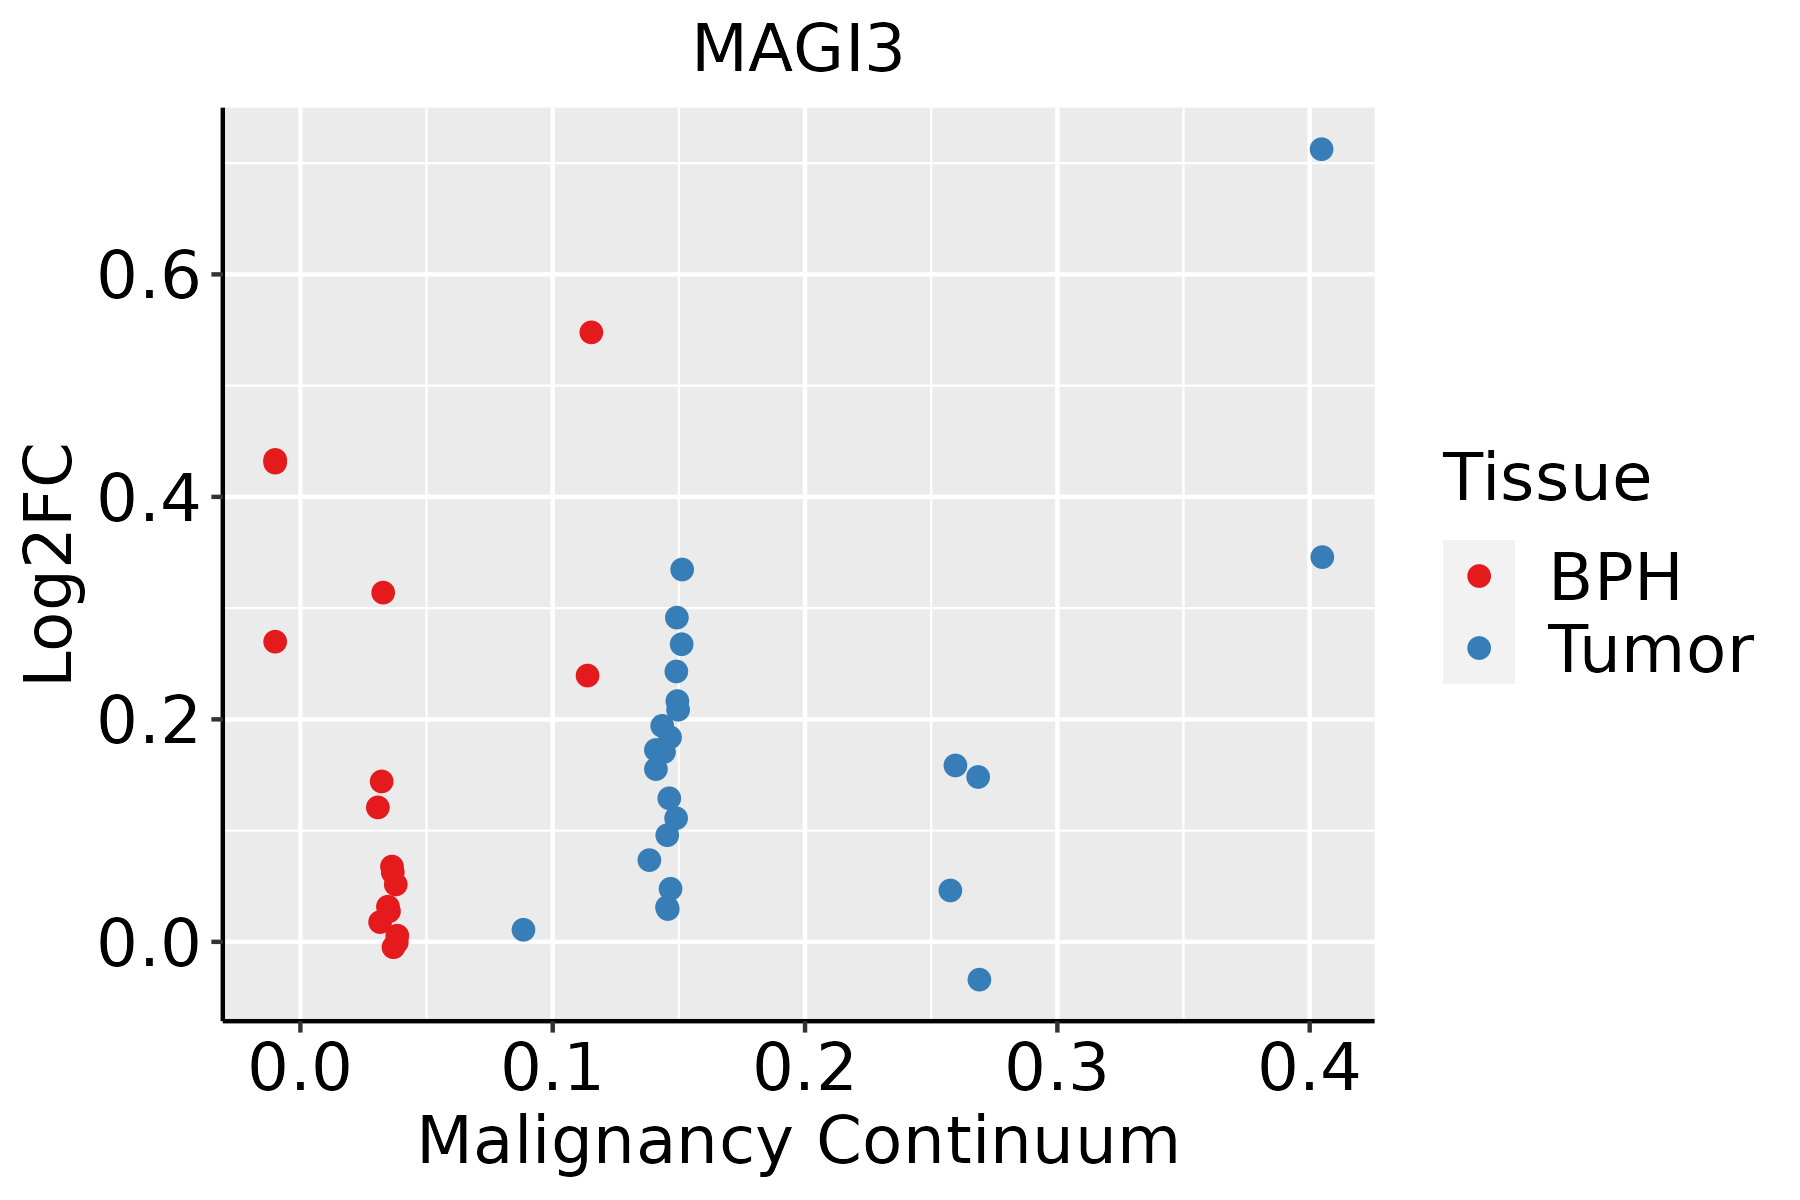 | BPH: Benign Prostatic Hyperplasia |
| Skin | 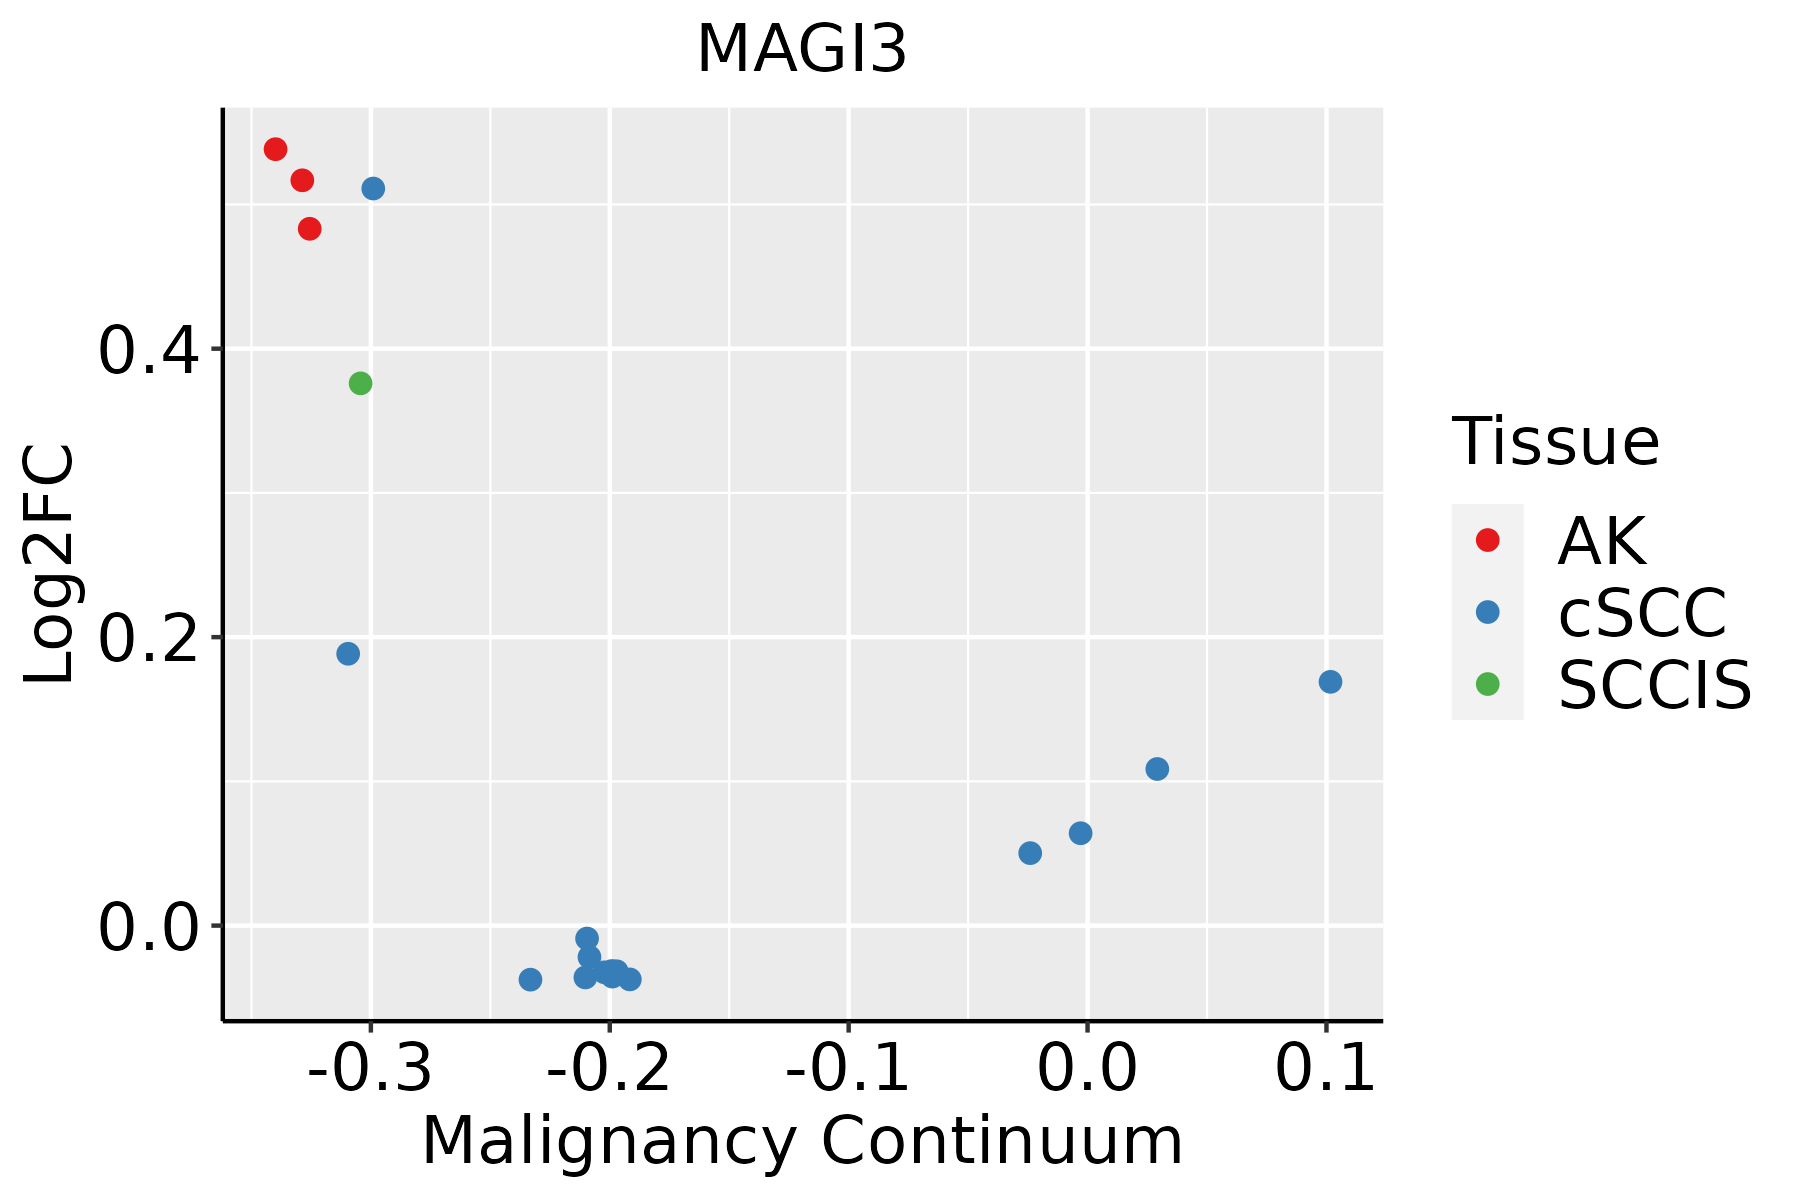 | AK: Actinic keratosis |
| cSCC: Cutaneous squamous cell carcinoma | ||
| SCCIS:squamous cell carcinoma in situ | ||
| Thyroid |  | ATC: Anaplastic thyroid cancer |
| HT: Hashimoto's thyroiditis | ||
| PTC: Papillary thyroid cancer |
| ∗log2FC in expression of this searched gene in stem-like cells from each diseased tissue sample relative to stem-like cells in normal samples in each tissue plotted against the malignancy continuum. Samples are colored based on if they are from different disease stage. |
Top |
Malignant transformation related pathway analysis |
| Find out the enriched GO biological processes and KEGG pathways involved in transition from healthy to precancer to cancer |
| Tissue | Disease Stage | Enriched GO biological Processes |
| Colorectum | AD |  |
| Colorectum | SER |  |
| Colorectum | MSS |  |
| Colorectum | MSI-H |  |
| Colorectum | FAP |  |
| ∗Top 15 enriched GO BP terms are showed in the bar plot of each disease state in each tissue. Each row represents a significant GO biological process which is colored according to the -log10(p.adjust). |
| Page: 1 2 3 4 5 6 7 8 9 |
| GO ID | Tissue | Disease Stage | Description | Gene Ratio | Bg Ratio | pvalue | p.adjust | Count |
| GO:00310988 | Cervix | CC | stress-activated protein kinase signaling cascade | 58/2311 | 247/18723 | 8.02e-07 | 2.89e-05 | 58 |
| GO:00514038 | Cervix | CC | stress-activated MAPK cascade | 55/2311 | 239/18723 | 2.96e-06 | 8.31e-05 | 55 |
| GO:00703027 | Cervix | CC | regulation of stress-activated protein kinase signaling cascade | 46/2311 | 195/18723 | 9.35e-06 | 2.11e-04 | 46 |
| GO:00328727 | Cervix | CC | regulation of stress-activated MAPK cascade | 44/2311 | 192/18723 | 3.09e-05 | 5.10e-04 | 44 |
| GO:00196939 | Cervix | CC | ribose phosphate metabolic process | 72/2311 | 396/18723 | 4.49e-04 | 4.48e-03 | 72 |
| GO:00092599 | Cervix | CC | ribonucleotide metabolic process | 70/2311 | 385/18723 | 5.35e-04 | 5.18e-03 | 70 |
| GO:000915010 | Cervix | CC | purine ribonucleotide metabolic process | 66/2311 | 368/18723 | 1.09e-03 | 9.07e-03 | 66 |
| GO:00072545 | Cervix | CC | JNK cascade | 35/2311 | 167/18723 | 1.10e-03 | 9.09e-03 | 35 |
| GO:00463285 | Cervix | CC | regulation of JNK cascade | 28/2311 | 133/18723 | 3.06e-03 | 2.01e-02 | 28 |
| GO:000616310 | Cervix | CC | purine nucleotide metabolic process | 67/2311 | 396/18723 | 4.41e-03 | 2.69e-02 | 67 |
| GO:007252110 | Cervix | CC | purine-containing compound metabolic process | 69/2311 | 416/18723 | 6.27e-03 | 3.54e-02 | 69 |
| GO:000913510 | Cervix | CC | purine nucleoside diphosphate metabolic process | 22/2311 | 103/18723 | 6.75e-03 | 3.71e-02 | 22 |
| GO:000917910 | Cervix | CC | purine ribonucleoside diphosphate metabolic process | 22/2311 | 103/18723 | 6.75e-03 | 3.71e-02 | 22 |
| GO:000911710 | Cervix | CC | nucleotide metabolic process | 79/2311 | 489/18723 | 7.16e-03 | 3.85e-02 | 79 |
| GO:00460374 | Cervix | CC | GMP metabolic process | 6/2311 | 16/18723 | 9.35e-03 | 4.66e-02 | 6 |
| GO:00091859 | Cervix | CC | ribonucleoside diphosphate metabolic process | 22/2311 | 106/18723 | 9.52e-03 | 4.72e-02 | 22 |
| GO:0009150 | Colorectum | AD | purine ribonucleotide metabolic process | 142/3918 | 368/18723 | 4.29e-15 | 1.17e-12 | 142 |
| GO:0006163 | Colorectum | AD | purine nucleotide metabolic process | 149/3918 | 396/18723 | 1.08e-14 | 2.80e-12 | 149 |
| GO:0072521 | Colorectum | AD | purine-containing compound metabolic process | 153/3918 | 416/18723 | 4.34e-14 | 1.01e-11 | 153 |
| GO:0009259 | Colorectum | AD | ribonucleotide metabolic process | 144/3918 | 385/18723 | 5.25e-14 | 1.13e-11 | 144 |
| Page: 1 2 3 4 5 6 7 8 9 10 11 12 13 14 15 16 17 18 19 20 21 22 23 |
| Pathway ID | Tissue | Disease Stage | Description | Gene Ratio | Bg Ratio | pvalue | p.adjust | qvalue | Count |
| hsa0401512 | Cervix | CC | Rap1 signaling pathway | 56/1267 | 210/8465 | 6.23e-06 | 5.61e-05 | 3.32e-05 | 56 |
| hsa0401513 | Cervix | CC | Rap1 signaling pathway | 56/1267 | 210/8465 | 6.23e-06 | 5.61e-05 | 3.32e-05 | 56 |
| hsa04015 | Colorectum | AD | Rap1 signaling pathway | 71/2092 | 210/8465 | 1.72e-03 | 9.68e-03 | 6.18e-03 | 71 |
| hsa040151 | Colorectum | AD | Rap1 signaling pathway | 71/2092 | 210/8465 | 1.72e-03 | 9.68e-03 | 6.18e-03 | 71 |
| hsa040152 | Colorectum | SER | Rap1 signaling pathway | 54/1580 | 210/8465 | 6.55e-03 | 3.68e-02 | 2.67e-02 | 54 |
| hsa040153 | Colorectum | SER | Rap1 signaling pathway | 54/1580 | 210/8465 | 6.55e-03 | 3.68e-02 | 2.67e-02 | 54 |
| hsa040154 | Colorectum | MSS | Rap1 signaling pathway | 66/1875 | 210/8465 | 1.03e-03 | 5.94e-03 | 3.64e-03 | 66 |
| hsa040155 | Colorectum | MSS | Rap1 signaling pathway | 66/1875 | 210/8465 | 1.03e-03 | 5.94e-03 | 3.64e-03 | 66 |
| hsa040156 | Colorectum | FAP | Rap1 signaling pathway | 53/1404 | 210/8465 | 7.93e-04 | 5.14e-03 | 3.13e-03 | 53 |
| hsa040157 | Colorectum | FAP | Rap1 signaling pathway | 53/1404 | 210/8465 | 7.93e-04 | 5.14e-03 | 3.13e-03 | 53 |
| hsa040158 | Colorectum | CRC | Rap1 signaling pathway | 48/1091 | 210/8465 | 4.00e-05 | 8.70e-04 | 5.90e-04 | 48 |
| hsa040159 | Colorectum | CRC | Rap1 signaling pathway | 48/1091 | 210/8465 | 4.00e-05 | 8.70e-04 | 5.90e-04 | 48 |
| hsa0401514 | Endometrium | AEH | Rap1 signaling pathway | 49/1197 | 210/8465 | 2.03e-04 | 1.78e-03 | 1.30e-03 | 49 |
| hsa0401515 | Endometrium | AEH | Rap1 signaling pathway | 49/1197 | 210/8465 | 2.03e-04 | 1.78e-03 | 1.30e-03 | 49 |
| hsa0401522 | Endometrium | EEC | Rap1 signaling pathway | 49/1237 | 210/8465 | 4.45e-04 | 3.47e-03 | 2.59e-03 | 49 |
| hsa0401532 | Endometrium | EEC | Rap1 signaling pathway | 49/1237 | 210/8465 | 4.45e-04 | 3.47e-03 | 2.59e-03 | 49 |
| hsa0401510 | Lung | IAC | Rap1 signaling pathway | 41/1053 | 210/8465 | 2.01e-03 | 1.07e-02 | 7.10e-03 | 41 |
| hsa0401511 | Lung | IAC | Rap1 signaling pathway | 41/1053 | 210/8465 | 2.01e-03 | 1.07e-02 | 7.10e-03 | 41 |
| hsa0401521 | Lung | AIS | Rap1 signaling pathway | 41/961 | 210/8465 | 3.23e-04 | 3.38e-03 | 2.16e-03 | 41 |
| hsa0401531 | Lung | AIS | Rap1 signaling pathway | 41/961 | 210/8465 | 3.23e-04 | 3.38e-03 | 2.16e-03 | 41 |
| Page: 1 2 |
Top |
Cell-cell communication analysis |
| Identification of potential cell-cell interactions between two cell types and their ligand-receptor pairs for different disease states |
| Ligand | Receptor | LRpair | Pathway | Tissue | Disease Stage |
| Page: 1 |
Top |
Single-cell gene regulatory network inference analysis |
| Find out the significant the regulons (TFs) and the target genes of each regulon across cell types for different disease states |
| TF | Cell Type | Tissue | Disease Stage | Target Gene | RSS | Regulon Activity |
| ∗The dot plots of a searched regulon are shown for all cell subpopulations in each disease state of each tissue based on the regulon specific score inferred using pySCENIC and by calculating the average expression. |
| Page: 1 |
Top |
Somatic mutation of malignant transformation related genes |
| Annotation of somatic variants for genes involved in malignant transformation |
| Hugo Symbol | Variant Class | Variant Classification | dbSNP RS | HGVSc | HGVSp | HGVSp Short | SWISSPROT | BIOTYPE | SIFT | PolyPhen | Tumor Sample Barcode | Tissue | Histology | Sex | Age | Stage | Therapy Types | Drugs | Outcome |
| MAGI3 | SNV | Missense_Mutation | novel | c.77N>T | p.Pro26Leu | p.P26L | Q5TCQ9 | protein_coding | tolerated(0.34) | benign(0.088) | TCGA-5L-AAT1-01 | Breast | breast invasive carcinoma | Female | <65 | III/IV | Hormone Therapy | letrozol | SD |
| MAGI3 | SNV | Missense_Mutation | c.2056N>A | p.Gln686Lys | p.Q686K | Q5TCQ9 | protein_coding | deleterious(0.04) | possibly_damaging(0.493) | TCGA-5L-AAT1-01 | Breast | breast invasive carcinoma | Female | <65 | III/IV | Hormone Therapy | letrozol | SD | |
| MAGI3 | SNV | Missense_Mutation | novel | c.1031G>T | p.Gly344Val | p.G344V | Q5TCQ9 | protein_coding | deleterious(0) | probably_damaging(1) | TCGA-5T-A9QA-01 | Breast | breast invasive carcinoma | Female | <65 | I/II | Chemotherapy | taxol | SD |
| MAGI3 | SNV | Missense_Mutation | c.3715N>C | p.Ile1239Leu | p.I1239L | Q5TCQ9 | protein_coding | tolerated_low_confidence(0.65) | benign(0.001) | TCGA-A7-A13E-01 | Breast | breast invasive carcinoma | Female | <65 | I/II | Targeted Molecular therapy | bevacizumab | PD | |
| MAGI3 | SNV | Missense_Mutation | c.3508N>C | p.Lys1170Gln | p.K1170Q | Q5TCQ9 | protein_coding | tolerated_low_confidence(0.07) | possibly_damaging(0.59) | TCGA-AN-A0FL-01 | Breast | breast invasive carcinoma | Female | <65 | I/II | Unknown | Unknown | SD | |
| MAGI3 | SNV | Missense_Mutation | rs573108619 | c.3941G>A | p.Arg1314Gln | p.R1314Q | Q5TCQ9 | protein_coding | tolerated_low_confidence(0.3) | benign(0.001) | TCGA-AN-A0FV-01 | Breast | breast invasive carcinoma | Female | <65 | I/II | Unknown | Unknown | SD |
| MAGI3 | SNV | Missense_Mutation | novel | c.655N>G | p.Gln219Glu | p.Q219E | Q5TCQ9 | protein_coding | deleterious(0.03) | possibly_damaging(0.845) | TCGA-AR-A2LE-01 | Breast | breast invasive carcinoma | Female | >=65 | I/II | Hormone Therapy | tamoxiphen | PD |
| MAGI3 | SNV | Missense_Mutation | novel | c.1433A>C | p.Gln478Pro | p.Q478P | Q5TCQ9 | protein_coding | deleterious(0) | probably_damaging(0.998) | TCGA-E2-A56Z-01 | Breast | breast invasive carcinoma | Female | >=65 | I/II | Hormone Therapy | arimidex | SD |
| MAGI3 | SNV | Missense_Mutation | novel | c.3782G>T | p.Gly1261Val | p.G1261V | Q5TCQ9 | protein_coding | tolerated_low_confidence(0.22) | benign(0.003) | TCGA-E2-A573-01 | Breast | breast invasive carcinoma | Female | <65 | I/II | Chemotherapy | taxotere | CR |
| MAGI3 | SNV | Missense_Mutation | novel | c.3708N>T | p.Leu1236Phe | p.L1236F | Q5TCQ9 | protein_coding | tolerated_low_confidence(0.44) | benign(0.157) | TCGA-E9-A22D-01 | Breast | breast invasive carcinoma | Female | <65 | I/II | Chemotherapy | 5-fluorouracil | SD |
| Page: 1 2 3 4 5 6 7 8 9 10 11 12 13 14 |
Top |
Related drugs of malignant transformation related genes |
| Identification of chemicals and drugs interact with genes involved in malignant transfromation |
| (DGIdb 4.0) |
| Entrez ID | Symbol | Category | Interaction Types | Drug Claim Name | Drug Name | PMIDs |
| Page: 1 |

Copyright 2023-Present -The University of Texas Health Science Center at Houston |