
|
|||||
|
 | |
| |
| |
| |
| |
| |
|
Gene: MAGI2 |
Gene summary for MAGI2 |
| Gene information | Species | Human | Gene symbol | MAGI2 | Gene ID | 9863 |
| Gene name | membrane associated guanylate kinase, WW and PDZ domain containing 2 | |
| Gene Alias | ACVRIP1 | |
| Cytomap | 7q21.11 | |
| Gene Type | protein-coding | GO ID | GO:0001655 | UniProtAcc | B7Z4H4 |
Top |
Malignant transformation analysis |
| Identification of the aberrant gene expression in precancerous and cancerous lesions by comparing the gene expression of stem-like cells in diseased tissues with normal stem cells |
| Entrez ID | Symbol | Replicates | Species | Organ | Tissue | Adj P-value | Log2FC | Malignancy |
| 9863 | MAGI2 | HTA11_78_2000001011 | Human | Colorectum | AD | 1.45e-12 | 8.80e-01 | -0.1088 |
| 9863 | MAGI2 | HTA11_99999965062_69753 | Human | Colorectum | MSI-H | 3.30e-02 | 7.79e-01 | 0.3487 |
| 9863 | MAGI2 | NAFLD1 | Human | Liver | NAFLD | 3.71e-15 | 1.38e+00 | -0.04 |
| 9863 | MAGI2 | S41 | Human | Liver | Cirrhotic | 5.12e-05 | 7.66e-01 | -0.0343 |
| 9863 | MAGI2 | HCC1_Meng | Human | Liver | HCC | 3.08e-12 | -2.49e-01 | 0.0246 |
| 9863 | MAGI2 | HCC2_Meng | Human | Liver | HCC | 1.14e-09 | -2.07e-01 | 0.0107 |
| 9863 | MAGI2 | cirrhotic1 | Human | Liver | Cirrhotic | 1.22e-03 | -2.14e-01 | 0.0202 |
| 9863 | MAGI2 | cirrhotic2 | Human | Liver | Cirrhotic | 6.69e-03 | -2.25e-01 | 0.0201 |
| 9863 | MAGI2 | HCC1 | Human | Liver | HCC | 1.82e-24 | 4.45e-01 | 0.5336 |
| 9863 | MAGI2 | Pt13.a | Human | Liver | HCC | 1.28e-04 | -2.52e-01 | 0.021 |
| 9863 | MAGI2 | Pt14.d | Human | Liver | HCC | 1.35e-04 | -2.50e-01 | 0.0143 |
| 9863 | MAGI2 | RNA-P10T2-P10T2-1 | Human | Lung | AAH | 4.07e-06 | 9.73e-01 | -0.1271 |
| 9863 | MAGI2 | RNA-P10T2-P10T2-2 | Human | Lung | AAH | 2.23e-03 | 8.33e-01 | -0.1406 |
| 9863 | MAGI2 | RNA-P10T2-P10T2-3 | Human | Lung | AAH | 1.79e-06 | 9.98e-01 | -0.1408 |
| 9863 | MAGI2 | RNA-P10T2-P10T2-4 | Human | Lung | AAH | 4.69e-04 | 8.04e-01 | -0.138 |
| 9863 | MAGI2 | RNA-P25T1-P25T1-1 | Human | Lung | AIS | 2.73e-09 | 6.94e-01 | -0.2116 |
| 9863 | MAGI2 | RNA-P25T1-P25T1-2 | Human | Lung | AIS | 2.57e-02 | 6.58e-01 | -0.1941 |
| 9863 | MAGI2 | RNA-P25T1-P25T1-4 | Human | Lung | AIS | 1.16e-06 | 6.41e-01 | -0.2119 |
| 9863 | MAGI2 | RNA-P6T1-P6T1-2 | Human | Lung | MIAC | 9.31e-08 | 1.21e+00 | -0.0186 |
| 9863 | MAGI2 | RNA-P7T1-P7T1-1 | Human | Lung | AIS | 3.66e-09 | 1.15e+00 | -0.0961 |
| Page: 1 2 3 |
| Tissue | Expression Dynamics | Abbreviation |
| Colorectum (GSE201348) |  | FAP: Familial adenomatous polyposis |
| CRC: Colorectal cancer | ||
| Colorectum (HTA11) |  | AD: Adenomas |
| SER: Sessile serrated lesions | ||
| MSI-H: Microsatellite-high colorectal cancer | ||
| MSS: Microsatellite stable colorectal cancer | ||
| Liver | 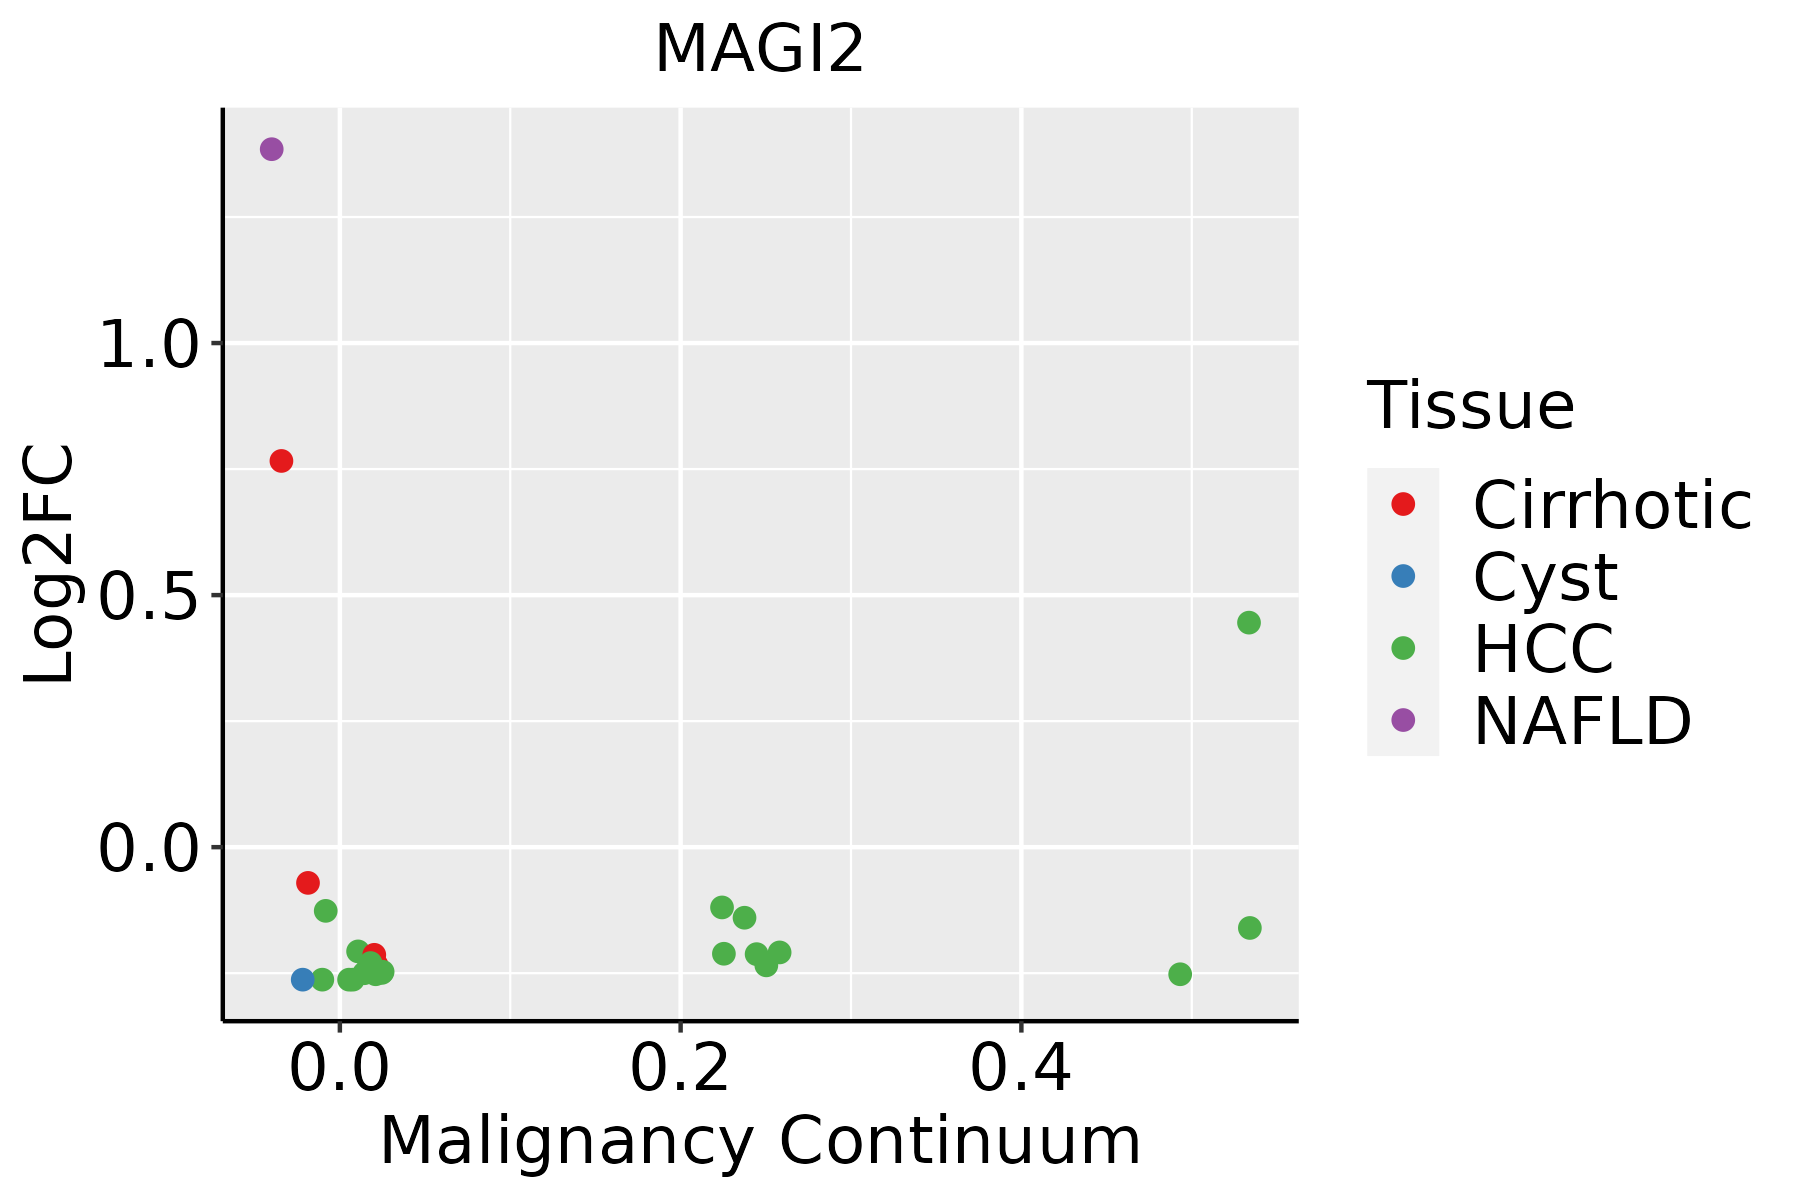 | HCC: Hepatocellular carcinoma |
| NAFLD: Non-alcoholic fatty liver disease | ||
| Lung | 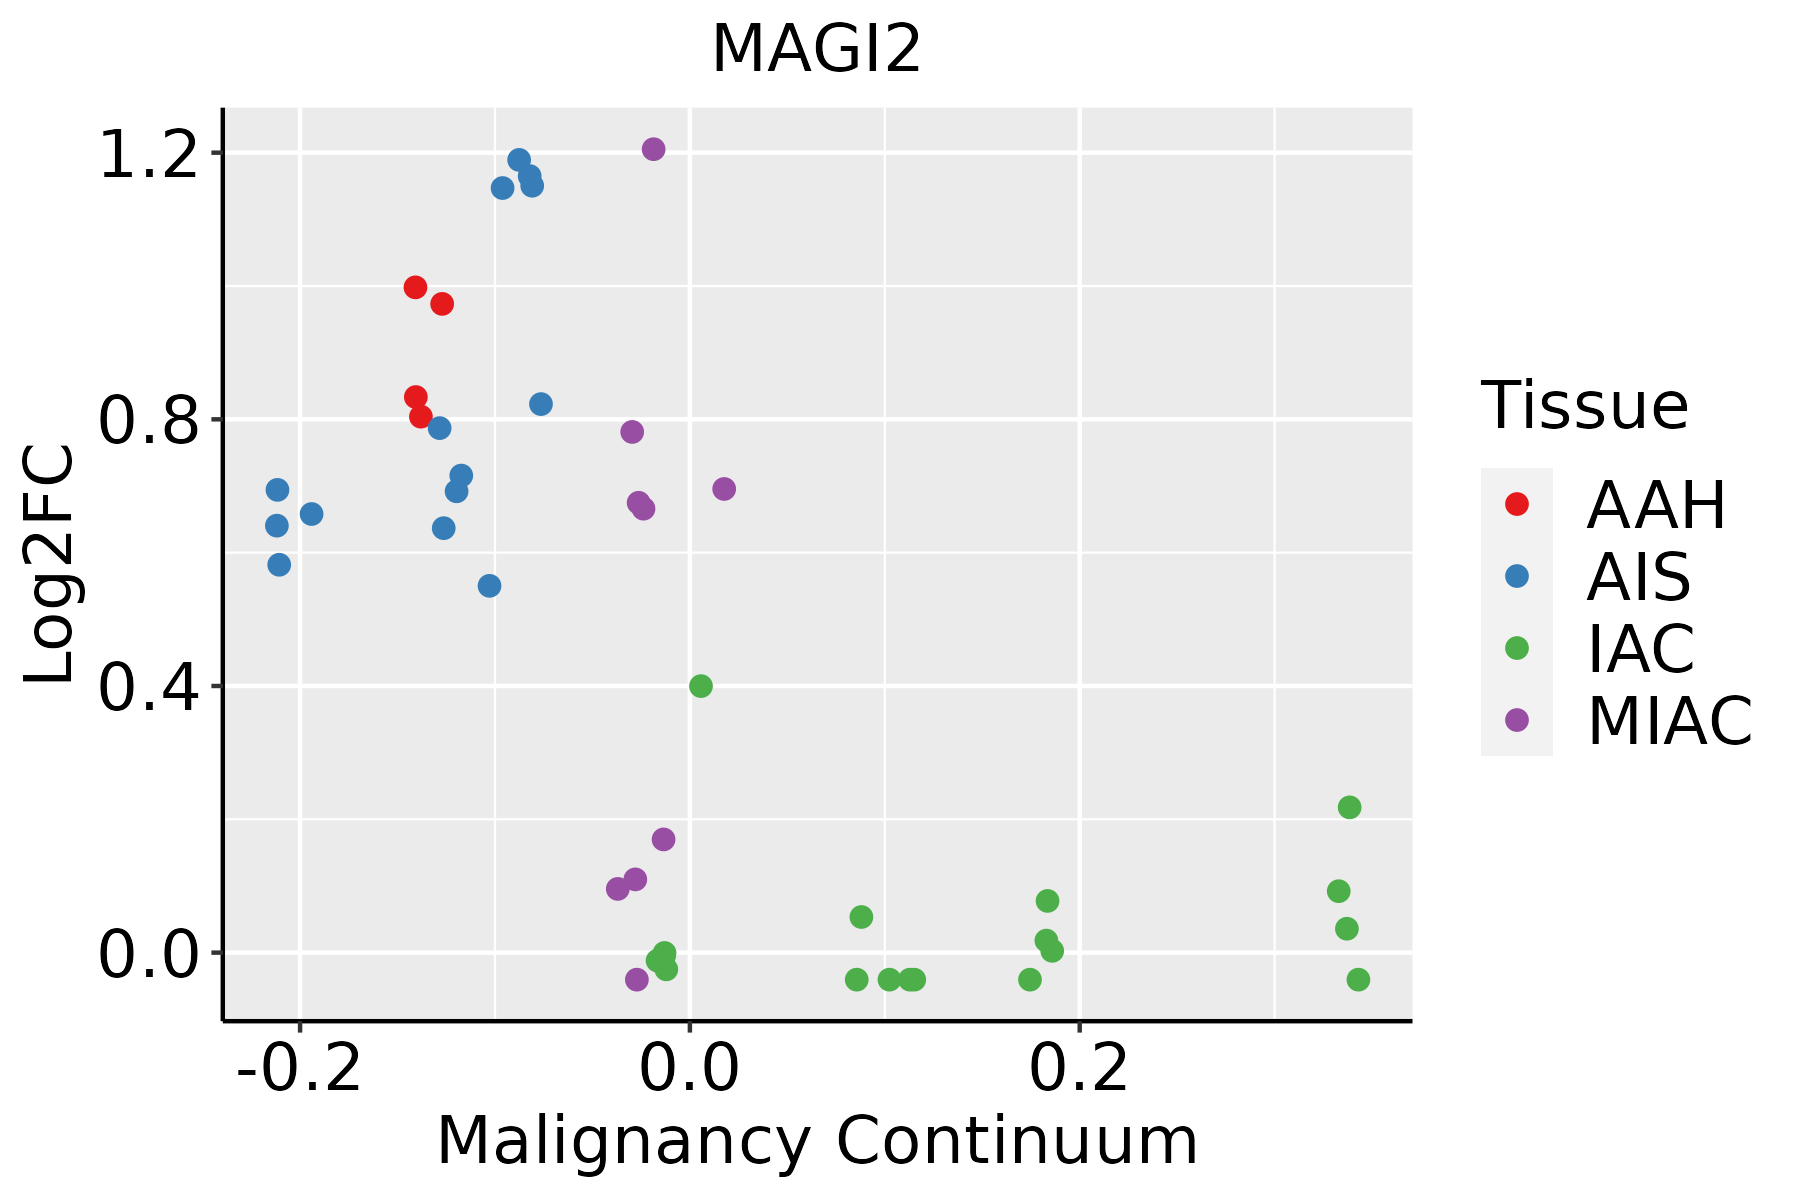 | AAH: Atypical adenomatous hyperplasia |
| AIS: Adenocarcinoma in situ | ||
| IAC: Invasive lung adenocarcinoma | ||
| MIA: Minimally invasive adenocarcinoma | ||
| Prostate | 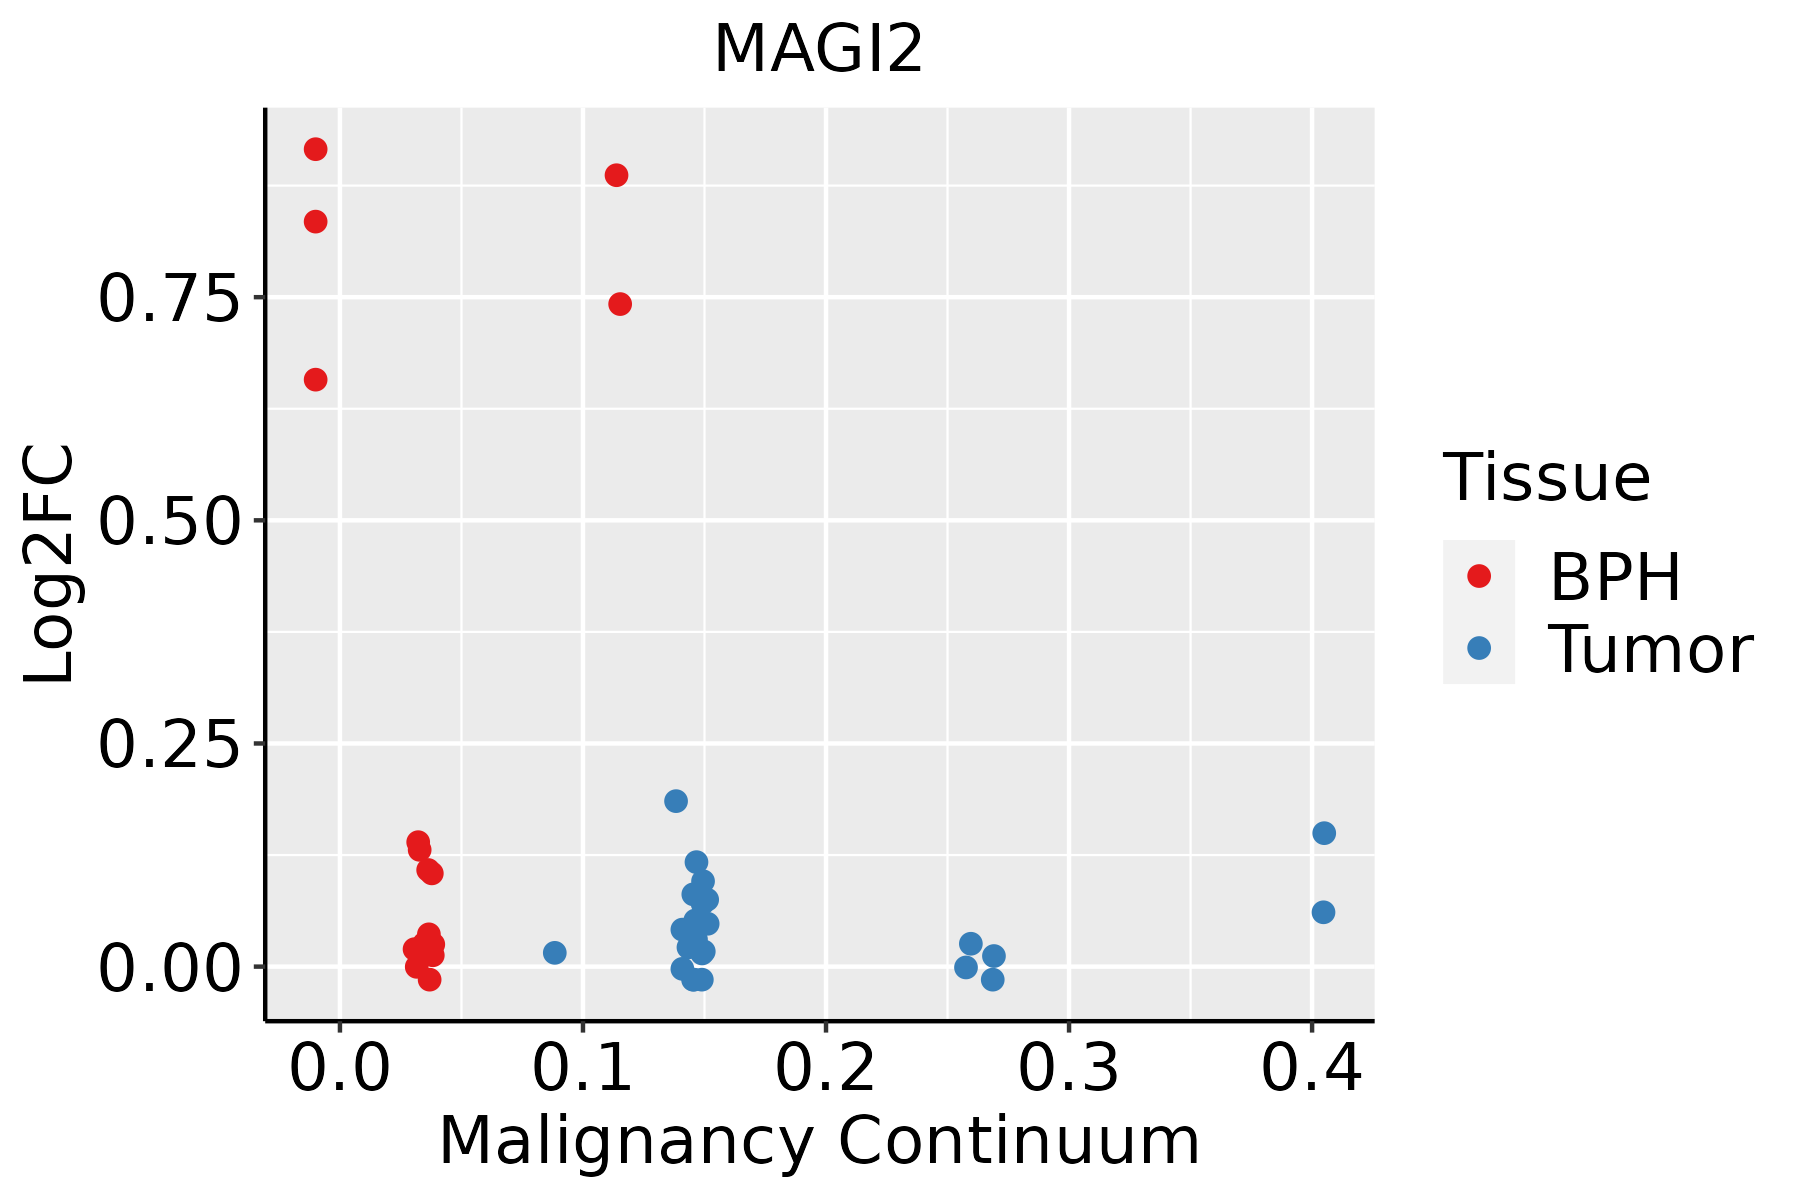 | BPH: Benign Prostatic Hyperplasia |
| Thyroid |  | ATC: Anaplastic thyroid cancer |
| HT: Hashimoto's thyroiditis | ||
| PTC: Papillary thyroid cancer |
| ∗log2FC in expression of this searched gene in stem-like cells from each diseased tissue sample relative to stem-like cells in normal samples in each tissue plotted against the malignancy continuum. Samples are colored based on if they are from different disease stage. |
Top |
Malignant transformation related pathway analysis |
| Find out the enriched GO biological processes and KEGG pathways involved in transition from healthy to precancer to cancer |
| Tissue | Disease Stage | Enriched GO biological Processes |
| Colorectum | AD |  |
| Colorectum | SER |  |
| Colorectum | MSS |  |
| Colorectum | MSI-H |  |
| Colorectum | FAP |  |
| ∗Top 15 enriched GO BP terms are showed in the bar plot of each disease state in each tissue. Each row represents a significant GO biological process which is colored according to the -log10(p.adjust). |
| Page: 1 2 3 4 5 6 7 8 9 |
| GO ID | Tissue | Disease Stage | Description | Gene Ratio | Bg Ratio | pvalue | p.adjust | Count |
| GO:0002064 | Colorectum | AD | epithelial cell development | 89/3918 | 220/18723 | 2.98e-11 | 3.52e-09 | 89 |
| GO:0043112 | Colorectum | AD | receptor metabolic process | 62/3918 | 166/18723 | 8.18e-07 | 2.85e-05 | 62 |
| GO:1990090 | Colorectum | AD | cellular response to nerve growth factor stimulus | 26/3918 | 53/18723 | 4.87e-06 | 1.28e-04 | 26 |
| GO:0016055 | Colorectum | AD | Wnt signaling pathway | 130/3918 | 444/18723 | 1.60e-05 | 3.37e-04 | 130 |
| GO:1990089 | Colorectum | AD | response to nerve growth factor | 26/3918 | 56/18723 | 1.71e-05 | 3.59e-04 | 26 |
| GO:0016311 | Colorectum | AD | dephosphorylation | 123/3918 | 417/18723 | 1.84e-05 | 3.82e-04 | 123 |
| GO:0198738 | Colorectum | AD | cell-cell signaling by wnt | 130/3918 | 446/18723 | 2.02e-05 | 4.10e-04 | 130 |
| GO:0006470 | Colorectum | AD | protein dephosphorylation | 88/3918 | 281/18723 | 2.56e-05 | 4.89e-04 | 88 |
| GO:0010975 | Colorectum | AD | regulation of neuron projection development | 129/3918 | 445/18723 | 2.88e-05 | 5.37e-04 | 129 |
| GO:0035303 | Colorectum | AD | regulation of dephosphorylation | 46/3918 | 128/18723 | 6.20e-05 | 1.04e-03 | 46 |
| GO:0031346 | Colorectum | AD | positive regulation of cell projection organization | 104/3918 | 353/18723 | 8.26e-05 | 1.30e-03 | 104 |
| GO:0006898 | Colorectum | AD | receptor-mediated endocytosis | 76/3918 | 244/18723 | 1.07e-04 | 1.59e-03 | 76 |
| GO:0030100 | Colorectum | AD | regulation of endocytosis | 67/3918 | 211/18723 | 1.42e-04 | 2.01e-03 | 67 |
| GO:0035304 | Colorectum | AD | regulation of protein dephosphorylation | 33/3918 | 90/18723 | 4.23e-04 | 4.77e-03 | 33 |
| GO:0045807 | Colorectum | AD | positive regulation of endocytosis | 35/3918 | 100/18723 | 7.78e-04 | 7.78e-03 | 35 |
| GO:0007178 | Colorectum | AD | transmembrane receptor protein serine/threonine kinase signaling pathway | 99/3918 | 355/18723 | 9.92e-04 | 9.28e-03 | 99 |
| GO:0010921 | Colorectum | AD | regulation of phosphatase activity | 30/3918 | 84/18723 | 1.24e-03 | 1.09e-02 | 30 |
| GO:0010922 | Colorectum | AD | positive regulation of phosphatase activity | 15/3918 | 34/18723 | 1.96e-03 | 1.58e-02 | 15 |
| GO:0035306 | Colorectum | AD | positive regulation of dephosphorylation | 22/3918 | 59/18723 | 2.86e-03 | 2.14e-02 | 22 |
| GO:0048260 | Colorectum | AD | positive regulation of receptor-mediated endocytosis | 20/3918 | 52/18723 | 2.87e-03 | 2.14e-02 | 20 |
| Page: 1 2 3 4 5 6 7 8 9 10 11 12 13 14 15 16 |
| Pathway ID | Tissue | Disease Stage | Description | Gene Ratio | Bg Ratio | pvalue | p.adjust | qvalue | Count |
| hsa04015 | Colorectum | AD | Rap1 signaling pathway | 71/2092 | 210/8465 | 1.72e-03 | 9.68e-03 | 6.18e-03 | 71 |
| hsa040151 | Colorectum | AD | Rap1 signaling pathway | 71/2092 | 210/8465 | 1.72e-03 | 9.68e-03 | 6.18e-03 | 71 |
| hsa0401521 | Lung | AIS | Rap1 signaling pathway | 41/961 | 210/8465 | 3.23e-04 | 3.38e-03 | 2.16e-03 | 41 |
| hsa0415121 | Lung | AIS | PI3K-Akt signaling pathway | 57/961 | 354/8465 | 3.72e-03 | 2.00e-02 | 1.28e-02 | 57 |
| hsa0401531 | Lung | AIS | Rap1 signaling pathway | 41/961 | 210/8465 | 3.23e-04 | 3.38e-03 | 2.16e-03 | 41 |
| hsa0415131 | Lung | AIS | PI3K-Akt signaling pathway | 57/961 | 354/8465 | 3.72e-03 | 2.00e-02 | 1.28e-02 | 57 |
| hsa0401541 | Lung | AAH | Rap1 signaling pathway | 20/348 | 210/8465 | 3.89e-04 | 1.35e-02 | 1.09e-02 | 20 |
| hsa0401551 | Lung | AAH | Rap1 signaling pathway | 20/348 | 210/8465 | 3.89e-04 | 1.35e-02 | 1.09e-02 | 20 |
| hsa0401561 | Lung | MIAC | Rap1 signaling pathway | 29/507 | 210/8465 | 1.94e-05 | 9.40e-04 | 6.80e-04 | 29 |
| hsa0401571 | Lung | MIAC | Rap1 signaling pathway | 29/507 | 210/8465 | 1.94e-05 | 9.40e-04 | 6.80e-04 | 29 |
| hsa041515 | Prostate | BPH | PI3K-Akt signaling pathway | 104/1718 | 354/8465 | 2.07e-05 | 1.55e-04 | 9.61e-05 | 104 |
| hsa0401516 | Prostate | BPH | Rap1 signaling pathway | 61/1718 | 210/8465 | 1.40e-03 | 5.85e-03 | 3.62e-03 | 61 |
| hsa0415112 | Prostate | BPH | PI3K-Akt signaling pathway | 104/1718 | 354/8465 | 2.07e-05 | 1.55e-04 | 9.61e-05 | 104 |
| hsa0401517 | Prostate | BPH | Rap1 signaling pathway | 61/1718 | 210/8465 | 1.40e-03 | 5.85e-03 | 3.62e-03 | 61 |
| Page: 1 |
Top |
Cell-cell communication analysis |
| Identification of potential cell-cell interactions between two cell types and their ligand-receptor pairs for different disease states |
| Ligand | Receptor | LRpair | Pathway | Tissue | Disease Stage |
| Page: 1 |
Top |
Single-cell gene regulatory network inference analysis |
| Find out the significant the regulons (TFs) and the target genes of each regulon across cell types for different disease states |
| TF | Cell Type | Tissue | Disease Stage | Target Gene | RSS | Regulon Activity |
| ∗The dot plots of a searched regulon are shown for all cell subpopulations in each disease state of each tissue based on the regulon specific score inferred using pySCENIC and by calculating the average expression. |
| Page: 1 |
Top |
Somatic mutation of malignant transformation related genes |
| Annotation of somatic variants for genes involved in malignant transformation |
| Hugo Symbol | Variant Class | Variant Classification | dbSNP RS | HGVSc | HGVSp | HGVSp Short | SWISSPROT | BIOTYPE | SIFT | PolyPhen | Tumor Sample Barcode | Tissue | Histology | Sex | Age | Stage | Therapy Types | Drugs | Outcome |
| MAGI2 | SNV | Missense_Mutation | c.1930N>A | p.Asp644Asn | p.D644N | Q86UL8 | protein_coding | deleterious(0) | probably_damaging(0.997) | TCGA-A2-A0SY-01 | Breast | breast invasive carcinoma | Female | <65 | III/IV | Hormone Therapy | arimidex | SD | |
| MAGI2 | SNV | Missense_Mutation | c.3066N>C | p.Glu1022Asp | p.E1022D | Q86UL8 | protein_coding | tolerated(0.11) | probably_damaging(0.97) | TCGA-A2-A0YJ-01 | Breast | breast invasive carcinoma | Female | <65 | III/IV | Chemotherapy | cytoxan | PD | |
| MAGI2 | SNV | Missense_Mutation | c.2983N>T | p.Ile995Phe | p.I995F | Q86UL8 | protein_coding | deleterious(0) | probably_damaging(0.997) | TCGA-A8-A07R-01 | Breast | breast invasive carcinoma | Female | >=65 | III/IV | Ancillary | zoledronic | SD | |
| MAGI2 | SNV | Missense_Mutation | c.3680N>C | p.Arg1227Thr | p.R1227T | Q86UL8 | protein_coding | tolerated(0.1) | probably_damaging(0.977) | TCGA-AC-A23H-01 | Breast | breast invasive carcinoma | Female | >=65 | I/II | Unknown | Unknown | PD | |
| MAGI2 | SNV | Missense_Mutation | novel | c.1186G>A | p.Glu396Lys | p.E396K | Q86UL8 | protein_coding | tolerated(0.19) | benign(0.169) | TCGA-AN-A046-01 | Breast | breast invasive carcinoma | Female | >=65 | I/II | Unknown | Unknown | SD |
| MAGI2 | SNV | Missense_Mutation | novel | c.2648A>G | p.His883Arg | p.H883R | Q86UL8 | protein_coding | deleterious(0.04) | benign(0.015) | TCGA-AN-A0AT-01 | Breast | breast invasive carcinoma | Female | <65 | I/II | Unknown | Unknown | SD |
| MAGI2 | SNV | Missense_Mutation | novel | c.2423N>A | p.Ile808Asn | p.I808N | Q86UL8 | protein_coding | deleterious(0) | possibly_damaging(0.899) | TCGA-AO-A0JB-01 | Breast | breast invasive carcinoma | Female | <65 | III/IV | Chemotherapy | cyclophosphamide | SD |
| MAGI2 | SNV | Missense_Mutation | c.2773N>T | p.Arg925Cys | p.R925C | Q86UL8 | protein_coding | deleterious(0) | probably_damaging(0.999) | TCGA-B6-A1KI-01 | Breast | breast invasive carcinoma | Female | <65 | I/II | Unknown | Unknown | SD | |
| MAGI2 | SNV | Missense_Mutation | c.319N>A | p.Asp107Asn | p.D107N | Q86UL8 | protein_coding | deleterious(0) | probably_damaging(0.996) | TCGA-BH-A0DE-01 | Breast | breast invasive carcinoma | Female | <65 | I/II | Unknown | Unknown | SD | |
| MAGI2 | SNV | Missense_Mutation | rs774328144 | c.3934N>A | p.Glu1312Lys | p.E1312K | Q86UL8 | protein_coding | tolerated(0.41) | benign(0.091) | TCGA-BH-A18K-01 | Breast | breast invasive carcinoma | Female | <65 | I/II | Unknown | Unknown | PD |
| Page: 1 2 3 4 5 6 7 8 9 10 11 12 13 14 15 16 17 18 19 20 21 22 23 |
Top |
Related drugs of malignant transformation related genes |
| Identification of chemicals and drugs interact with genes involved in malignant transfromation |
| (DGIdb 4.0) |
| Entrez ID | Symbol | Category | Interaction Types | Drug Claim Name | Drug Name | PMIDs |
| Page: 1 |

Copyright 2023-Present -The University of Texas Health Science Center at Houston |