
|
|||||
|
 | |
| |
| |
| |
| |
| |
|
Gene: MAGI1 |
Gene summary for MAGI1 |
| Gene information | Species | Human | Gene symbol | MAGI1 | Gene ID | 9223 |
| Gene name | membrane associated guanylate kinase, WW and PDZ domain containing 1 | |
| Gene Alias | AIP-3 | |
| Cytomap | 3p14.1 | |
| Gene Type | protein-coding | GO ID | GO:0007154 | UniProtAcc | Q96QZ7 |
Top |
Malignant transformation analysis |
| Identification of the aberrant gene expression in precancerous and cancerous lesions by comparing the gene expression of stem-like cells in diseased tissues with normal stem cells |
| Entrez ID | Symbol | Replicates | Species | Organ | Tissue | Adj P-value | Log2FC | Malignancy |
| 9223 | MAGI1 | CCI_2 | Human | Cervix | CC | 1.11e-11 | 9.02e-01 | 0.5249 |
| 9223 | MAGI1 | CCI_3 | Human | Cervix | CC | 1.39e-09 | 6.58e-01 | 0.516 |
| 9223 | MAGI1 | HTA11_3410_2000001011 | Human | Colorectum | AD | 1.10e-11 | -4.36e-01 | 0.0155 |
| 9223 | MAGI1 | HTA11_2487_2000001011 | Human | Colorectum | SER | 4.21e-02 | 3.12e-01 | -0.1808 |
| 9223 | MAGI1 | HTA11_347_2000001011 | Human | Colorectum | AD | 1.94e-21 | 7.73e-01 | -0.1954 |
| 9223 | MAGI1 | HTA11_411_2000001011 | Human | Colorectum | SER | 9.18e-05 | 7.49e-01 | -0.2602 |
| 9223 | MAGI1 | HTA11_2112_2000001011 | Human | Colorectum | SER | 5.94e-05 | 2.85e-01 | -0.2196 |
| 9223 | MAGI1 | HTA11_7862_2000001011 | Human | Colorectum | AD | 5.68e-04 | -4.77e-01 | -0.0179 |
| 9223 | MAGI1 | HTA11_866_3004761011 | Human | Colorectum | AD | 1.86e-04 | -4.69e-01 | 0.096 |
| 9223 | MAGI1 | HTA11_9408_2000001011 | Human | Colorectum | AD | 2.03e-06 | -6.37e-01 | 0.0451 |
| 9223 | MAGI1 | HTA11_7696_3000711011 | Human | Colorectum | AD | 1.39e-02 | -2.88e-01 | 0.0674 |
| 9223 | MAGI1 | HTA11_7469_2000001011 | Human | Colorectum | AD | 2.38e-03 | -7.20e-01 | -0.0124 |
| 9223 | MAGI1 | HTA11_99999970781_79442 | Human | Colorectum | MSS | 3.64e-12 | -4.49e-01 | 0.294 |
| 9223 | MAGI1 | HTA11_99999965062_69753 | Human | Colorectum | MSI-H | 5.65e-18 | 1.05e+00 | 0.3487 |
| 9223 | MAGI1 | HTA11_99999965104_69814 | Human | Colorectum | MSS | 1.53e-04 | 4.71e-01 | 0.281 |
| 9223 | MAGI1 | HTA11_99999971662_82457 | Human | Colorectum | MSS | 6.37e-05 | -7.98e-02 | 0.3859 |
| 9223 | MAGI1 | HTA11_99999973899_84307 | Human | Colorectum | MSS | 1.48e-14 | -8.20e-01 | 0.2585 |
| 9223 | MAGI1 | HTA11_99999974143_84620 | Human | Colorectum | MSS | 6.85e-34 | -7.99e-01 | 0.3005 |
| 9223 | MAGI1 | A015-C-203 | Human | Colorectum | FAP | 5.62e-31 | -5.25e-01 | -0.1294 |
| 9223 | MAGI1 | A014-C-040 | Human | Colorectum | FAP | 2.50e-02 | -3.18e-01 | -0.1184 |
| Page: 1 2 3 4 5 6 7 8 9 10 |
| Tissue | Expression Dynamics | Abbreviation |
| Cervix | 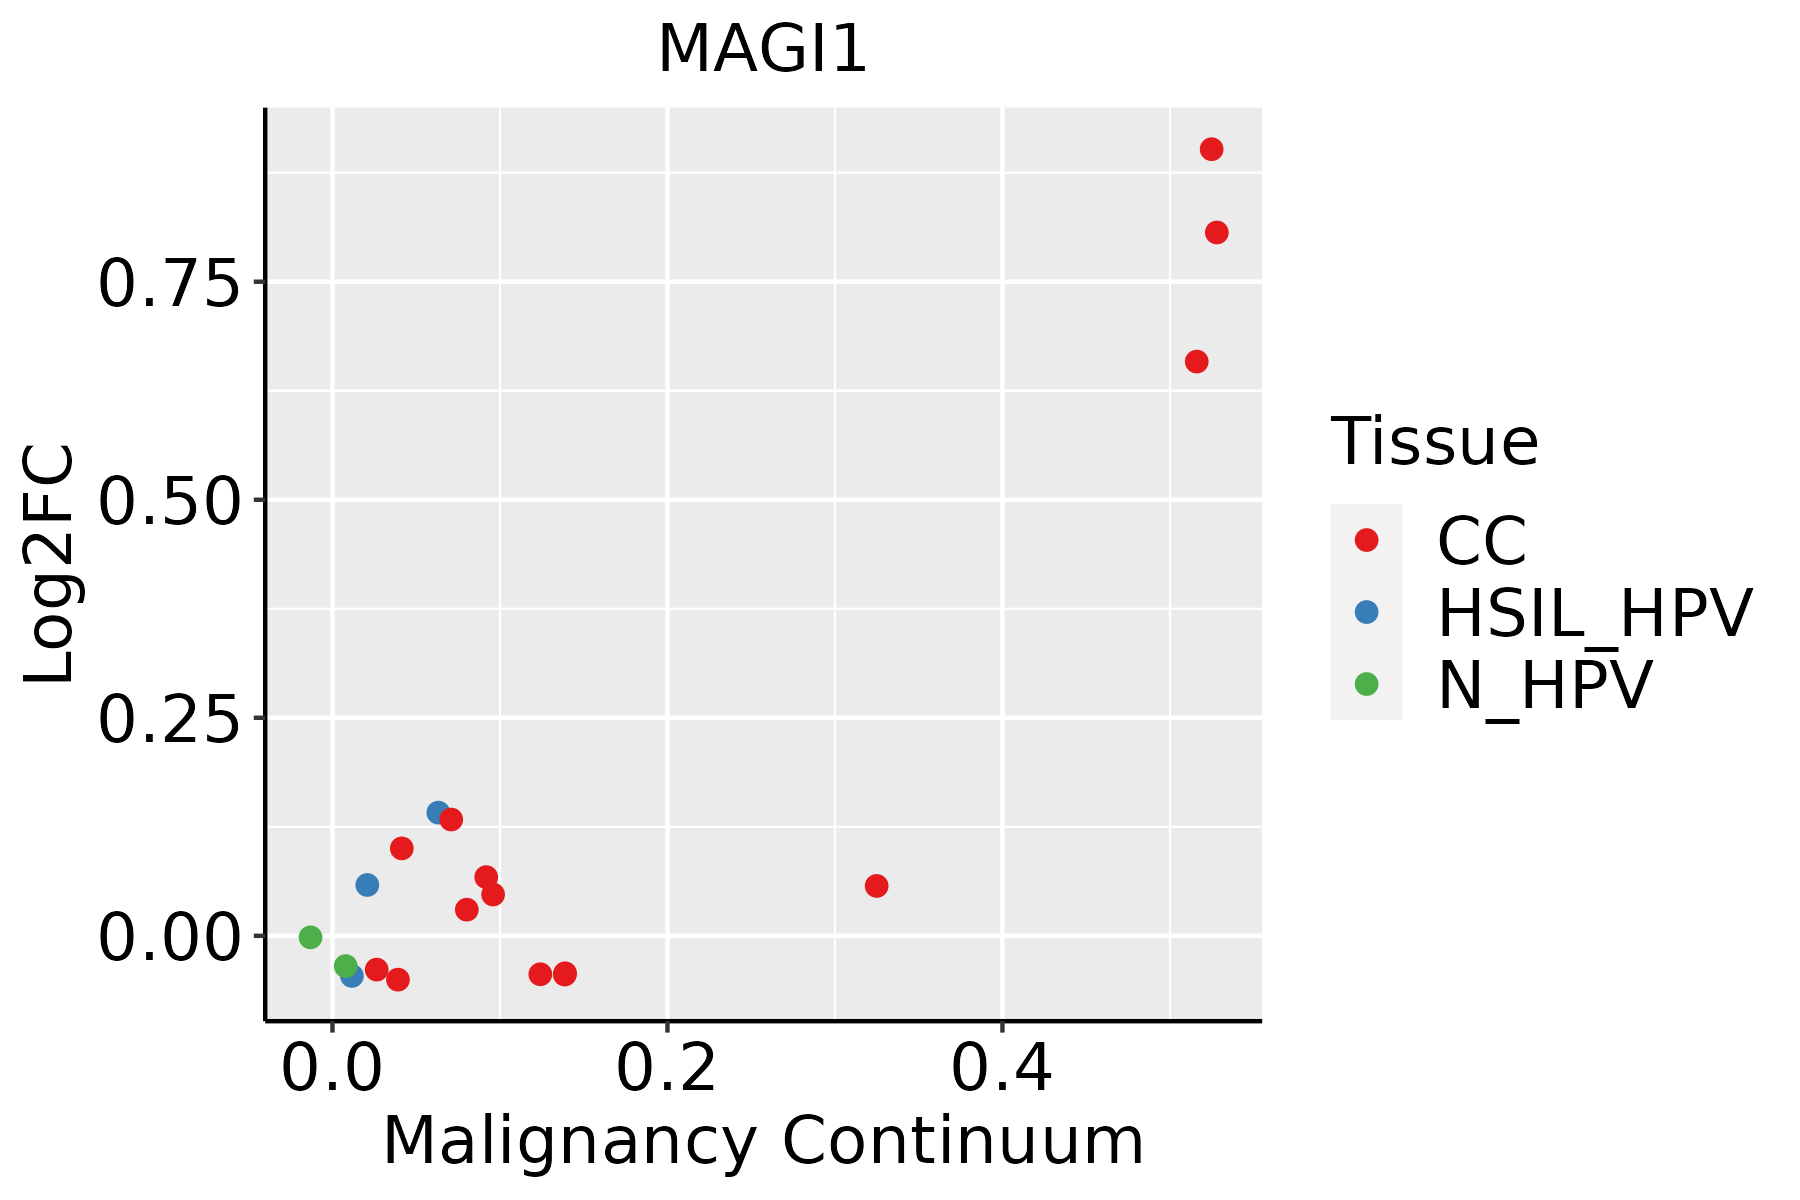 | CC: Cervix cancer |
| HSIL_HPV: HPV-infected high-grade squamous intraepithelial lesions | ||
| N_HPV: HPV-infected normal cervix | ||
| Colorectum (GSE201348) |  | FAP: Familial adenomatous polyposis |
| CRC: Colorectal cancer | ||
| Colorectum (HTA11) |  | AD: Adenomas |
| SER: Sessile serrated lesions | ||
| MSI-H: Microsatellite-high colorectal cancer | ||
| MSS: Microsatellite stable colorectal cancer | ||
| Endometrium | 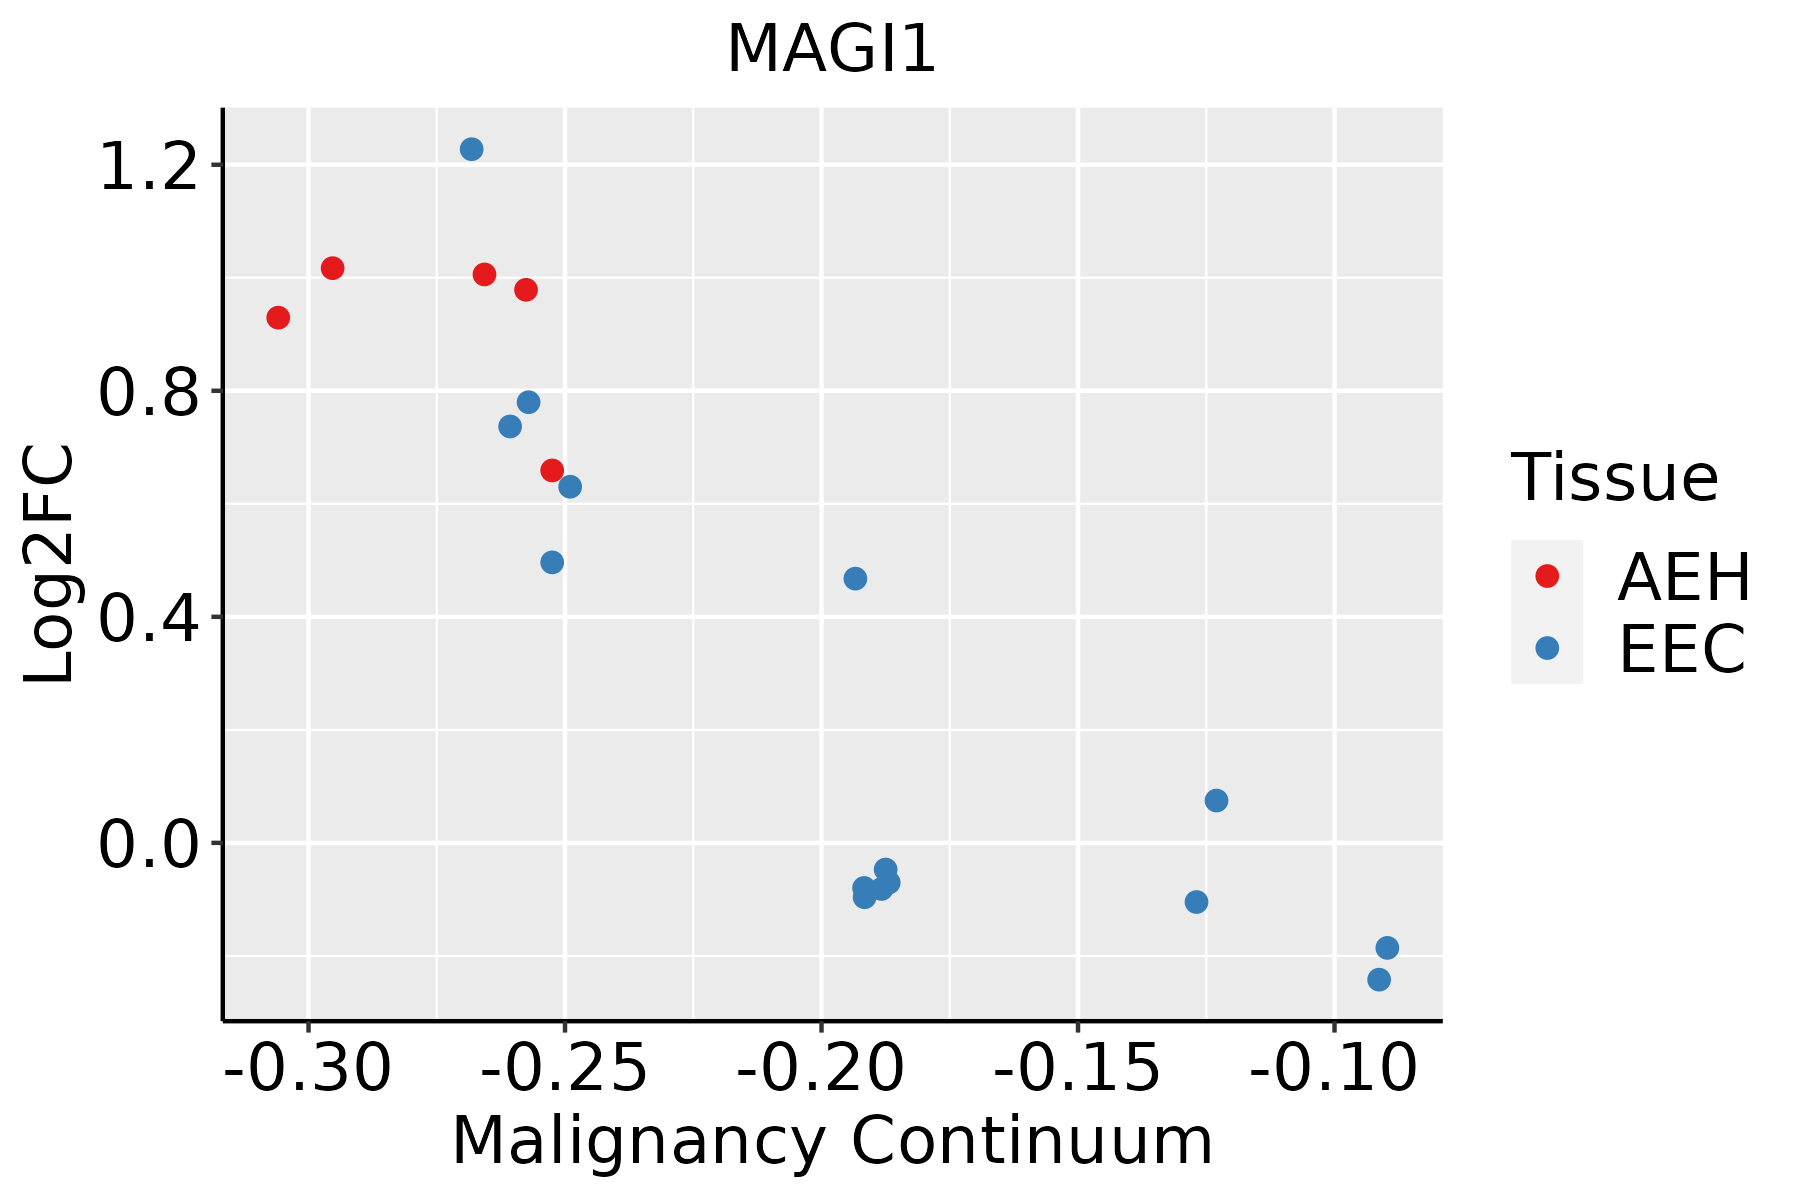 | AEH: Atypical endometrial hyperplasia |
| EEC: Endometrioid Cancer | ||
| GC |  | CAG: Chronic atrophic gastritis |
| CAG with IM: Chronic atrophic gastritis with intestinal metaplasia | ||
| CSG: Chronic superficial gastritis | ||
| GC: Gastric cancer | ||
| SIM: Severe intestinal metaplasia | ||
| WIM: Wild intestinal metaplasia | ||
| Liver | 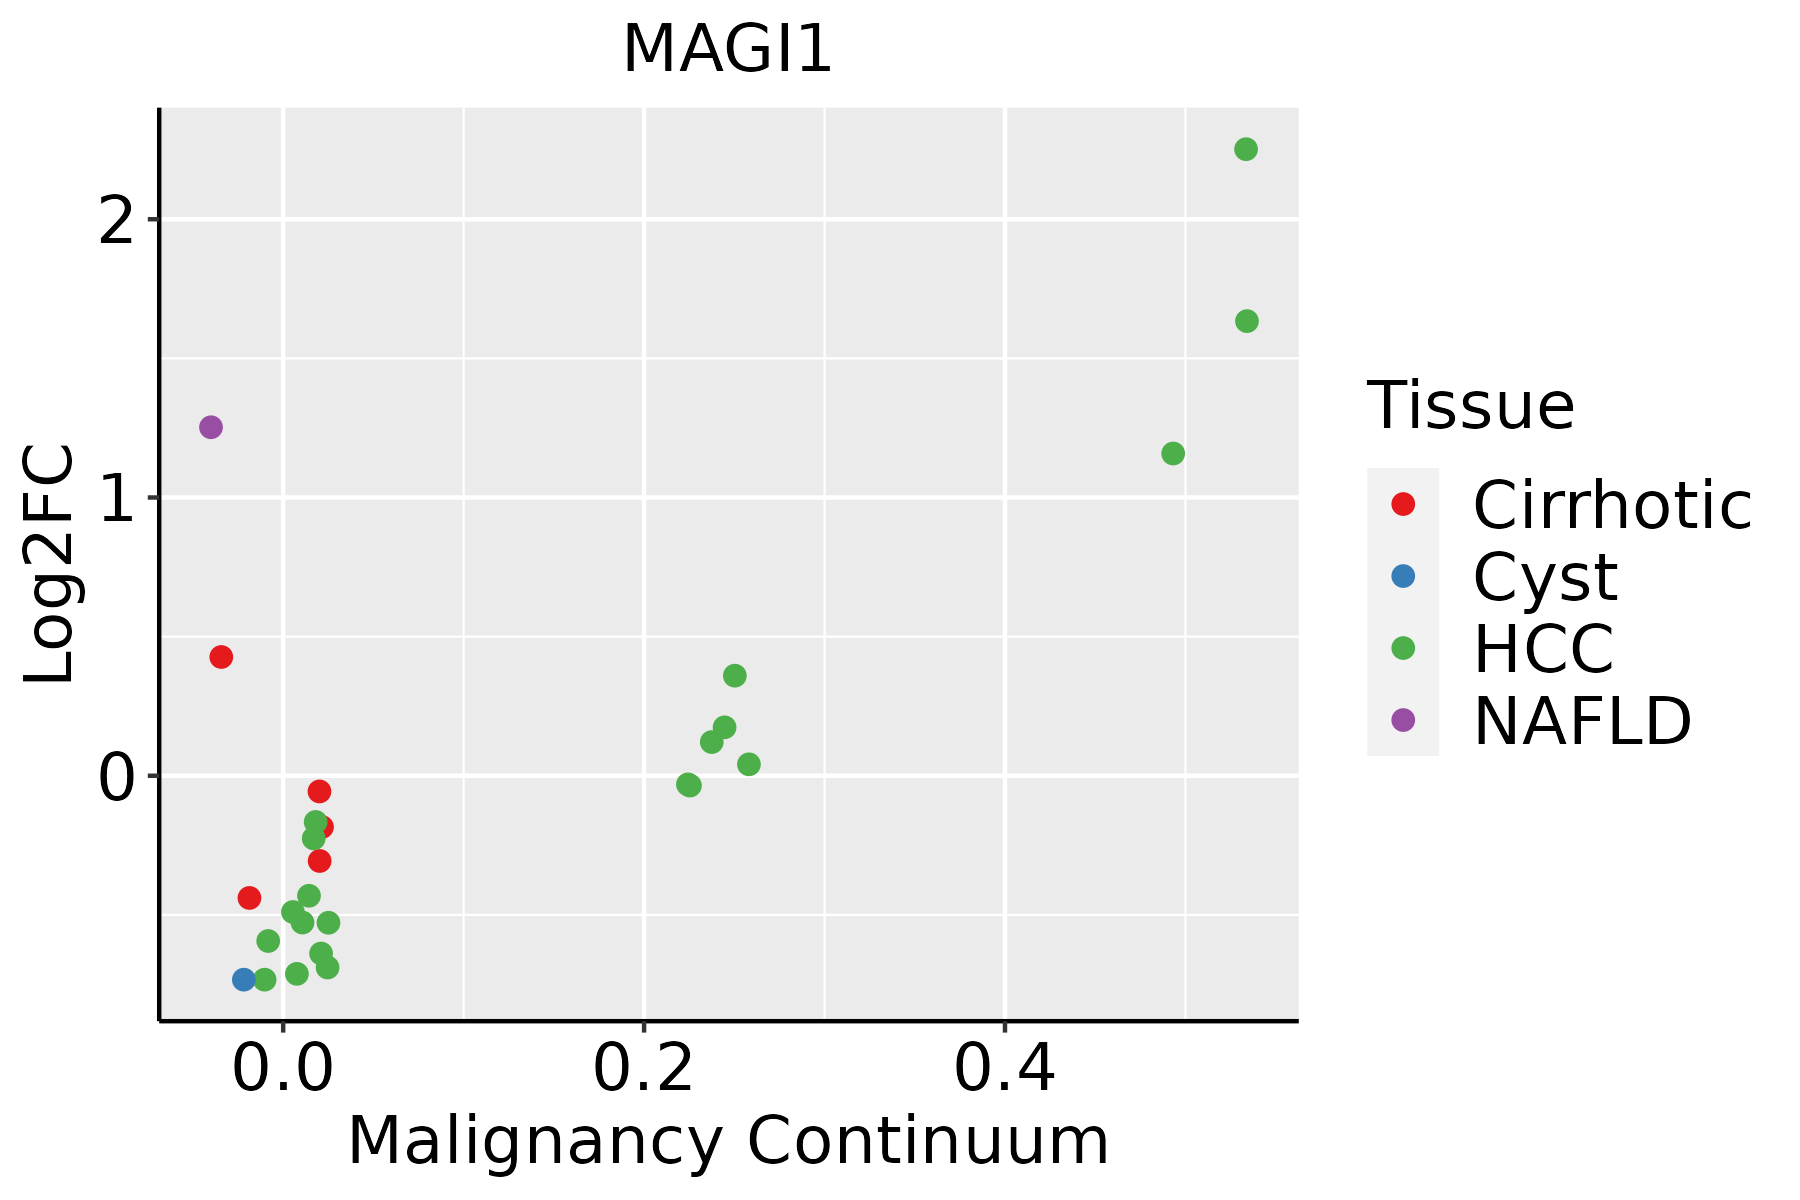 | HCC: Hepatocellular carcinoma |
| NAFLD: Non-alcoholic fatty liver disease | ||
| Lung | 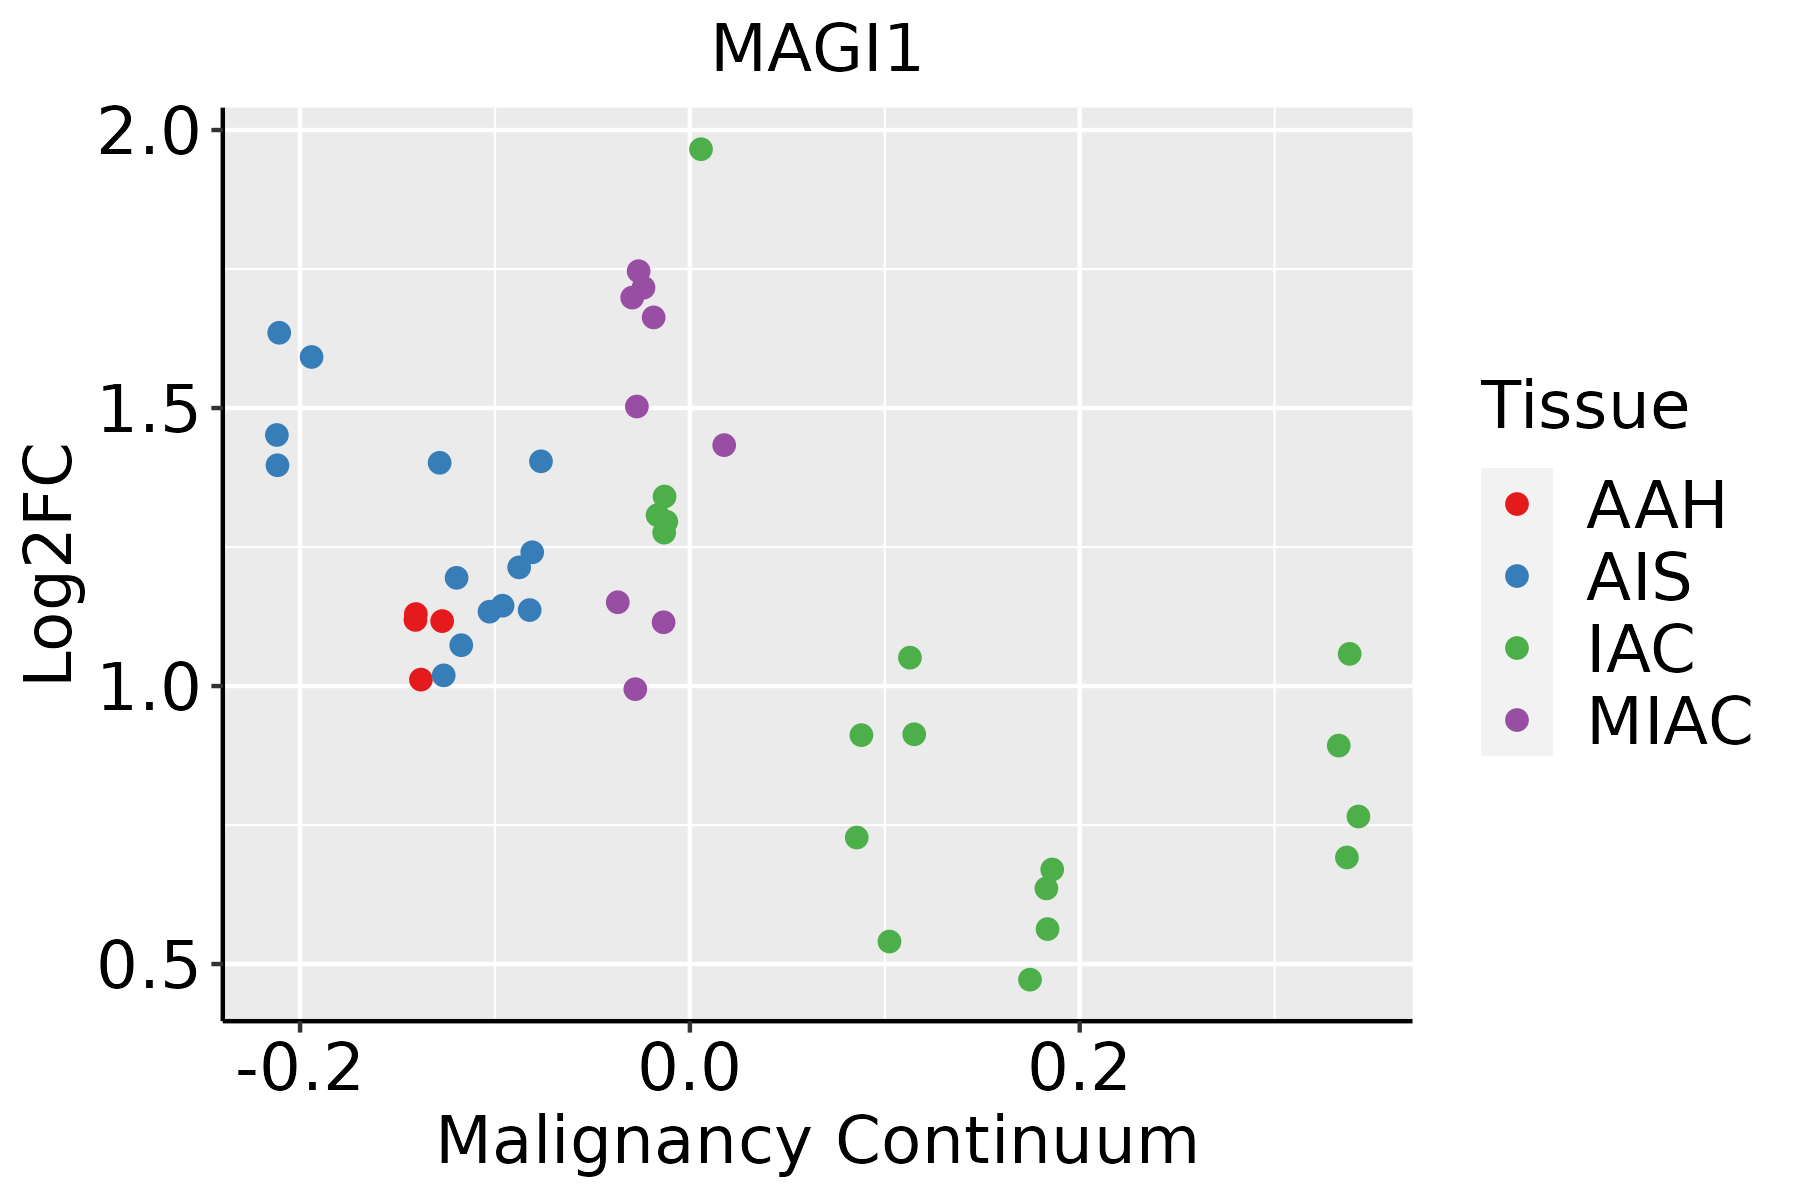 | AAH: Atypical adenomatous hyperplasia |
| AIS: Adenocarcinoma in situ | ||
| IAC: Invasive lung adenocarcinoma | ||
| MIA: Minimally invasive adenocarcinoma | ||
| Prostate |  | BPH: Benign Prostatic Hyperplasia |
| Skin | 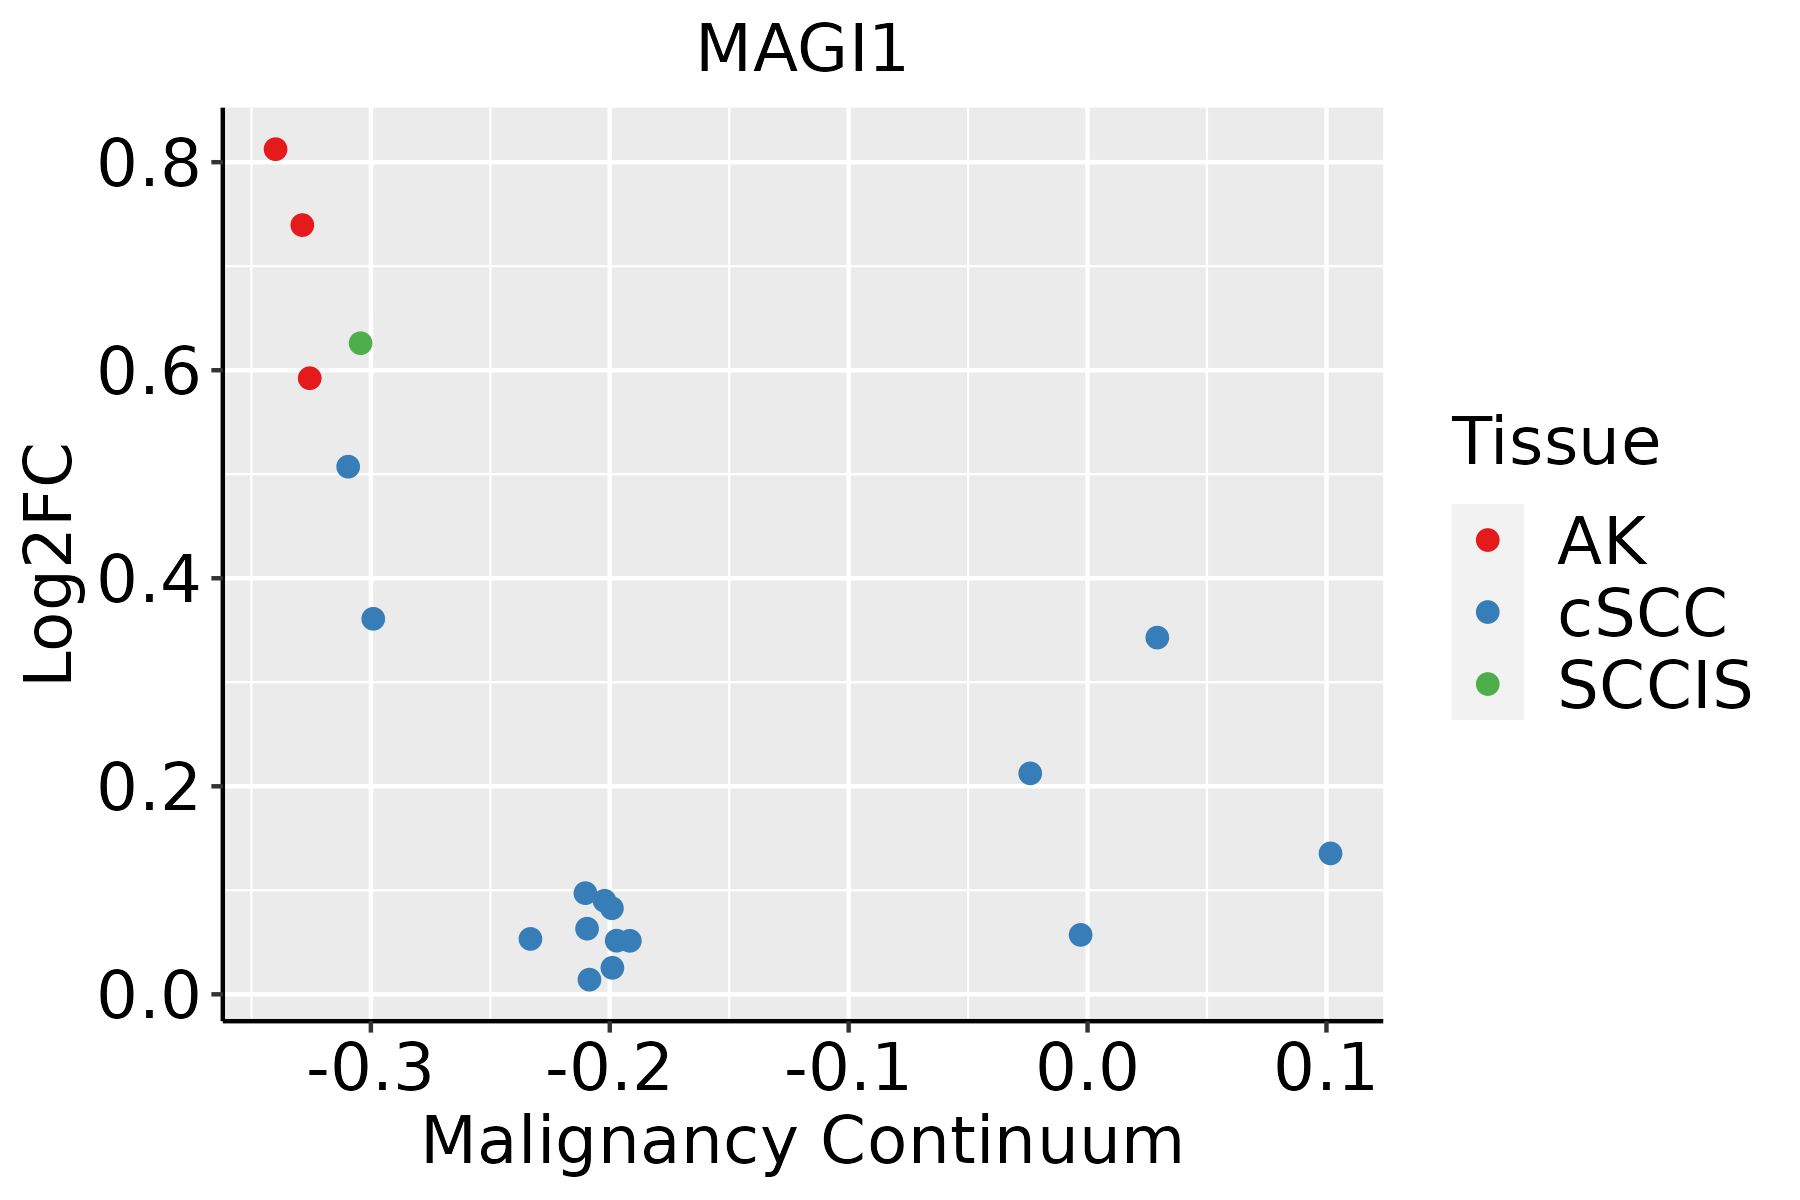 | AK: Actinic keratosis |
| cSCC: Cutaneous squamous cell carcinoma | ||
| SCCIS:squamous cell carcinoma in situ | ||
| Thyroid | 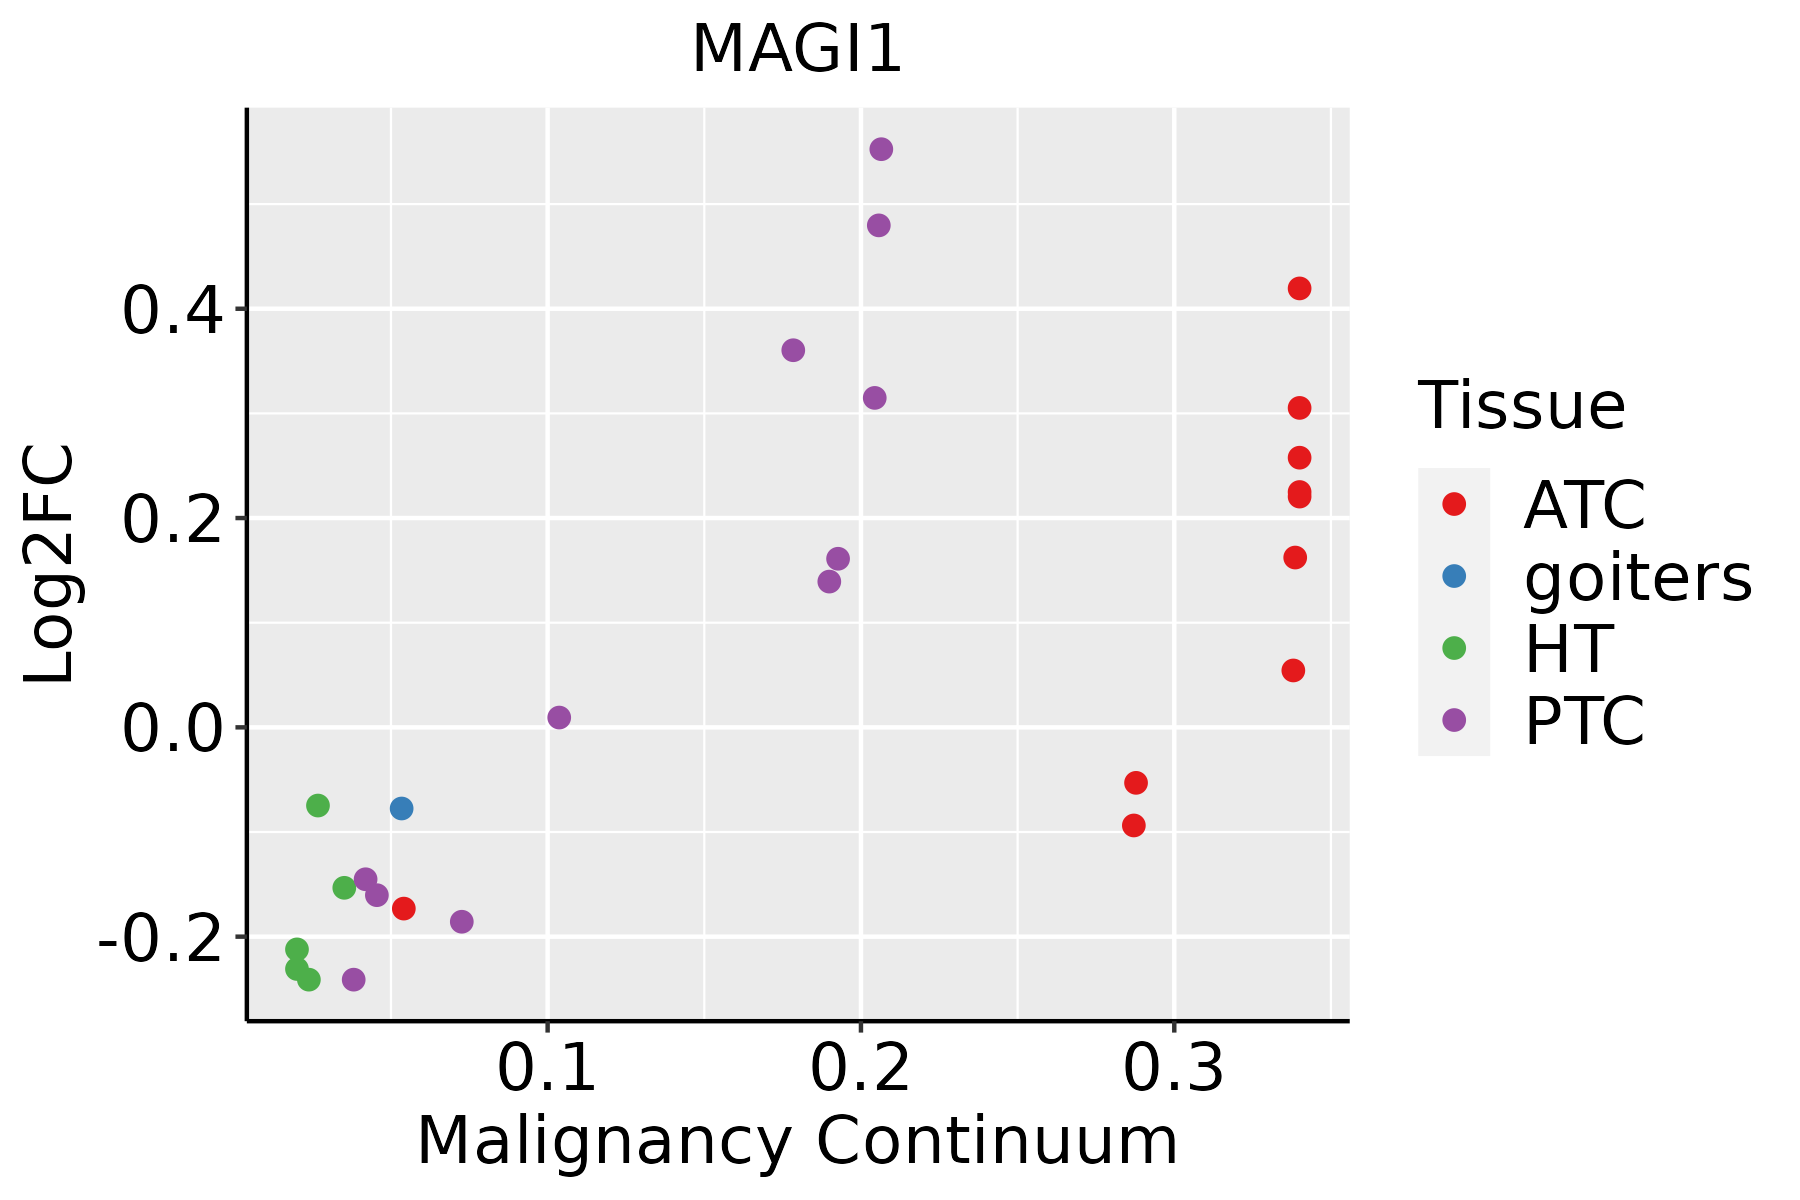 | ATC: Anaplastic thyroid cancer |
| HT: Hashimoto's thyroiditis | ||
| PTC: Papillary thyroid cancer |
| ∗log2FC in expression of this searched gene in stem-like cells from each diseased tissue sample relative to stem-like cells in normal samples in each tissue plotted against the malignancy continuum. Samples are colored based on if they are from different disease stage. |
Top |
Malignant transformation related pathway analysis |
| Find out the enriched GO biological processes and KEGG pathways involved in transition from healthy to precancer to cancer |
| Tissue | Disease Stage | Enriched GO biological Processes |
| Colorectum | AD |  |
| Colorectum | SER |  |
| Colorectum | MSS |  |
| Colorectum | MSI-H |  |
| Colorectum | FAP |  |
| ∗Top 15 enriched GO BP terms are showed in the bar plot of each disease state in each tissue. Each row represents a significant GO biological process which is colored according to the -log10(p.adjust). |
| Page: 1 2 3 4 5 6 7 8 9 |
| GO ID | Tissue | Disease Stage | Description | Gene Ratio | Bg Ratio | pvalue | p.adjust | Count |
| GO:002240710 | Cervix | CC | regulation of cell-cell adhesion | 103/2311 | 448/18723 | 1.78e-10 | 2.87e-08 | 103 |
| GO:004578510 | Cervix | CC | positive regulation of cell adhesion | 101/2311 | 437/18723 | 1.96e-10 | 3.08e-08 | 101 |
| GO:00224099 | Cervix | CC | positive regulation of cell-cell adhesion | 61/2311 | 284/18723 | 9.30e-06 | 2.11e-04 | 61 |
| GO:0045785 | Colorectum | AD | positive regulation of cell adhesion | 122/3918 | 437/18723 | 2.65e-04 | 3.28e-03 | 122 |
| GO:00457851 | Colorectum | SER | positive regulation of cell adhesion | 93/2897 | 437/18723 | 6.78e-04 | 9.04e-03 | 93 |
| GO:00457852 | Colorectum | MSS | positive regulation of cell adhesion | 110/3467 | 437/18723 | 2.94e-04 | 3.87e-03 | 110 |
| GO:00457853 | Colorectum | MSI-H | positive regulation of cell adhesion | 48/1319 | 437/18723 | 1.47e-03 | 2.23e-02 | 48 |
| GO:00457854 | Colorectum | FAP | positive regulation of cell adhesion | 92/2622 | 437/18723 | 3.09e-05 | 7.04e-04 | 92 |
| GO:00457855 | Colorectum | CRC | positive regulation of cell adhesion | 81/2078 | 437/18723 | 2.28e-06 | 1.10e-04 | 81 |
| GO:0022407 | Colorectum | CRC | regulation of cell-cell adhesion | 67/2078 | 448/18723 | 6.86e-03 | 4.81e-02 | 67 |
| GO:004578516 | Endometrium | AEH | positive regulation of cell adhesion | 96/2100 | 437/18723 | 5.50e-11 | 7.18e-09 | 96 |
| GO:002240714 | Endometrium | AEH | regulation of cell-cell adhesion | 79/2100 | 448/18723 | 2.90e-05 | 5.40e-04 | 79 |
| GO:002240910 | Endometrium | AEH | positive regulation of cell-cell adhesion | 54/2100 | 284/18723 | 6.94e-05 | 1.07e-03 | 54 |
| GO:004578517 | Endometrium | EEC | positive regulation of cell adhesion | 98/2168 | 437/18723 | 6.15e-11 | 8.38e-09 | 98 |
| GO:002240715 | Endometrium | EEC | regulation of cell-cell adhesion | 84/2168 | 448/18723 | 4.98e-06 | 1.24e-04 | 84 |
| GO:002240914 | Endometrium | EEC | positive regulation of cell-cell adhesion | 56/2168 | 284/18723 | 4.36e-05 | 7.15e-04 | 56 |
| GO:00457857 | Liver | Cirrhotic | positive regulation of cell adhesion | 141/4634 | 437/18723 | 2.05e-04 | 1.89e-03 | 141 |
| GO:004578512 | Liver | HCC | positive regulation of cell adhesion | 215/7958 | 437/18723 | 2.53e-03 | 1.22e-02 | 215 |
| GO:00224096 | Liver | Cyst | positive regulation of cell-cell adhesion | 19/496 | 284/18723 | 2.19e-04 | 8.05e-03 | 19 |
| GO:004578522 | Liver | Cyst | positive regulation of cell adhesion | 25/496 | 437/18723 | 2.79e-04 | 9.40e-03 | 25 |
| Page: 1 2 3 |
| Pathway ID | Tissue | Disease Stage | Description | Gene Ratio | Bg Ratio | pvalue | p.adjust | qvalue | Count |
| hsa0453020 | Cervix | CC | Tight junction | 49/1267 | 169/8465 | 1.87e-06 | 1.78e-05 | 1.05e-05 | 49 |
| hsa0401512 | Cervix | CC | Rap1 signaling pathway | 56/1267 | 210/8465 | 6.23e-06 | 5.61e-05 | 3.32e-05 | 56 |
| hsa051657 | Cervix | CC | Human papillomavirus infection | 74/1267 | 331/8465 | 1.70e-04 | 1.02e-03 | 6.03e-04 | 74 |
| hsa04530110 | Cervix | CC | Tight junction | 49/1267 | 169/8465 | 1.87e-06 | 1.78e-05 | 1.05e-05 | 49 |
| hsa0401513 | Cervix | CC | Rap1 signaling pathway | 56/1267 | 210/8465 | 6.23e-06 | 5.61e-05 | 3.32e-05 | 56 |
| hsa0516512 | Cervix | CC | Human papillomavirus infection | 74/1267 | 331/8465 | 1.70e-04 | 1.02e-03 | 6.03e-04 | 74 |
| hsa04530 | Colorectum | AD | Tight junction | 76/2092 | 169/8465 | 5.49e-09 | 9.69e-08 | 6.18e-08 | 76 |
| hsa04015 | Colorectum | AD | Rap1 signaling pathway | 71/2092 | 210/8465 | 1.72e-03 | 9.68e-03 | 6.18e-03 | 71 |
| hsa045301 | Colorectum | AD | Tight junction | 76/2092 | 169/8465 | 5.49e-09 | 9.69e-08 | 6.18e-08 | 76 |
| hsa040151 | Colorectum | AD | Rap1 signaling pathway | 71/2092 | 210/8465 | 1.72e-03 | 9.68e-03 | 6.18e-03 | 71 |
| hsa045302 | Colorectum | SER | Tight junction | 59/1580 | 169/8465 | 3.24e-07 | 5.98e-06 | 4.34e-06 | 59 |
| hsa040152 | Colorectum | SER | Rap1 signaling pathway | 54/1580 | 210/8465 | 6.55e-03 | 3.68e-02 | 2.67e-02 | 54 |
| hsa045303 | Colorectum | SER | Tight junction | 59/1580 | 169/8465 | 3.24e-07 | 5.98e-06 | 4.34e-06 | 59 |
| hsa040153 | Colorectum | SER | Rap1 signaling pathway | 54/1580 | 210/8465 | 6.55e-03 | 3.68e-02 | 2.67e-02 | 54 |
| hsa045304 | Colorectum | MSS | Tight junction | 66/1875 | 169/8465 | 4.10e-07 | 6.25e-06 | 3.83e-06 | 66 |
| hsa040154 | Colorectum | MSS | Rap1 signaling pathway | 66/1875 | 210/8465 | 1.03e-03 | 5.94e-03 | 3.64e-03 | 66 |
| hsa045305 | Colorectum | MSS | Tight junction | 66/1875 | 169/8465 | 4.10e-07 | 6.25e-06 | 3.83e-06 | 66 |
| hsa040155 | Colorectum | MSS | Rap1 signaling pathway | 66/1875 | 210/8465 | 1.03e-03 | 5.94e-03 | 3.64e-03 | 66 |
| hsa045306 | Colorectum | MSI-H | Tight junction | 31/797 | 169/8465 | 2.08e-04 | 2.80e-03 | 2.35e-03 | 31 |
| hsa045307 | Colorectum | MSI-H | Tight junction | 31/797 | 169/8465 | 2.08e-04 | 2.80e-03 | 2.35e-03 | 31 |
| Page: 1 2 3 4 5 |
Top |
Cell-cell communication analysis |
| Identification of potential cell-cell interactions between two cell types and their ligand-receptor pairs for different disease states |
| Ligand | Receptor | LRpair | Pathway | Tissue | Disease Stage |
| Page: 1 |
Top |
Single-cell gene regulatory network inference analysis |
| Find out the significant the regulons (TFs) and the target genes of each regulon across cell types for different disease states |
| TF | Cell Type | Tissue | Disease Stage | Target Gene | RSS | Regulon Activity |
| ∗The dot plots of a searched regulon are shown for all cell subpopulations in each disease state of each tissue based on the regulon specific score inferred using pySCENIC and by calculating the average expression. |
| Page: 1 |
Top |
Somatic mutation of malignant transformation related genes |
| Annotation of somatic variants for genes involved in malignant transformation |
| Hugo Symbol | Variant Class | Variant Classification | dbSNP RS | HGVSc | HGVSp | HGVSp Short | SWISSPROT | BIOTYPE | SIFT | PolyPhen | Tumor Sample Barcode | Tissue | Histology | Sex | Age | Stage | Therapy Types | Drugs | Outcome |
| MAGI1 | SNV | Missense_Mutation | novel | c.3286A>G | p.Thr1096Ala | p.T1096A | Q96QZ7 | protein_coding | tolerated(0.93) | benign(0.007) | TCGA-A2-A3Y0-01 | Breast | breast invasive carcinoma | Female | <65 | I/II | Chemotherapy | adriamycin | CR |
| MAGI1 | SNV | Missense_Mutation | c.4253N>C | p.Arg1418Thr | p.R1418T | Q96QZ7 | protein_coding | tolerated_low_confidence(0.1) | possibly_damaging(0.6) | TCGA-AC-A23H-01 | Breast | breast invasive carcinoma | Female | >=65 | I/II | Unknown | Unknown | PD | |
| MAGI1 | SNV | Missense_Mutation | c.4125N>C | p.Glu1375Asp | p.E1375D | Q96QZ7 | protein_coding | tolerated_low_confidence(0.42) | benign(0.006) | TCGA-AC-A23H-01 | Breast | breast invasive carcinoma | Female | >=65 | I/II | Unknown | Unknown | PD | |
| MAGI1 | SNV | Missense_Mutation | novel | c.3031N>T | p.Arg1011Trp | p.R1011W | Q96QZ7 | protein_coding | deleterious(0) | probably_damaging(1) | TCGA-AN-A046-01 | Breast | breast invasive carcinoma | Female | >=65 | I/II | Unknown | Unknown | SD |
| MAGI1 | SNV | Missense_Mutation | novel | c.1717G>T | p.Val573Leu | p.V573L | Q96QZ7 | protein_coding | tolerated(0.41) | benign(0.081) | TCGA-AR-A1AY-01 | Breast | breast invasive carcinoma | Female | >=65 | I/II | Unspecific | Doxorubicin | SD |
| MAGI1 | SNV | Missense_Mutation | novel | c.2583N>G | p.Ile861Met | p.I861M | Q96QZ7 | protein_coding | tolerated(0.18) | probably_damaging(0.956) | TCGA-B6-A0RT-01 | Breast | breast invasive carcinoma | Female | <65 | III/IV | Unknown | Unknown | SD |
| MAGI1 | SNV | Missense_Mutation | novel | c.2848N>A | p.Gly950Ser | p.G950S | Q96QZ7 | protein_coding | tolerated(0.08) | benign(0.048) | TCGA-BH-A0B8-01 | Breast | breast invasive carcinoma | Female | <65 | I/II | Hormone Therapy | arimidex | SD |
| MAGI1 | SNV | Missense_Mutation | rs750943411 | c.1186N>T | p.Arg396Trp | p.R396W | Q96QZ7 | protein_coding | deleterious(0) | probably_damaging(0.959) | TCGA-BH-A0HF-01 | Breast | breast invasive carcinoma | Female | >=65 | I/II | Hormone Therapy | arimidex | SD |
| MAGI1 | SNV | Missense_Mutation | c.3962N>A | p.Arg1321Gln | p.R1321Q | Q96QZ7 | protein_coding | tolerated(0.1) | benign(0) | TCGA-C8-A130-01 | Breast | breast invasive carcinoma | Female | <65 | III/IV | Unknown | Unknown | SD | |
| MAGI1 | SNV | Missense_Mutation | rs765094156 | c.3032N>A | p.Arg1011Gln | p.R1011Q | Q96QZ7 | protein_coding | deleterious(0.03) | probably_damaging(0.998) | TCGA-C8-A1HG-01 | Breast | breast invasive carcinoma | Female | <65 | I/II | Unknown | Unknown | SD |
| Page: 1 2 3 4 5 6 7 8 9 10 11 12 13 14 15 16 17 18 19 |
Top |
Related drugs of malignant transformation related genes |
| Identification of chemicals and drugs interact with genes involved in malignant transfromation |
| (DGIdb 4.0) |
| Entrez ID | Symbol | Category | Interaction Types | Drug Claim Name | Drug Name | PMIDs |
| Page: 1 |

Copyright 2023-Present -The University of Texas Health Science Center at Houston |