
|
|||||
|
 | |
| |
| |
| |
| |
| |
|
Gene: MAGEH1 |
Gene summary for MAGEH1 |
| Gene information | Species | Human | Gene symbol | MAGEH1 | Gene ID | 28986 |
| Gene name | MAGE family member H1 | |
| Gene Alias | APR-1 | |
| Cytomap | Xp11.21 | |
| Gene Type | protein-coding | GO ID | GO:0000122 | UniProtAcc | Q9H213 |
Top |
Malignant transformation analysis |
| Identification of the aberrant gene expression in precancerous and cancerous lesions by comparing the gene expression of stem-like cells in diseased tissues with normal stem cells |
| Entrez ID | Symbol | Replicates | Species | Organ | Tissue | Adj P-value | Log2FC | Malignancy |
| 28986 | MAGEH1 | LZE24T | Human | Esophagus | ESCC | 8.93e-04 | 1.13e-01 | 0.0596 |
| 28986 | MAGEH1 | P2T-E | Human | Esophagus | ESCC | 5.95e-09 | 2.91e-01 | 0.1177 |
| 28986 | MAGEH1 | P4T-E | Human | Esophagus | ESCC | 9.54e-13 | 2.47e-01 | 0.1323 |
| 28986 | MAGEH1 | P8T-E | Human | Esophagus | ESCC | 3.99e-18 | 3.04e-01 | 0.0889 |
| 28986 | MAGEH1 | P9T-E | Human | Esophagus | ESCC | 4.78e-11 | 3.58e-01 | 0.1131 |
| 28986 | MAGEH1 | P10T-E | Human | Esophagus | ESCC | 8.55e-19 | 3.53e-01 | 0.116 |
| 28986 | MAGEH1 | P11T-E | Human | Esophagus | ESCC | 2.46e-13 | 8.11e-01 | 0.1426 |
| 28986 | MAGEH1 | P12T-E | Human | Esophagus | ESCC | 3.70e-23 | 4.81e-01 | 0.1122 |
| 28986 | MAGEH1 | P16T-E | Human | Esophagus | ESCC | 6.89e-17 | 3.46e-01 | 0.1153 |
| 28986 | MAGEH1 | P19T-E | Human | Esophagus | ESCC | 1.09e-03 | 3.90e-01 | 0.1662 |
| 28986 | MAGEH1 | P21T-E | Human | Esophagus | ESCC | 2.08e-02 | 7.70e-02 | 0.1617 |
| 28986 | MAGEH1 | P22T-E | Human | Esophagus | ESCC | 1.59e-26 | 4.92e-01 | 0.1236 |
| 28986 | MAGEH1 | P23T-E | Human | Esophagus | ESCC | 2.95e-07 | 3.25e-01 | 0.108 |
| 28986 | MAGEH1 | P26T-E | Human | Esophagus | ESCC | 4.65e-23 | 4.82e-01 | 0.1276 |
| 28986 | MAGEH1 | P28T-E | Human | Esophagus | ESCC | 5.97e-04 | 5.99e-02 | 0.1149 |
| 28986 | MAGEH1 | P30T-E | Human | Esophagus | ESCC | 1.32e-11 | 6.26e-01 | 0.137 |
| 28986 | MAGEH1 | P32T-E | Human | Esophagus | ESCC | 6.14e-25 | 5.59e-01 | 0.1666 |
| 28986 | MAGEH1 | P36T-E | Human | Esophagus | ESCC | 1.24e-02 | 9.43e-02 | 0.1187 |
| 28986 | MAGEH1 | P37T-E | Human | Esophagus | ESCC | 5.94e-03 | 5.87e-02 | 0.1371 |
| 28986 | MAGEH1 | P42T-E | Human | Esophagus | ESCC | 2.79e-03 | 1.98e-01 | 0.1175 |
| Page: 1 2 3 |
| Tissue | Expression Dynamics | Abbreviation |
| Esophagus | 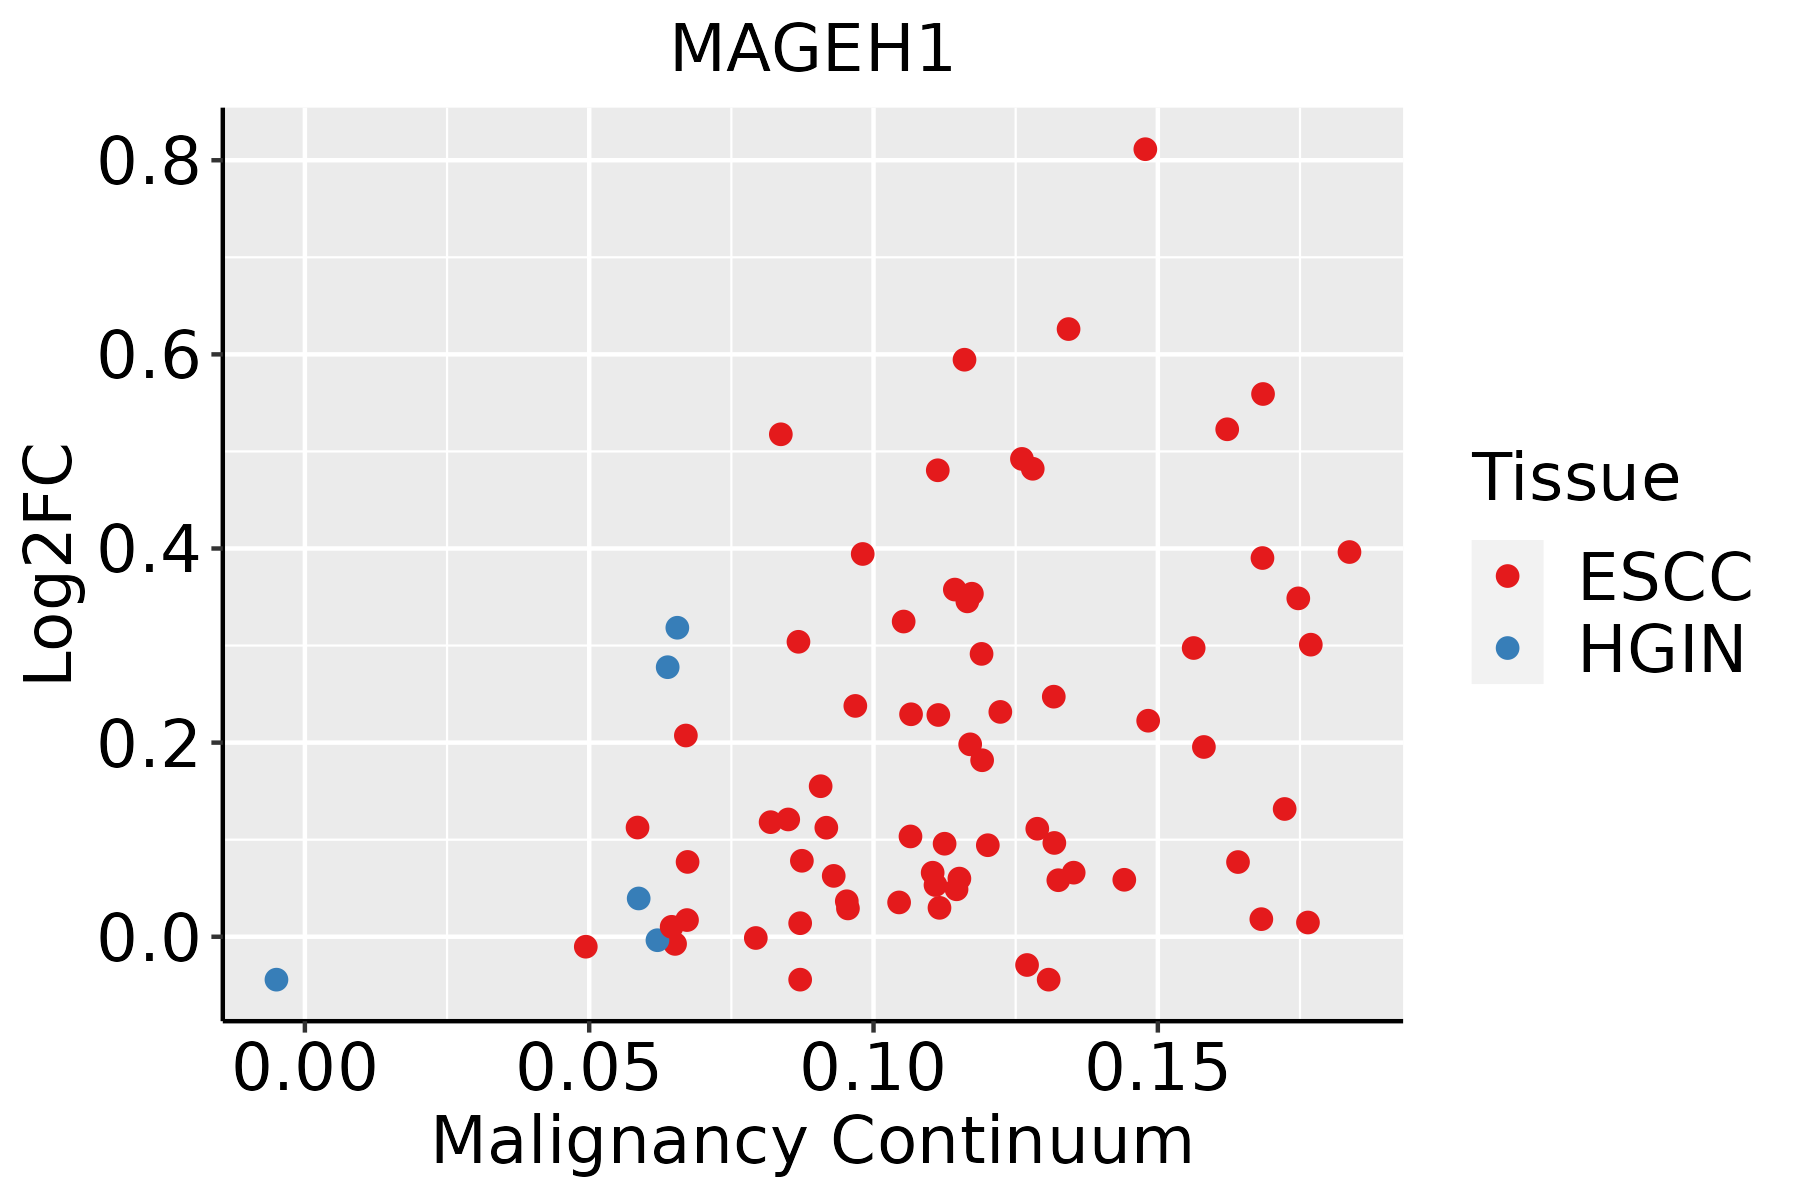 | ESCC: Esophageal squamous cell carcinoma |
| HGIN: High-grade intraepithelial neoplasias | ||
| LGIN: Low-grade intraepithelial neoplasias | ||
| Oral Cavity | 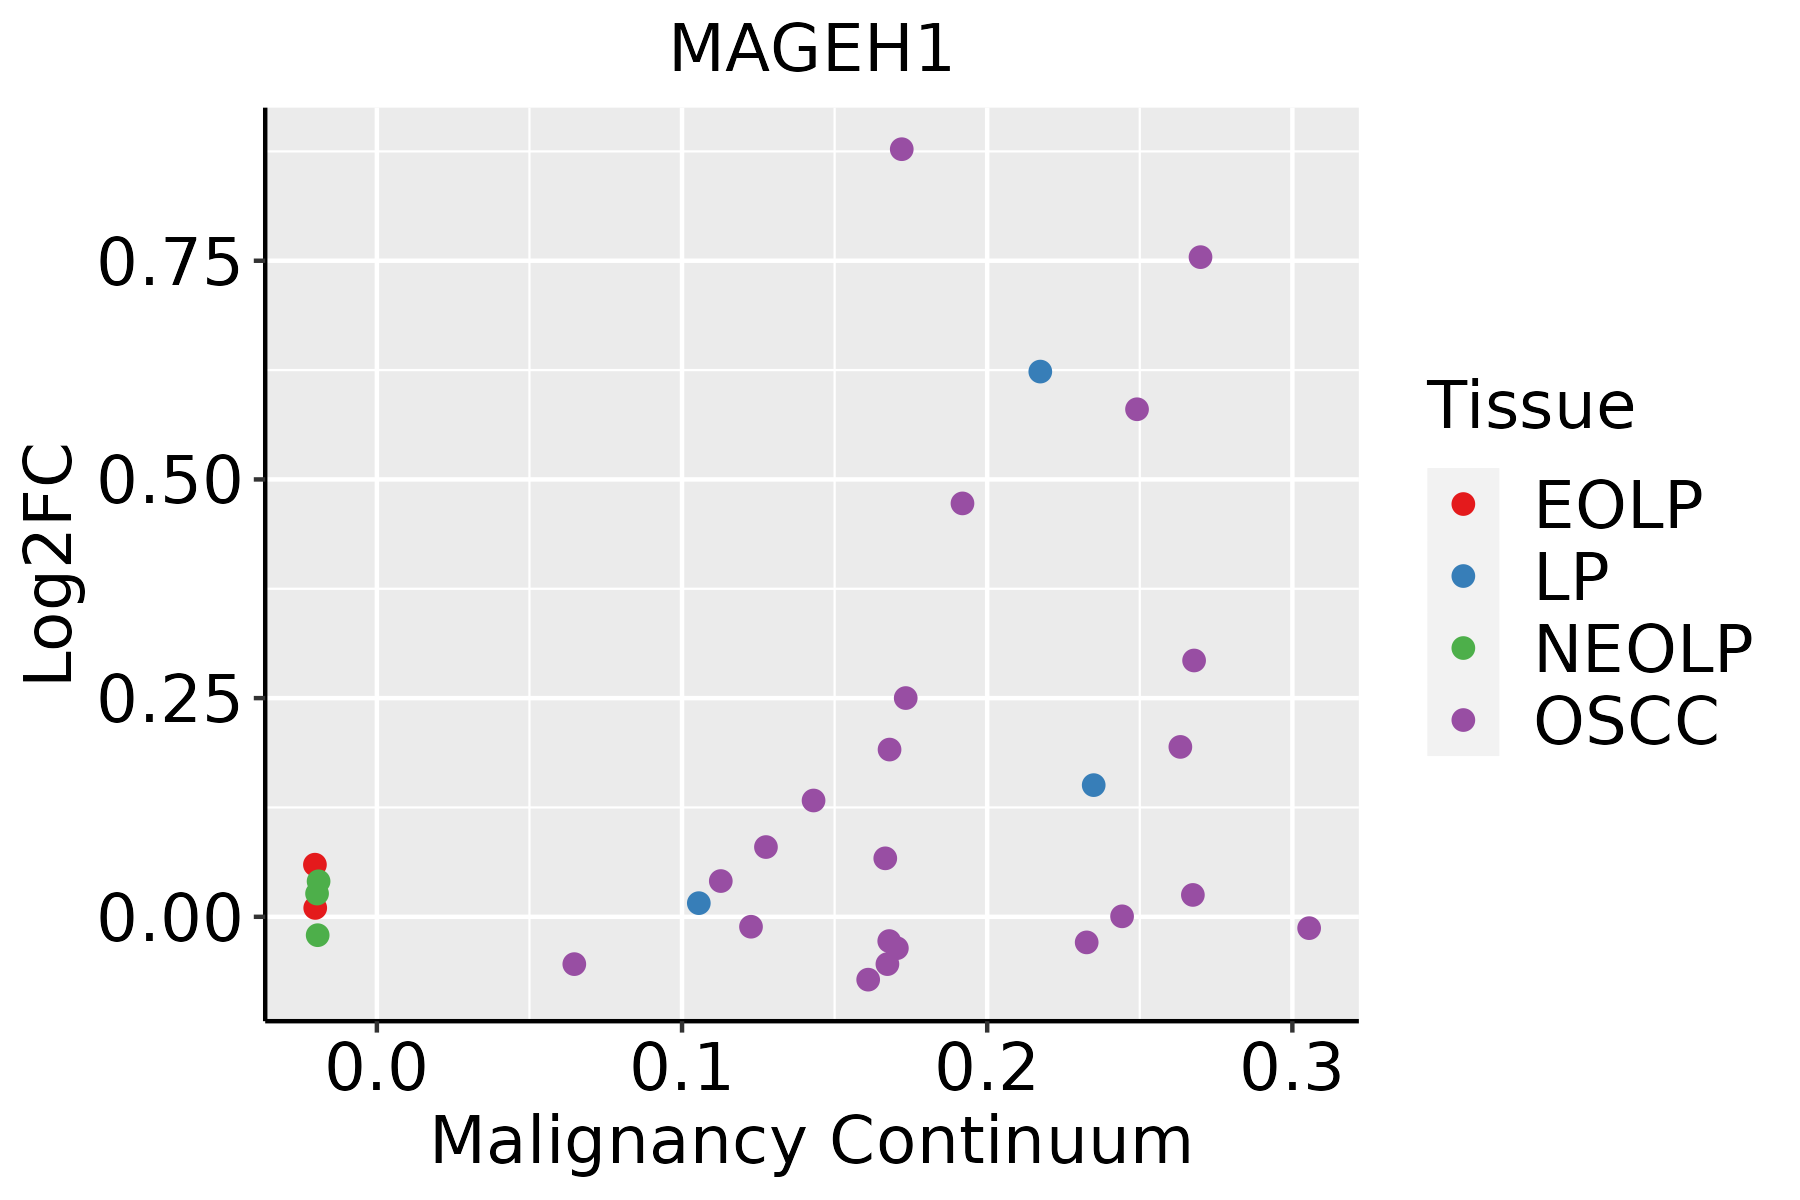 | EOLP: Erosive Oral lichen planus |
| LP: leukoplakia | ||
| NEOLP: Non-erosive oral lichen planus | ||
| OSCC: Oral squamous cell carcinoma | ||
| Thyroid |  | ATC: Anaplastic thyroid cancer |
| HT: Hashimoto's thyroiditis | ||
| PTC: Papillary thyroid cancer |
| ∗log2FC in expression of this searched gene in stem-like cells from each diseased tissue sample relative to stem-like cells in normal samples in each tissue plotted against the malignancy continuum. Samples are colored based on if they are from different disease stage. |
Top |
Malignant transformation related pathway analysis |
| Find out the enriched GO biological processes and KEGG pathways involved in transition from healthy to precancer to cancer |
| Tissue | Disease Stage | Enriched GO biological Processes |
| Colorectum | AD |  |
| Colorectum | SER |  |
| Colorectum | MSS |  |
| Colorectum | MSI-H |  |
| Colorectum | FAP |  |
| ∗Top 15 enriched GO BP terms are showed in the bar plot of each disease state in each tissue. Each row represents a significant GO biological process which is colored according to the -log10(p.adjust). |
| Page: 1 2 3 4 5 6 7 8 9 |
| GO ID | Tissue | Disease Stage | Description | Gene Ratio | Bg Ratio | pvalue | p.adjust | Count |
| Page: 1 |
| Pathway ID | Tissue | Disease Stage | Description | Gene Ratio | Bg Ratio | pvalue | p.adjust | qvalue | Count |
| Page: 1 |
Top |
Cell-cell communication analysis |
| Identification of potential cell-cell interactions between two cell types and their ligand-receptor pairs for different disease states |
| Ligand | Receptor | LRpair | Pathway | Tissue | Disease Stage |
| Page: 1 |
Top |
Single-cell gene regulatory network inference analysis |
| Find out the significant the regulons (TFs) and the target genes of each regulon across cell types for different disease states |
| TF | Cell Type | Tissue | Disease Stage | Target Gene | RSS | Regulon Activity |
| ∗The dot plots of a searched regulon are shown for all cell subpopulations in each disease state of each tissue based on the regulon specific score inferred using pySCENIC and by calculating the average expression. |
| Page: 1 |
Top |
Somatic mutation of malignant transformation related genes |
| Annotation of somatic variants for genes involved in malignant transformation |
| Hugo Symbol | Variant Class | Variant Classification | dbSNP RS | HGVSc | HGVSp | HGVSp Short | SWISSPROT | BIOTYPE | SIFT | PolyPhen | Tumor Sample Barcode | Tissue | Histology | Sex | Age | Stage | Therapy Types | Drugs | Outcome |
| MAGEH1 | SNV | Missense_Mutation | novel | c.646N>C | p.Tyr216His | p.Y216H | Q9H213 | protein_coding | tolerated_low_confidence(0.26) | benign(0.013) | TCGA-AC-A6NO-01 | Breast | breast invasive carcinoma | Female | <65 | I/II | Unknown | Unknown | SD |
| MAGEH1 | SNV | Missense_Mutation | c.101N>A | p.Pro34His | p.P34H | Q9H213 | protein_coding | deleterious_low_confidence(0.03) | benign(0.18) | TCGA-BH-A0DG-01 | Breast | breast invasive carcinoma | Female | <65 | I/II | Chemotherapy | taxotere | CR | |
| MAGEH1 | SNV | Missense_Mutation | novel | c.188N>A | p.Thr63Asn | p.T63N | Q9H213 | protein_coding | deleterious_low_confidence(0) | benign(0.015) | TCGA-E2-A56Z-01 | Breast | breast invasive carcinoma | Female | >=65 | I/II | Hormone Therapy | arimidex | SD |
| MAGEH1 | SNV | Missense_Mutation | rs147576211 | c.512C>T | p.Ser171Leu | p.S171L | Q9H213 | protein_coding | deleterious_low_confidence(0) | possibly_damaging(0.466) | TCGA-C5-A8YQ-01 | Cervix | cervical & endocervical cancer | Female | >=65 | I/II | Chemotherapy | cisplatin | PD |
| MAGEH1 | SNV | Missense_Mutation | c.478N>C | p.Glu160Gln | p.E160Q | Q9H213 | protein_coding | deleterious_low_confidence(0.04) | possibly_damaging(0.842) | TCGA-DS-A0VM-01 | Cervix | cervical & endocervical cancer | Female | <65 | I/II | Chemotherapy | cisplatin | PD | |
| MAGEH1 | SNV | Missense_Mutation | novel | c.604N>A | p.Asp202Asn | p.D202N | Q9H213 | protein_coding | deleterious_low_confidence(0) | possibly_damaging(0.573) | TCGA-AA-3947-01 | Colorectum | colon adenocarcinoma | Female | <65 | I/II | Unknown | Unknown | SD |
| MAGEH1 | SNV | Missense_Mutation | c.241N>T | p.Arg81Trp | p.R81W | Q9H213 | protein_coding | deleterious_low_confidence(0) | probably_damaging(0.979) | TCGA-AD-6888-01 | Colorectum | colon adenocarcinoma | Male | >=65 | III/IV | Unknown | Unknown | PD | |
| MAGEH1 | SNV | Missense_Mutation | c.483C>A | p.Phe161Leu | p.F161L | Q9H213 | protein_coding | deleterious_low_confidence(0.03) | probably_damaging(0.928) | TCGA-AZ-4315-01 | Colorectum | colon adenocarcinoma | Male | <65 | I/II | Unknown | Unknown | SD | |
| MAGEH1 | SNV | Missense_Mutation | c.122N>T | p.Ala41Val | p.A41V | Q9H213 | protein_coding | deleterious_low_confidence(0) | benign(0.001) | TCGA-G4-6309-01 | Colorectum | colon adenocarcinoma | Female | <65 | III/IV | Chemotherapy | xeloda | PD | |
| MAGEH1 | SNV | Missense_Mutation | c.551G>A | p.Arg184His | p.R184H | Q9H213 | protein_coding | tolerated_low_confidence(0.51) | benign(0.038) | TCGA-AG-A023-01 | Colorectum | rectum adenocarcinoma | Female | <65 | III/IV | Unknown | Unknown | PD |
| Page: 1 2 3 4 5 |
Top |
Related drugs of malignant transformation related genes |
| Identification of chemicals and drugs interact with genes involved in malignant transfromation |
| (DGIdb 4.0) |
| Entrez ID | Symbol | Category | Interaction Types | Drug Claim Name | Drug Name | PMIDs |
| Page: 1 |

Copyright 2023-Present -The University of Texas Health Science Center at Houston |