| Tissue | Expression Dynamics | Abbreviation |
| Colorectum (GSE201348) |  | FAP: Familial adenomatous polyposis |
| CRC: Colorectal cancer |
| Colorectum (HTA11) |  | AD: Adenomas |
| SER: Sessile serrated lesions |
| MSI-H: Microsatellite-high colorectal cancer |
| MSS: Microsatellite stable colorectal cancer |
| Esophagus | 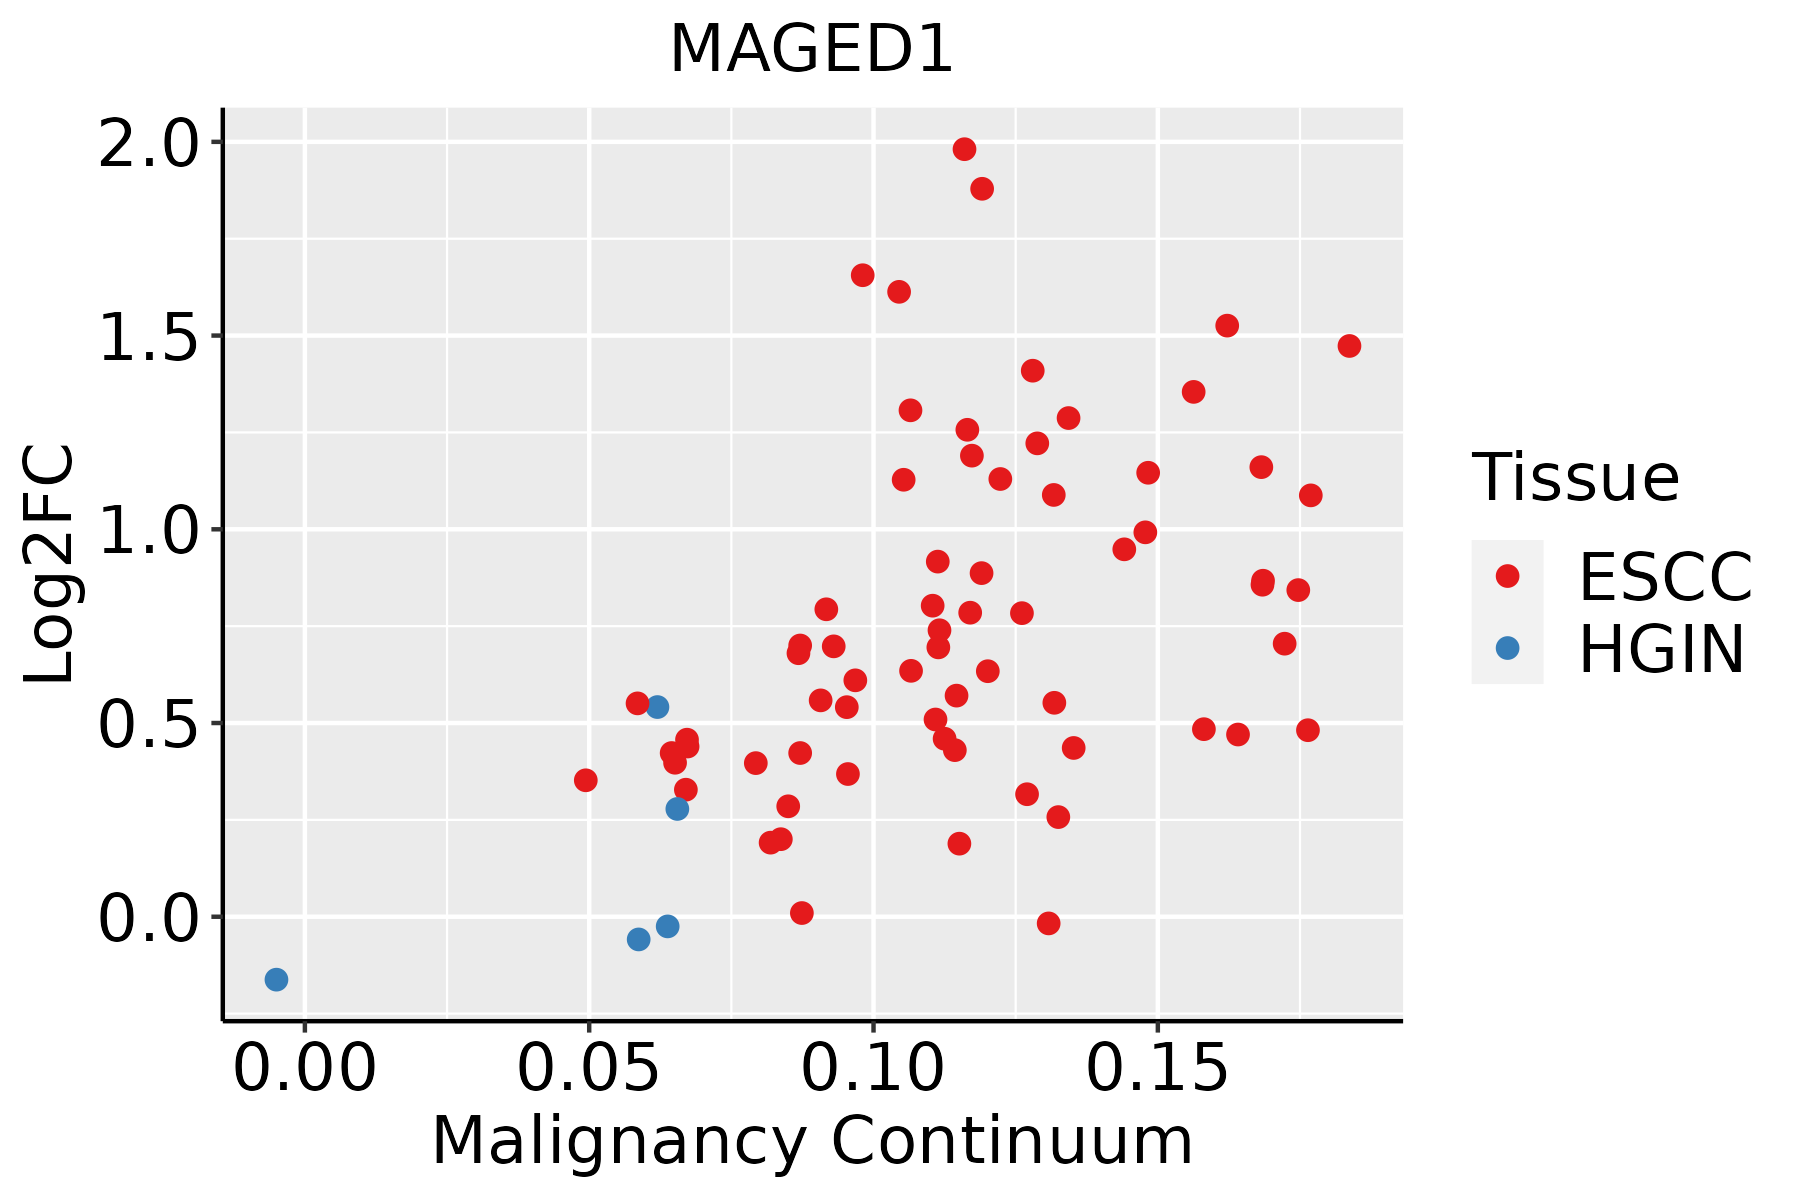 | ESCC: Esophageal squamous cell carcinoma |
| HGIN: High-grade intraepithelial neoplasias |
| LGIN: Low-grade intraepithelial neoplasias |
| Liver | 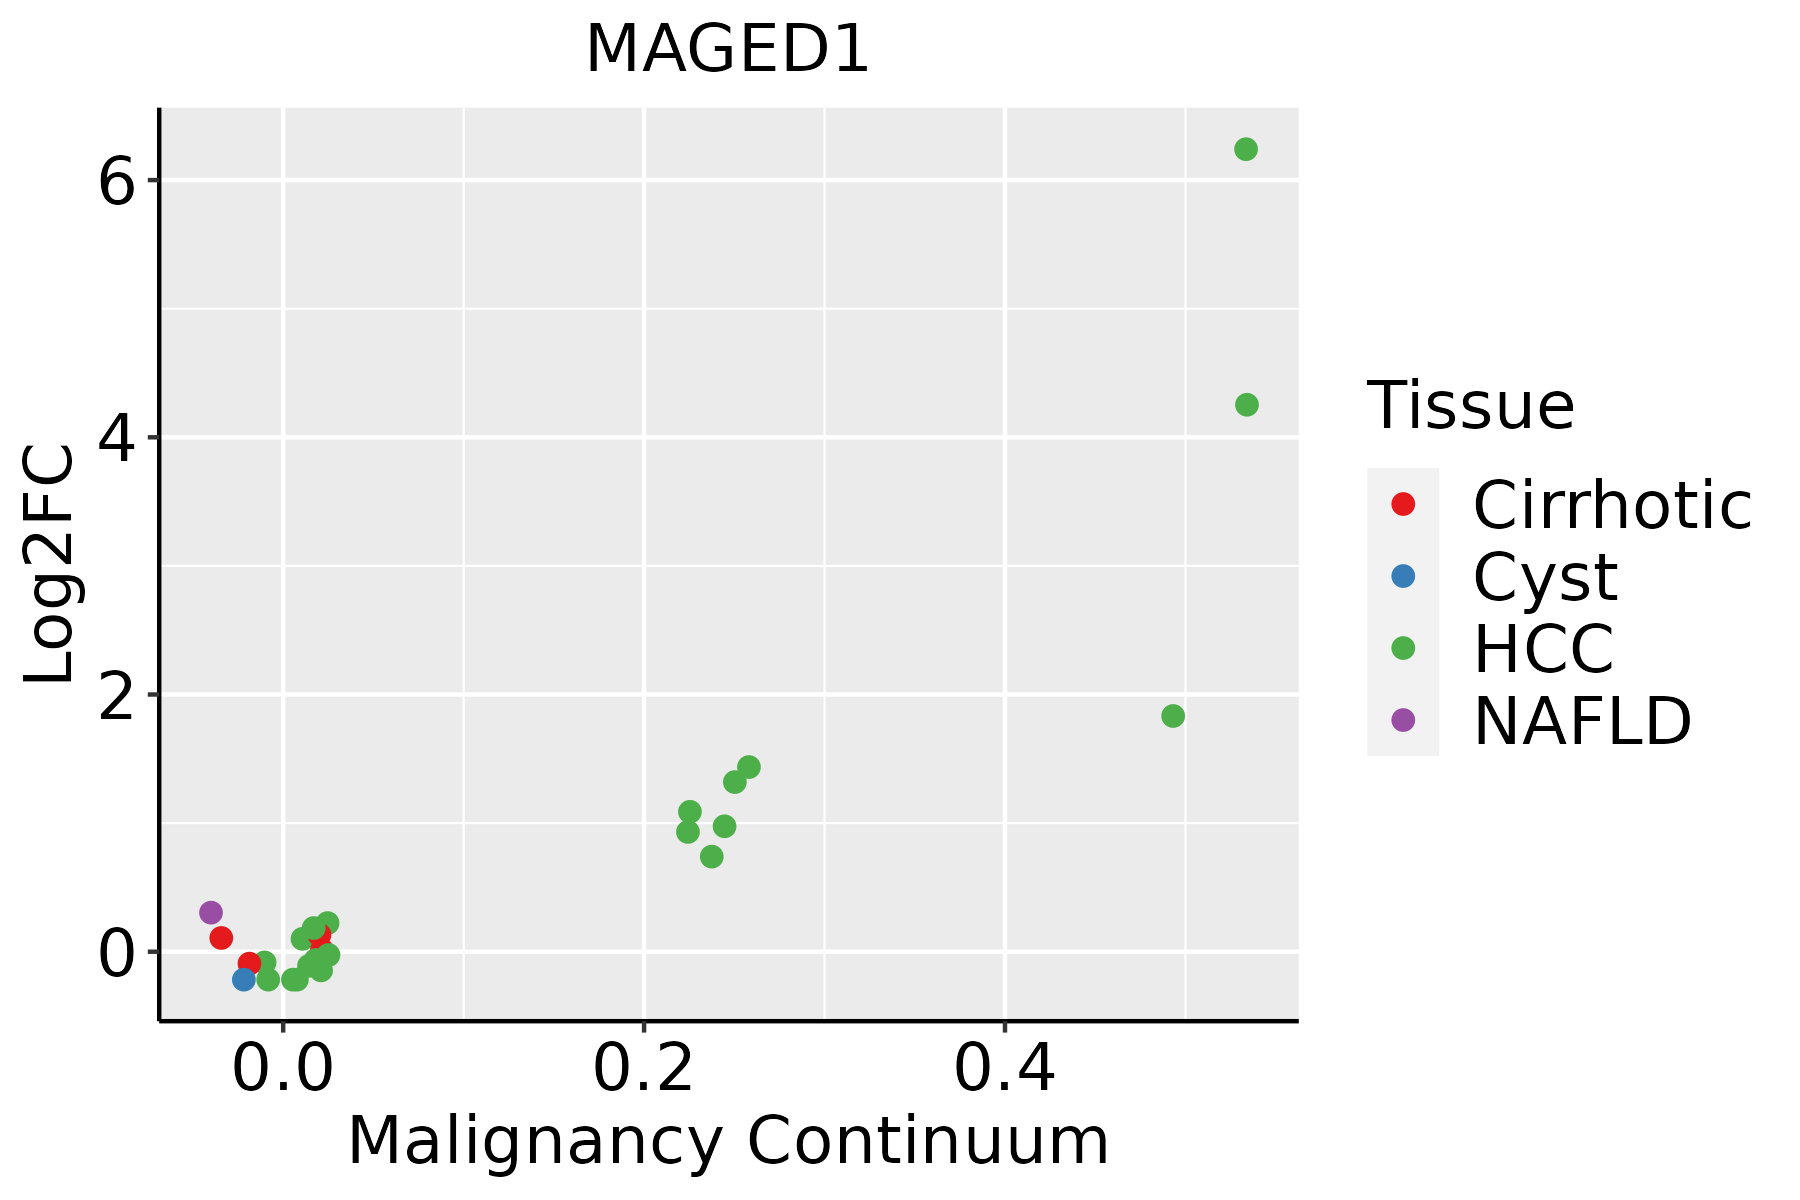 | HCC: Hepatocellular carcinoma |
| NAFLD: Non-alcoholic fatty liver disease |
| Oral Cavity |  | EOLP: Erosive Oral lichen planus |
| LP: leukoplakia |
| NEOLP: Non-erosive oral lichen planus |
| OSCC: Oral squamous cell carcinoma |
| Prostate |  | BPH: Benign Prostatic Hyperplasia |
| Skin |  | AK: Actinic keratosis |
| cSCC: Cutaneous squamous cell carcinoma |
| SCCIS:squamous cell carcinoma in situ |
| Thyroid | 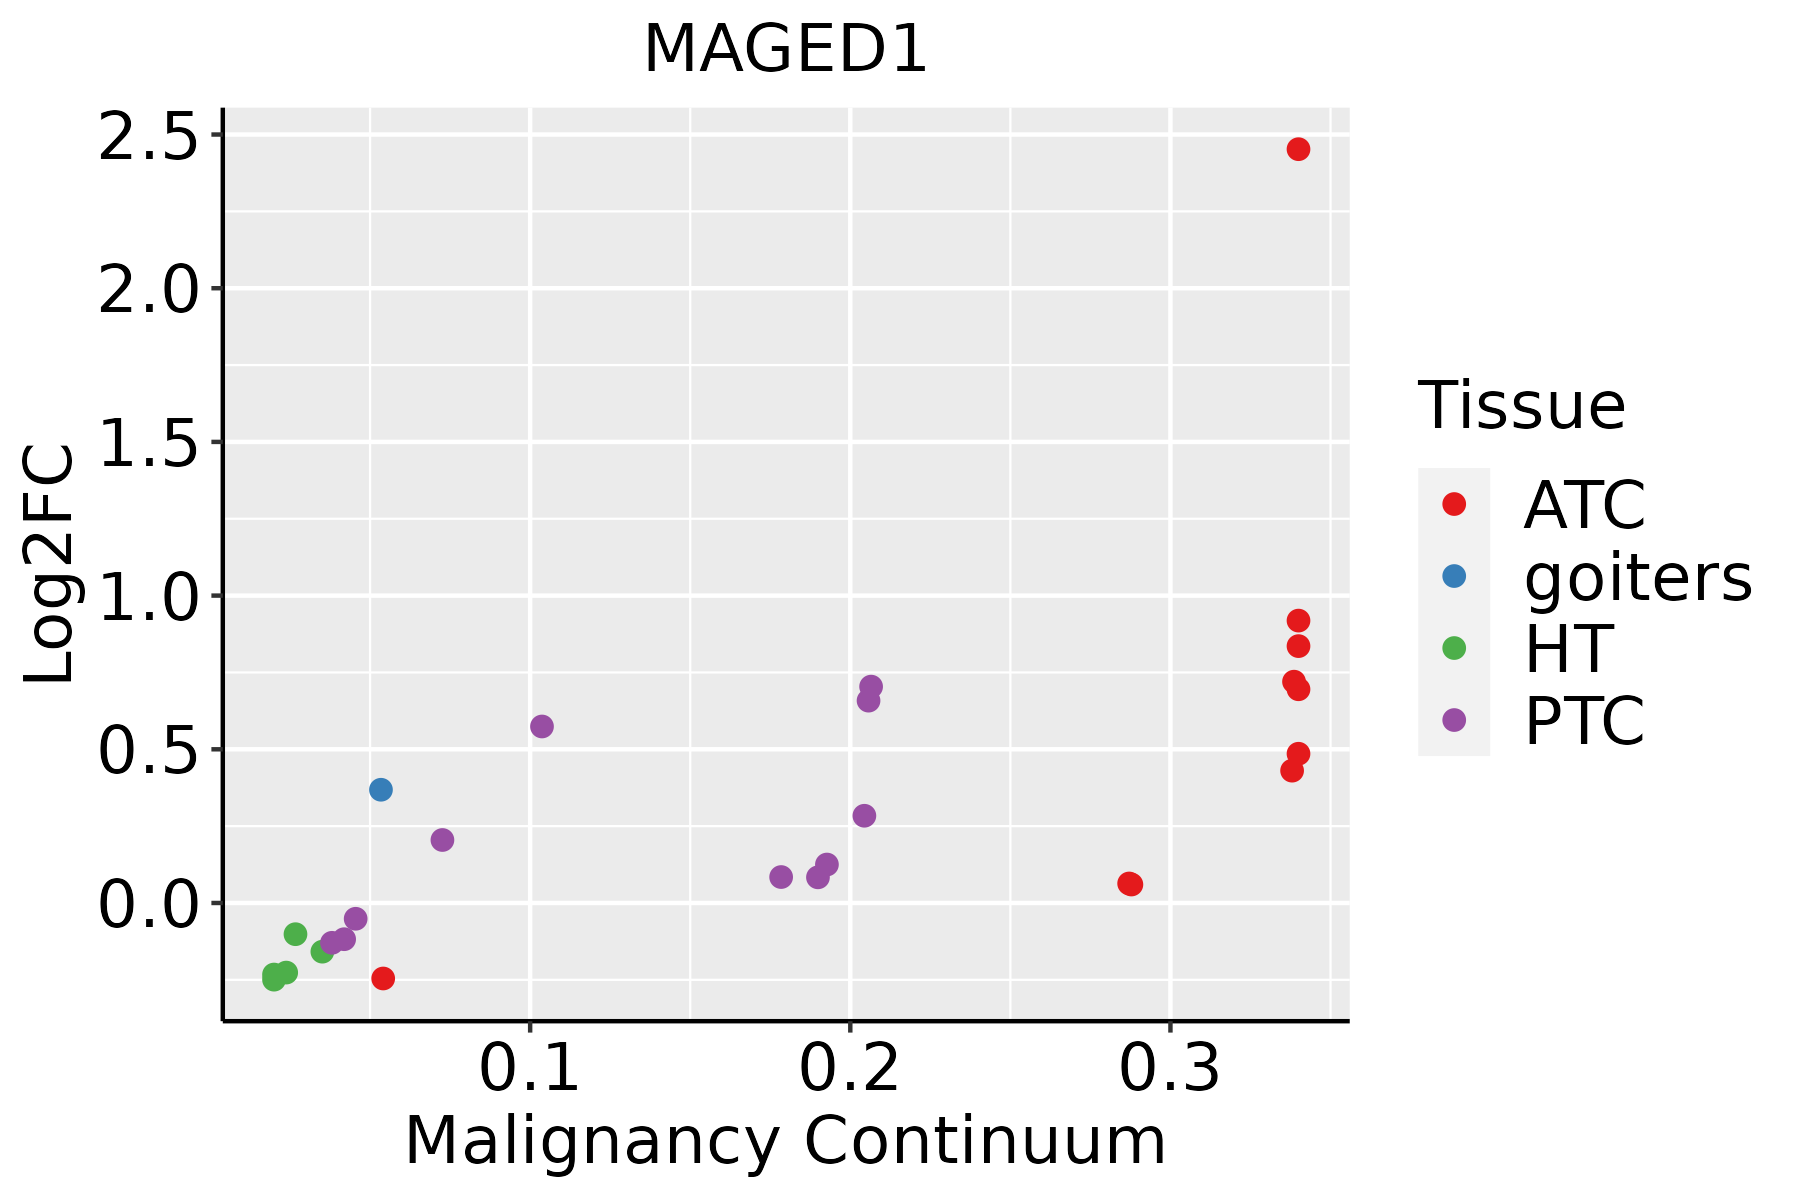 | ATC: Anaplastic thyroid cancer |
| HT: Hashimoto's thyroiditis |
| PTC: Papillary thyroid cancer |
| GO ID | Tissue | Disease Stage | Description | Gene Ratio | Bg Ratio | pvalue | p.adjust | Count |
| GO:2001233 | Colorectum | AD | regulation of apoptotic signaling pathway | 119/3918 | 356/18723 | 2.14e-08 | 1.21e-06 | 119 |
| GO:1900180 | Colorectum | AD | regulation of protein localization to nucleus | 55/3918 | 136/18723 | 1.70e-07 | 7.34e-06 | 55 |
| GO:0034504 | Colorectum | AD | protein localization to nucleus | 94/3918 | 290/18723 | 2.83e-06 | 8.09e-05 | 94 |
| GO:0007623 | Colorectum | AD | circadian rhythm | 72/3918 | 210/18723 | 4.50e-06 | 1.21e-04 | 72 |
| GO:0048511 | Colorectum | AD | rhythmic process | 94/3918 | 298/18723 | 1.00e-05 | 2.34e-04 | 94 |
| GO:0033674 | Colorectum | AD | positive regulation of kinase activity | 131/3918 | 467/18723 | 1.28e-04 | 1.85e-03 | 131 |
| GO:0060562 | Colorectum | AD | epithelial tube morphogenesis | 93/3918 | 325/18723 | 5.65e-04 | 6.00e-03 | 93 |
| GO:2001235 | Colorectum | AD | positive regulation of apoptotic signaling pathway | 42/3918 | 126/18723 | 7.85e-04 | 7.84e-03 | 42 |
| GO:0045860 | Colorectum | AD | positive regulation of protein kinase activity | 107/3918 | 386/18723 | 8.01e-04 | 7.92e-03 | 107 |
| GO:0050673 | Colorectum | AD | epithelial cell proliferation | 119/3918 | 437/18723 | 8.75e-04 | 8.51e-03 | 119 |
| GO:1903828 | Colorectum | AD | negative regulation of cellular protein localization | 39/3918 | 117/18723 | 1.18e-03 | 1.06e-02 | 39 |
| GO:0042752 | Colorectum | AD | regulation of circadian rhythm | 40/3918 | 121/18723 | 1.24e-03 | 1.09e-02 | 40 |
| GO:0071900 | Colorectum | AD | regulation of protein serine/threonine kinase activity | 98/3918 | 359/18723 | 2.18e-03 | 1.73e-02 | 98 |
| GO:0072073 | Colorectum | AD | kidney epithelium development | 42/3918 | 136/18723 | 4.02e-03 | 2.80e-02 | 42 |
| GO:0071902 | Colorectum | AD | positive regulation of protein serine/threonine kinase activity | 58/3918 | 200/18723 | 4.09e-03 | 2.84e-02 | 58 |
| GO:0001763 | Colorectum | AD | morphogenesis of a branching structure | 56/3918 | 196/18723 | 6.60e-03 | 4.09e-02 | 56 |
| GO:20012332 | Colorectum | MSS | regulation of apoptotic signaling pathway | 116/3467 | 356/18723 | 1.02e-10 | 1.06e-08 | 116 |
| GO:19001802 | Colorectum | MSS | regulation of protein localization to nucleus | 54/3467 | 136/18723 | 6.20e-09 | 3.95e-07 | 54 |
| GO:00345042 | Colorectum | MSS | protein localization to nucleus | 92/3467 | 290/18723 | 3.66e-08 | 1.98e-06 | 92 |
| GO:00076232 | Colorectum | MSS | circadian rhythm | 69/3467 | 210/18723 | 4.22e-07 | 1.67e-05 | 69 |
| Pathway ID | Tissue | Disease Stage | Description | Gene Ratio | Bg Ratio | pvalue | p.adjust | qvalue | Count |
| hsa04722 | Colorectum | AD | Neurotrophin signaling pathway | 50/2092 | 119/8465 | 2.28e-05 | 2.24e-04 | 1.43e-04 | 50 |
| hsa047221 | Colorectum | AD | Neurotrophin signaling pathway | 50/2092 | 119/8465 | 2.28e-05 | 2.24e-04 | 1.43e-04 | 50 |
| hsa047224 | Colorectum | MSS | Neurotrophin signaling pathway | 45/1875 | 119/8465 | 7.04e-05 | 6.55e-04 | 4.02e-04 | 45 |
| hsa047225 | Colorectum | MSS | Neurotrophin signaling pathway | 45/1875 | 119/8465 | 7.04e-05 | 6.55e-04 | 4.02e-04 | 45 |
| hsa047226 | Colorectum | FAP | Neurotrophin signaling pathway | 38/1404 | 119/8465 | 2.49e-05 | 2.78e-04 | 1.69e-04 | 38 |
| hsa047227 | Colorectum | FAP | Neurotrophin signaling pathway | 38/1404 | 119/8465 | 2.49e-05 | 2.78e-04 | 1.69e-04 | 38 |
| hsa047228 | Colorectum | CRC | Neurotrophin signaling pathway | 33/1091 | 119/8465 | 1.08e-05 | 3.00e-04 | 2.04e-04 | 33 |
| hsa047229 | Colorectum | CRC | Neurotrophin signaling pathway | 33/1091 | 119/8465 | 1.08e-05 | 3.00e-04 | 2.04e-04 | 33 |
| hsa0472225 | Esophagus | ESCC | Neurotrophin signaling pathway | 80/4205 | 119/8465 | 7.33e-05 | 3.07e-04 | 1.57e-04 | 80 |
| hsa04722111 | Esophagus | ESCC | Neurotrophin signaling pathway | 80/4205 | 119/8465 | 7.33e-05 | 3.07e-04 | 1.57e-04 | 80 |
| hsa0472210 | Liver | HCC | Neurotrophin signaling pathway | 74/4020 | 119/8465 | 8.27e-04 | 3.26e-03 | 1.81e-03 | 74 |
| hsa0472211 | Liver | HCC | Neurotrophin signaling pathway | 74/4020 | 119/8465 | 8.27e-04 | 3.26e-03 | 1.81e-03 | 74 |
| hsa0472220 | Oral cavity | OSCC | Neurotrophin signaling pathway | 74/3704 | 119/8465 | 3.55e-05 | 1.49e-04 | 7.58e-05 | 74 |
| hsa04722110 | Oral cavity | OSCC | Neurotrophin signaling pathway | 74/3704 | 119/8465 | 3.55e-05 | 1.49e-04 | 7.58e-05 | 74 |
| hsa0472224 | Oral cavity | LP | Neurotrophin signaling pathway | 46/2418 | 119/8465 | 1.07e-02 | 3.77e-02 | 2.43e-02 | 46 |
| hsa0472234 | Oral cavity | LP | Neurotrophin signaling pathway | 46/2418 | 119/8465 | 1.07e-02 | 3.77e-02 | 2.43e-02 | 46 |
| hsa0472218 | Prostate | BPH | Neurotrophin signaling pathway | 38/1718 | 119/8465 | 1.76e-03 | 7.16e-03 | 4.43e-03 | 38 |
| hsa0472219 | Prostate | BPH | Neurotrophin signaling pathway | 38/1718 | 119/8465 | 1.76e-03 | 7.16e-03 | 4.43e-03 | 38 |
| hsa0472223 | Prostate | Tumor | Neurotrophin signaling pathway | 39/1791 | 119/8465 | 2.01e-03 | 8.10e-03 | 5.02e-03 | 39 |
| hsa0472233 | Prostate | Tumor | Neurotrophin signaling pathway | 39/1791 | 119/8465 | 2.01e-03 | 8.10e-03 | 5.02e-03 | 39 |
| Hugo Symbol | Variant Class | Variant Classification | dbSNP RS | HGVSc | HGVSp | HGVSp Short | SWISSPROT | BIOTYPE | SIFT | PolyPhen | Tumor Sample Barcode | Tissue | Histology | Sex | Age | Stage | Therapy Types | Drugs | Outcome |
| MAGED1 | SNV | Missense_Mutation | novel | c.2408N>T | p.Pro803Leu | p.P803L | Q9Y5V3 | protein_coding | deleterious_low_confidence(0) | probably_damaging(0.943) | TCGA-A2-A4S1-01 | Breast | breast invasive carcinoma | Female | >=65 | I/II | Unknown | Unknown | SD |
| MAGED1 | SNV | Missense_Mutation | rs782818810 | c.371N>T | p.Ser124Leu | p.S124L | Q9Y5V3 | protein_coding | tolerated_low_confidence(1) | benign(0.01) | TCGA-A8-A0A2-01 | Breast | breast invasive carcinoma | Female | >=65 | I/II | Hormone Therapy | tamoxiphen | SD |
| MAGED1 | SNV | Missense_Mutation | | c.2138N>C | p.Arg713Thr | p.R713T | Q9Y5V3 | protein_coding | tolerated_low_confidence(0.17) | benign(0.21) | TCGA-AC-A23H-01 | Breast | breast invasive carcinoma | Female | >=65 | I/II | Unknown | Unknown | PD |
| MAGED1 | SNV | Missense_Mutation | novel | c.805N>A | p.Glu269Lys | p.E269K | Q9Y5V3 | protein_coding | tolerated_low_confidence(0.28) | benign(0.175) | TCGA-AO-A0JC-01 | Breast | breast invasive carcinoma | Female | <65 | I/II | Chemotherapy | fluorouracil | SD |
| MAGED1 | SNV | Missense_Mutation | novel | c.360C>A | p.Asp120Glu | p.D120E | Q9Y5V3 | protein_coding | deleterious_low_confidence(0.01) | probably_damaging(0.991) | TCGA-B6-A0RE-01 | Breast | breast invasive carcinoma | Female | <65 | I/II | Unknown | Unknown | SD |
| MAGED1 | SNV | Missense_Mutation | | c.1936G>A | p.Gly646Arg | p.G646R | Q9Y5V3 | protein_coding | tolerated_low_confidence(0.06) | probably_damaging(0.999) | TCGA-BH-A0HF-01 | Breast | breast invasive carcinoma | Female | >=65 | I/II | Hormone Therapy | arimidex | SD |
| MAGED1 | SNV | Missense_Mutation | | c.680N>T | p.Asp227Val | p.D227V | Q9Y5V3 | protein_coding | deleterious_low_confidence(0) | possibly_damaging(0.642) | TCGA-D8-A1JI-01 | Breast | breast invasive carcinoma | Female | <65 | I/II | Chemotherapy | doxorubicine | SD |
| MAGED1 | SNV | Missense_Mutation | novel | c.2395N>T | p.Arg799Cys | p.R799C | Q9Y5V3 | protein_coding | deleterious_low_confidence(0) | possibly_damaging(0.725) | TCGA-E9-A6HE-01 | Breast | breast invasive carcinoma | Female | <65 | III/IV | Chemotherapy | adriamycin | CR |
| MAGED1 | SNV | Missense_Mutation | novel | c.2461T>G | p.Phe821Val | p.F821V | Q9Y5V3 | protein_coding | tolerated_low_confidence(0.08) | probably_damaging(0.969) | TCGA-EW-A1PC-01 | Breast | breast invasive carcinoma | Female | >=65 | I/II | Hormone Therapy | tamoxiphen | SD |
| MAGED1 | deletion | In_Frame_Del | novel | c.1288_1305delNNNNNNNNNNNNNNNNNN | p.Asn432_Gln437del | p.N432_Q437del | Q9Y5V3 | protein_coding | | | TCGA-D8-A1XK-01 | Breast | breast invasive carcinoma | Female | <65 | I/II | Chemotherapy | doxorubicine+cyclophosphamide | SD |


