
|
|||||
|
 | |
| |
| |
| |
| |
| |
|
Gene: MAGEA6 |
Gene summary for MAGEA6 |
| Gene information | Species | Human | Gene symbol | MAGEA6 | Gene ID | 4105 |
| Gene name | MAGE family member A6 | |
| Gene Alias | CT1.6 | |
| Cytomap | Xq28 | |
| Gene Type | protein-coding | GO ID | GO:0000122 | UniProtAcc | P43360 |
Top |
Malignant transformation analysis |
| Identification of the aberrant gene expression in precancerous and cancerous lesions by comparing the gene expression of stem-like cells in diseased tissues with normal stem cells |
| Entrez ID | Symbol | Replicates | Species | Organ | Tissue | Adj P-value | Log2FC | Malignancy |
| 4105 | MAGEA6 | LZE8T | Human | Esophagus | ESCC | 2.72e-03 | 1.33e-01 | 0.067 |
| 4105 | MAGEA6 | LZE24T | Human | Esophagus | ESCC | 2.42e-13 | 3.17e-01 | 0.0596 |
| 4105 | MAGEA6 | P1T-E | Human | Esophagus | ESCC | 1.05e-09 | 3.65e-01 | 0.0875 |
| 4105 | MAGEA6 | P2T-E | Human | Esophagus | ESCC | 1.78e-03 | 7.41e-02 | 0.1177 |
| 4105 | MAGEA6 | P4T-E | Human | Esophagus | ESCC | 2.23e-06 | 1.77e-01 | 0.1323 |
| 4105 | MAGEA6 | P5T-E | Human | Esophagus | ESCC | 4.44e-08 | 1.62e-01 | 0.1327 |
| 4105 | MAGEA6 | P9T-E | Human | Esophagus | ESCC | 2.42e-45 | 1.07e+00 | 0.1131 |
| 4105 | MAGEA6 | P11T-E | Human | Esophagus | ESCC | 2.46e-02 | 1.62e-01 | 0.1426 |
| 4105 | MAGEA6 | P15T-E | Human | Esophagus | ESCC | 2.56e-55 | 1.06e+00 | 0.1149 |
| 4105 | MAGEA6 | P17T-E | Human | Esophagus | ESCC | 2.60e-06 | 2.84e-01 | 0.1278 |
| 4105 | MAGEA6 | P20T-E | Human | Esophagus | ESCC | 1.17e-04 | 1.59e-01 | 0.1124 |
| 4105 | MAGEA6 | P23T-E | Human | Esophagus | ESCC | 2.24e-10 | 2.63e-01 | 0.108 |
| 4105 | MAGEA6 | P24T-E | Human | Esophagus | ESCC | 2.05e-07 | 2.01e-01 | 0.1287 |
| 4105 | MAGEA6 | P26T-E | Human | Esophagus | ESCC | 4.31e-06 | 2.08e-01 | 0.1276 |
| 4105 | MAGEA6 | P28T-E | Human | Esophagus | ESCC | 9.20e-06 | 1.36e-01 | 0.1149 |
| 4105 | MAGEA6 | P37T-E | Human | Esophagus | ESCC | 1.36e-15 | 3.39e-01 | 0.1371 |
| 4105 | MAGEA6 | P40T-E | Human | Esophagus | ESCC | 1.70e-03 | 1.52e-01 | 0.109 |
| 4105 | MAGEA6 | P54T-E | Human | Esophagus | ESCC | 1.64e-05 | 1.71e-01 | 0.0975 |
| 4105 | MAGEA6 | P56T-E | Human | Esophagus | ESCC | 3.89e-06 | 4.93e-01 | 0.1613 |
| 4105 | MAGEA6 | P74T-E | Human | Esophagus | ESCC | 3.33e-12 | 2.85e-01 | 0.1479 |
| Page: 1 2 |
| Tissue | Expression Dynamics | Abbreviation |
| Esophagus | 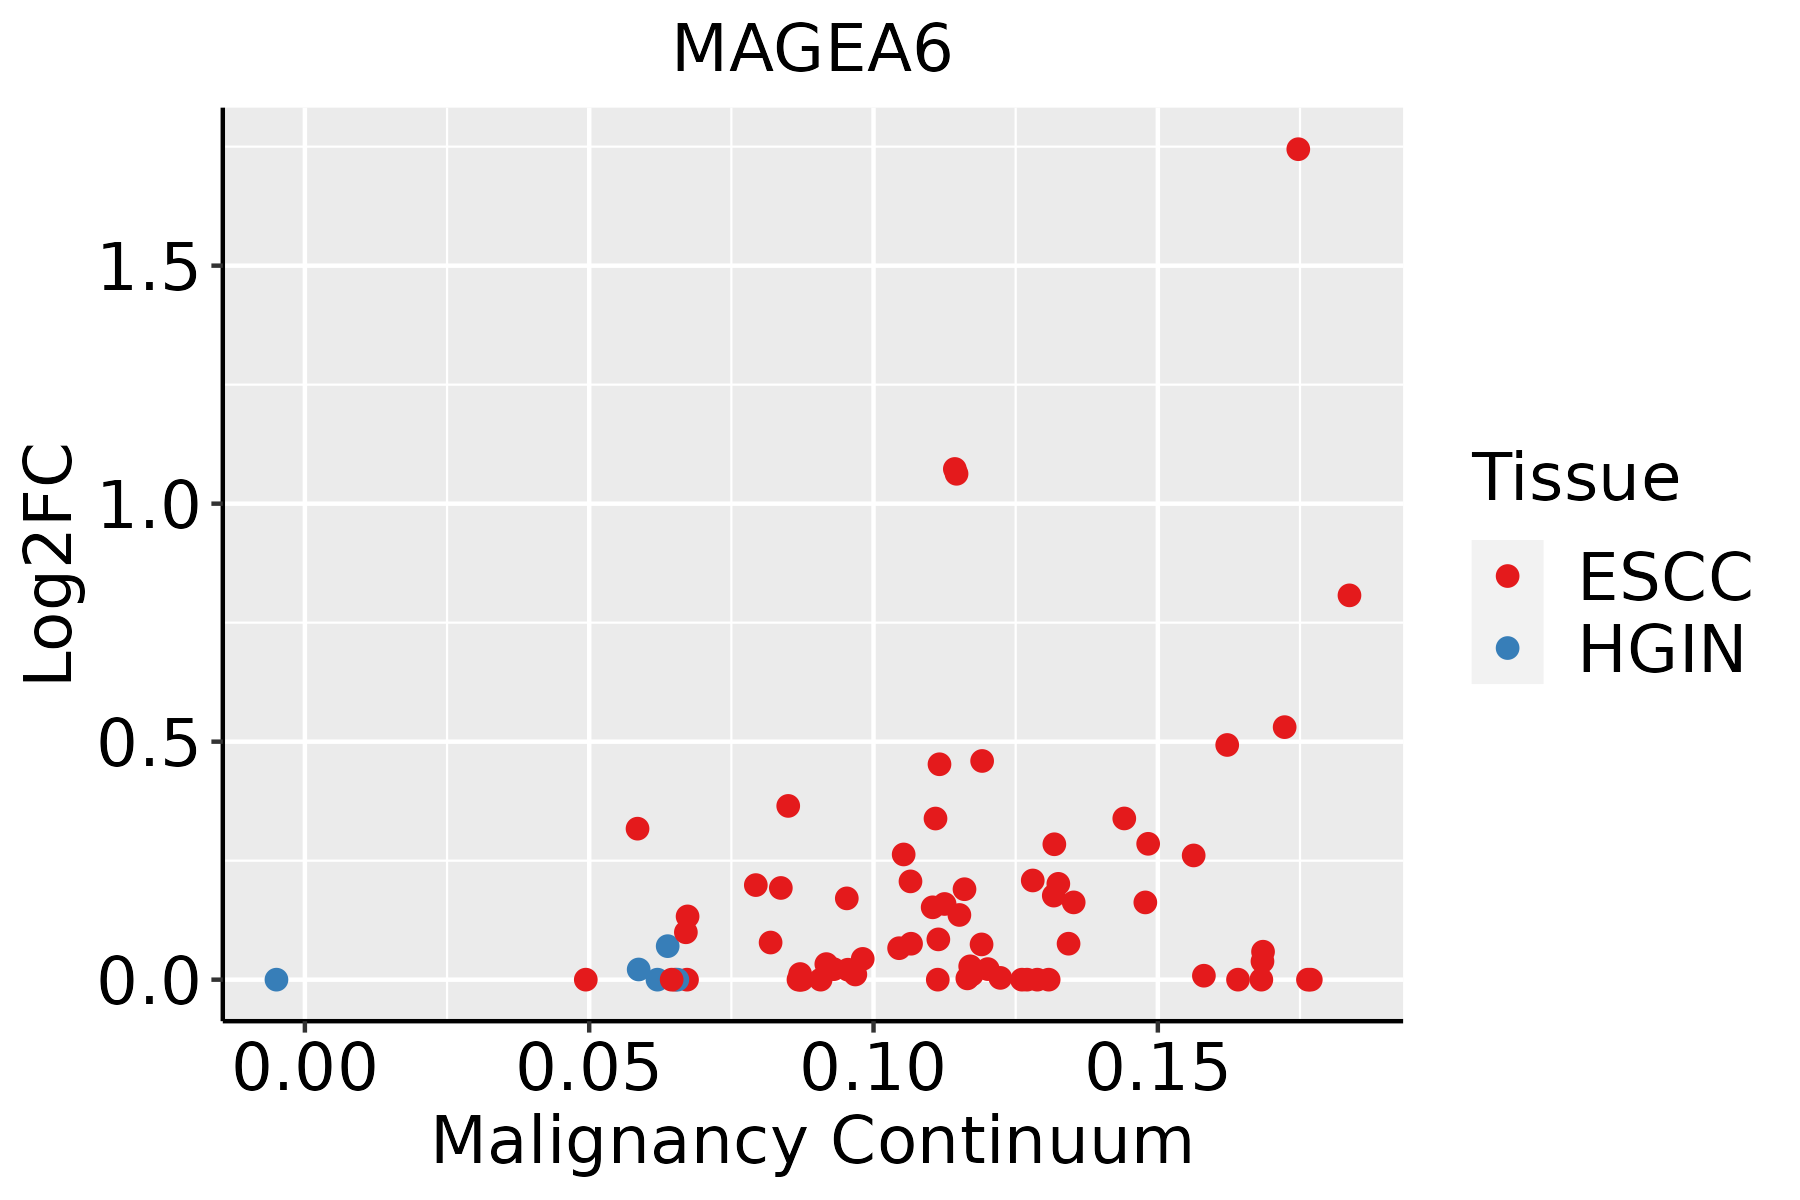 | ESCC: Esophageal squamous cell carcinoma |
| HGIN: High-grade intraepithelial neoplasias | ||
| LGIN: Low-grade intraepithelial neoplasias | ||
| Liver | 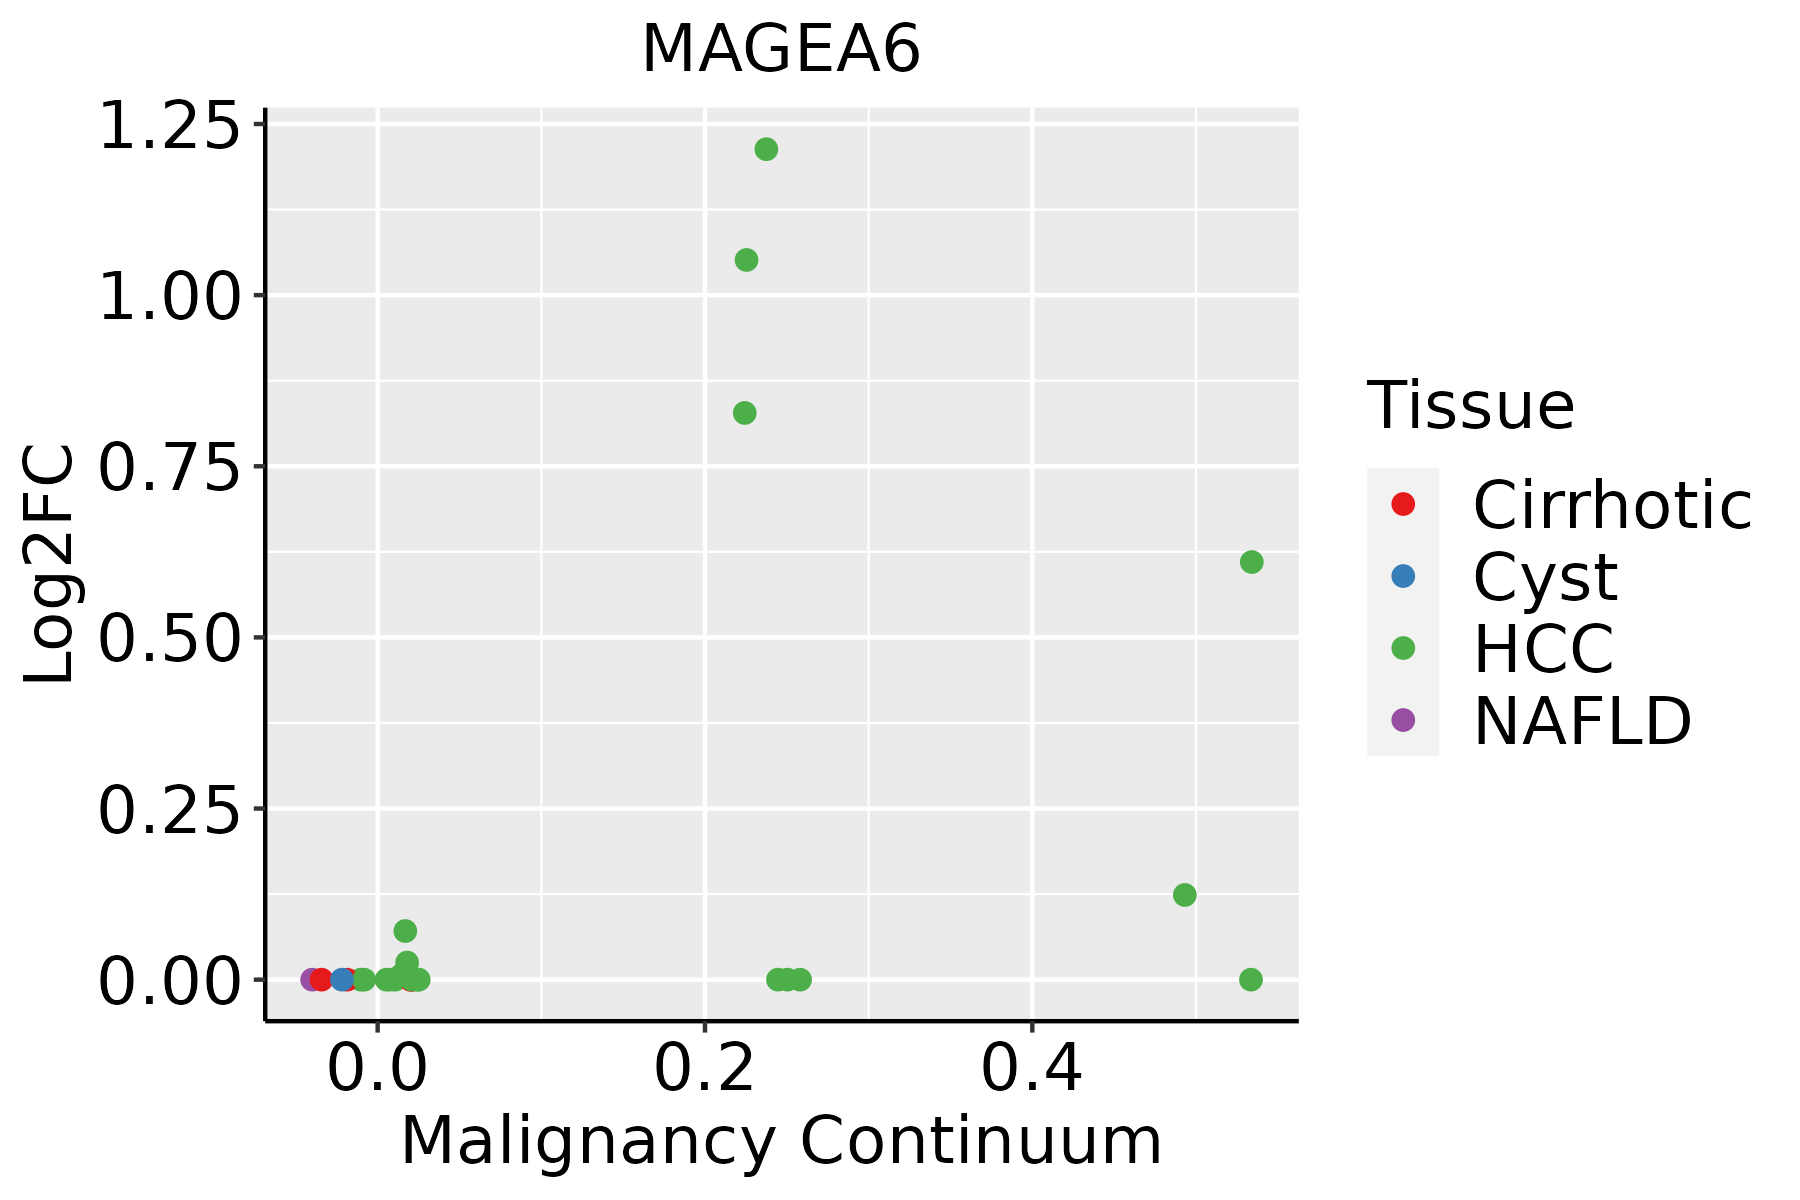 | HCC: Hepatocellular carcinoma |
| NAFLD: Non-alcoholic fatty liver disease | ||
| Oral Cavity | 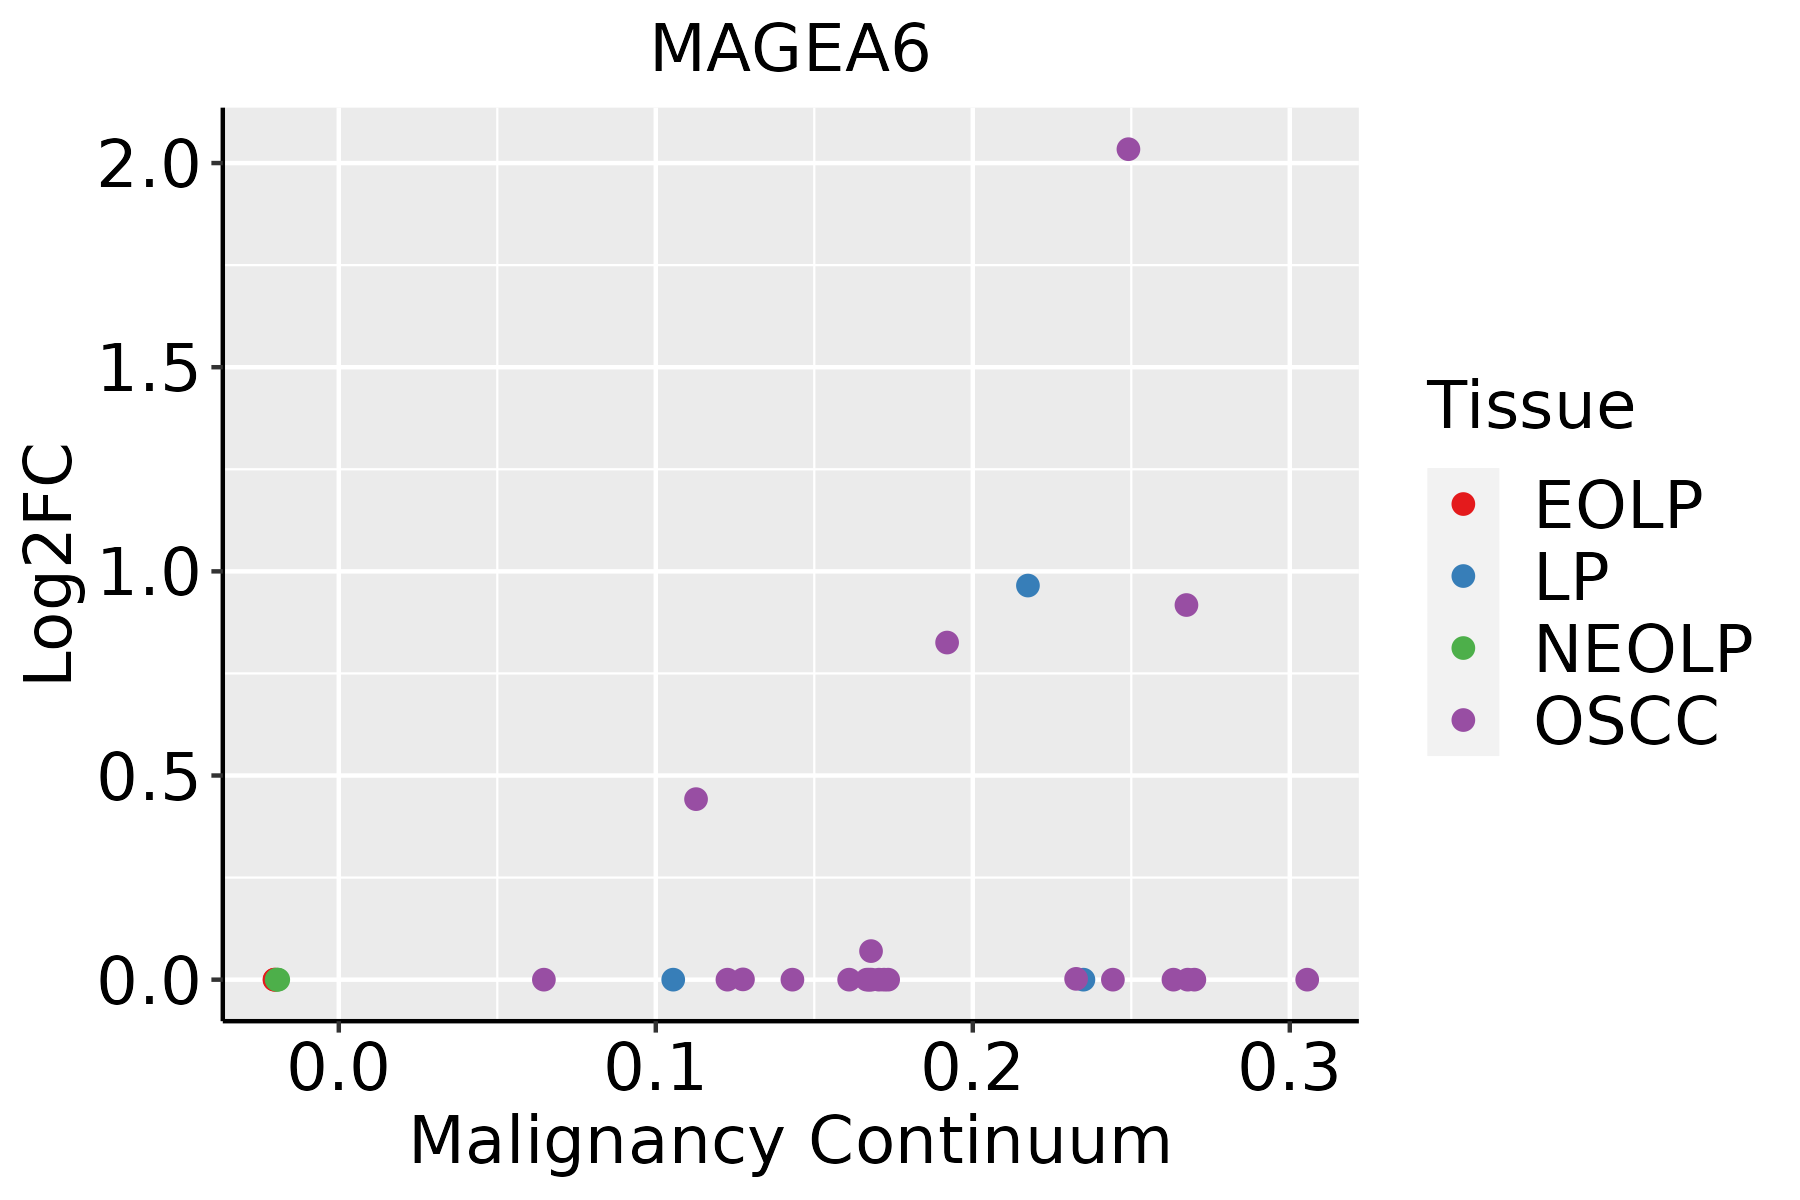 | EOLP: Erosive Oral lichen planus |
| LP: leukoplakia | ||
| NEOLP: Non-erosive oral lichen planus | ||
| OSCC: Oral squamous cell carcinoma |
| ∗log2FC in expression of this searched gene in stem-like cells from each diseased tissue sample relative to stem-like cells in normal samples in each tissue plotted against the malignancy continuum. Samples are colored based on if they are from different disease stage. |
Top |
Malignant transformation related pathway analysis |
| Find out the enriched GO biological processes and KEGG pathways involved in transition from healthy to precancer to cancer |
| Tissue | Disease Stage | Enriched GO biological Processes |
| Colorectum | AD |  |
| Colorectum | SER |  |
| Colorectum | MSS |  |
| Colorectum | MSI-H |  |
| Colorectum | FAP |  |
| ∗Top 15 enriched GO BP terms are showed in the bar plot of each disease state in each tissue. Each row represents a significant GO biological process which is colored according to the -log10(p.adjust). |
| Page: 1 2 3 4 5 6 7 8 9 |
| GO ID | Tissue | Disease Stage | Description | Gene Ratio | Bg Ratio | pvalue | p.adjust | Count |
| GO:001050617 | Esophagus | ESCC | regulation of autophagy | 220/8552 | 317/18723 | 6.72e-18 | 6.36e-16 | 220 |
| GO:0009895111 | Esophagus | ESCC | negative regulation of catabolic process | 201/8552 | 320/18723 | 3.88e-10 | 1.05e-08 | 201 |
| GO:0031330111 | Esophagus | ESCC | negative regulation of cellular catabolic process | 166/8552 | 262/18723 | 5.17e-09 | 1.08e-07 | 166 |
| GO:001050712 | Esophagus | ESCC | negative regulation of autophagy | 56/8552 | 85/18723 | 1.34e-04 | 9.09e-04 | 56 |
| GO:001050621 | Liver | HCC | regulation of autophagy | 210/7958 | 317/18723 | 7.59e-18 | 8.45e-16 | 210 |
| GO:000989522 | Liver | HCC | negative regulation of catabolic process | 196/7958 | 320/18723 | 7.98e-12 | 3.35e-10 | 196 |
| GO:003133022 | Liver | HCC | negative regulation of cellular catabolic process | 164/7958 | 262/18723 | 3.52e-11 | 1.35e-09 | 164 |
| GO:00105074 | Liver | HCC | negative regulation of autophagy | 57/7958 | 85/18723 | 4.10e-06 | 5.27e-05 | 57 |
| GO:001050610 | Oral cavity | OSCC | regulation of autophagy | 198/7305 | 317/18723 | 1.63e-17 | 1.51e-15 | 198 |
| GO:000989519 | Oral cavity | OSCC | negative regulation of catabolic process | 180/7305 | 320/18723 | 2.44e-10 | 6.86e-09 | 180 |
| GO:003133020 | Oral cavity | OSCC | negative regulation of cellular catabolic process | 152/7305 | 262/18723 | 3.04e-10 | 8.28e-09 | 152 |
| GO:00105075 | Oral cavity | OSCC | negative regulation of autophagy | 51/7305 | 85/18723 | 7.08e-05 | 5.62e-04 | 51 |
| GO:001050615 | Oral cavity | LP | regulation of autophagy | 132/4623 | 317/18723 | 1.82e-11 | 1.28e-09 | 132 |
| GO:0009895110 | Oral cavity | LP | negative regulation of catabolic process | 128/4623 | 320/18723 | 8.36e-10 | 3.91e-08 | 128 |
| GO:0031330110 | Oral cavity | LP | negative regulation of cellular catabolic process | 107/4623 | 262/18723 | 5.25e-09 | 2.16e-07 | 107 |
| GO:001050711 | Oral cavity | LP | negative regulation of autophagy | 38/4623 | 85/18723 | 4.36e-05 | 6.24e-04 | 38 |
| Page: 1 |
| Pathway ID | Tissue | Disease Stage | Description | Gene Ratio | Bg Ratio | pvalue | p.adjust | qvalue | Count |
| Page: 1 |
Top |
Cell-cell communication analysis |
| Identification of potential cell-cell interactions between two cell types and their ligand-receptor pairs for different disease states |
| Ligand | Receptor | LRpair | Pathway | Tissue | Disease Stage |
| Page: 1 |
Top |
Single-cell gene regulatory network inference analysis |
| Find out the significant the regulons (TFs) and the target genes of each regulon across cell types for different disease states |
| TF | Cell Type | Tissue | Disease Stage | Target Gene | RSS | Regulon Activity |
| ∗The dot plots of a searched regulon are shown for all cell subpopulations in each disease state of each tissue based on the regulon specific score inferred using pySCENIC and by calculating the average expression. |
| Page: 1 |
Top |
Somatic mutation of malignant transformation related genes |
| Annotation of somatic variants for genes involved in malignant transformation |
| Hugo Symbol | Variant Class | Variant Classification | dbSNP RS | HGVSc | HGVSp | HGVSp Short | SWISSPROT | BIOTYPE | SIFT | PolyPhen | Tumor Sample Barcode | Tissue | Histology | Sex | Age | Stage | Therapy Types | Drugs | Outcome |
| MAGEA6 | SNV | Missense_Mutation | novel | c.304N>C | p.Glu102Gln | p.E102Q | P43360 | protein_coding | deleterious(0.05) | benign(0.084) | TCGA-A7-A56D-01 | Breast | breast invasive carcinoma | Female | >=65 | I/II | Hormone Therapy | arimidex | SD |
| MAGEA6 | insertion | In_Frame_Ins | novel | c.182_183insAAGGGCCCTCAT | p.Pro61_Pro62insArgAlaLeuIle | p.P61_P62insRALI | P43360 | protein_coding | TCGA-A8-A08R-01 | Breast | breast invasive carcinoma | Female | <65 | I/II | Unknown | Unknown | SD | ||
| MAGEA6 | insertion | Nonsense_Mutation | novel | c.281_282insTATTTCTGTTTGTCAGGTTTAATTTTTTTTTAT | p.Gly94_Pro95insIleSerValCysGlnValTerPhePhePheMet | p.G94_P95insISVCQV*FFFM | P43360 | protein_coding | TCGA-AN-A04C-01 | Breast | breast invasive carcinoma | Female | <65 | I/II | Unknown | Unknown | SD | ||
| MAGEA6 | insertion | Frame_Shift_Ins | novel | c.858_859insTGTTCCCACTTCTCCCAGCCCGAGG | p.Leu287CysfsTer28 | p.L287Cfs*28 | P43360 | protein_coding | TCGA-BH-A0HK-01 | Breast | breast invasive carcinoma | Female | >=65 | I/II | Hormone Therapy | arimidex | SD | ||
| MAGEA6 | SNV | Missense_Mutation | c.694G>C | p.Glu232Gln | p.E232Q | P43360 | protein_coding | tolerated(0.08) | benign(0.18) | TCGA-FU-A40J-01 | Cervix | cervical & endocervical cancer | Female | <65 | III/IV | Chemotherapy | carboplatin | CR | |
| MAGEA6 | SNV | Missense_Mutation | c.446N>C | p.Val149Ala | p.V149A | P43360 | protein_coding | tolerated(0.3) | benign(0.362) | TCGA-LP-A7HU-01 | Cervix | cervical & endocervical cancer | Female | <65 | I/II | Unknown | Unknown | SD | |
| MAGEA6 | SNV | Missense_Mutation | rs139885560 | c.813C>G | p.Phe271Leu | p.F271L | P43360 | protein_coding | deleterious(0.03) | probably_damaging(0.941) | TCGA-AA-3502-01 | Colorectum | colon adenocarcinoma | Male | >=65 | I/II | Unknown | Unknown | SD |
| MAGEA6 | SNV | Missense_Mutation | novel | c.689N>G | p.Val230Gly | p.V230G | P43360 | protein_coding | deleterious(0) | probably_damaging(0.934) | TCGA-AA-3715-01 | Colorectum | colon adenocarcinoma | Male | >=65 | I/II | Unknown | Unknown | PD |
| MAGEA6 | SNV | Missense_Mutation | novel | c.893N>A | p.Arg298His | p.R298H | P43360 | protein_coding | tolerated(0.12) | benign(0) | TCGA-AA-3984-01 | Colorectum | colon adenocarcinoma | Female | <65 | I/II | Unknown | Unknown | SD |
| MAGEA6 | SNV | Missense_Mutation | c.535N>T | p.Ala179Ser | p.A179S | P43360 | protein_coding | deleterious(0.02) | benign(0.027) | TCGA-CK-4952-01 | Colorectum | colon adenocarcinoma | Female | <65 | III/IV | Unknown | Unknown | SD |
| Page: 1 2 3 4 5 6 7 |
Top |
Related drugs of malignant transformation related genes |
| Identification of chemicals and drugs interact with genes involved in malignant transfromation |
| (DGIdb 4.0) |
| Entrez ID | Symbol | Category | Interaction Types | Drug Claim Name | Drug Name | PMIDs |
| Page: 1 |

Copyright 2023-Present -The University of Texas Health Science Center at Houston |