
|
|||||
|
 | |
| |
| |
| |
| |
| |
|
Gene: MAGEA4 |
Gene summary for MAGEA4 |
| Gene information | Species | Human | Gene symbol | MAGEA4 | Gene ID | 4103 |
| Gene name | MAGE family member A4 | |
| Gene Alias | CT1.4 | |
| Cytomap | Xq28 | |
| Gene Type | protein-coding | GO ID | GO:0000122 | UniProtAcc | A0A024RC12 |
Top |
Malignant transformation analysis |
| Identification of the aberrant gene expression in precancerous and cancerous lesions by comparing the gene expression of stem-like cells in diseased tissues with normal stem cells |
| Entrez ID | Symbol | Replicates | Species | Organ | Tissue | Adj P-value | Log2FC | Malignancy |
| 4103 | MAGEA4 | LZE2T | Human | Esophagus | ESCC | 2.05e-21 | 1.78e+00 | 0.082 |
| 4103 | MAGEA4 | LZE4T | Human | Esophagus | ESCC | 5.68e-07 | 3.08e-01 | 0.0811 |
| 4103 | MAGEA4 | P1T-E | Human | Esophagus | ESCC | 4.53e-14 | 1.00e+00 | 0.0875 |
| 4103 | MAGEA4 | P5T-E | Human | Esophagus | ESCC | 2.85e-73 | 1.44e+00 | 0.1327 |
| 4103 | MAGEA4 | P9T-E | Human | Esophagus | ESCC | 2.41e-06 | 2.34e-01 | 0.1131 |
| 4103 | MAGEA4 | P16T-E | Human | Esophagus | ESCC | 2.45e-83 | 1.58e+00 | 0.1153 |
| 4103 | MAGEA4 | P17T-E | Human | Esophagus | ESCC | 1.45e-12 | 5.97e-01 | 0.1278 |
| 4103 | MAGEA4 | P24T-E | Human | Esophagus | ESCC | 1.45e-46 | 1.15e+00 | 0.1287 |
| 4103 | MAGEA4 | P26T-E | Human | Esophagus | ESCC | 1.87e-154 | 3.30e+00 | 0.1276 |
| 4103 | MAGEA4 | P27T-E | Human | Esophagus | ESCC | 2.06e-59 | 1.17e+00 | 0.1055 |
| 4103 | MAGEA4 | P28T-E | Human | Esophagus | ESCC | 3.82e-72 | 1.42e+00 | 0.1149 |
| 4103 | MAGEA4 | P37T-E | Human | Esophagus | ESCC | 2.34e-86 | 2.57e+00 | 0.1371 |
| 4103 | MAGEA4 | P38T-E | Human | Esophagus | ESCC | 2.41e-07 | 3.32e-01 | 0.127 |
| 4103 | MAGEA4 | P44T-E | Human | Esophagus | ESCC | 6.29e-05 | 1.90e-01 | 0.1096 |
| 4103 | MAGEA4 | P47T-E | Human | Esophagus | ESCC | 9.62e-68 | 1.39e+00 | 0.1067 |
| 4103 | MAGEA4 | P48T-E | Human | Esophagus | ESCC | 8.40e-04 | 1.05e-01 | 0.0959 |
| 4103 | MAGEA4 | P52T-E | Human | Esophagus | ESCC | 7.28e-26 | 1.26e+00 | 0.1555 |
| 4103 | MAGEA4 | P54T-E | Human | Esophagus | ESCC | 1.34e-09 | 2.74e-01 | 0.0975 |
| 4103 | MAGEA4 | P56T-E | Human | Esophagus | ESCC | 3.08e-28 | 2.31e+00 | 0.1613 |
| 4103 | MAGEA4 | P57T-E | Human | Esophagus | ESCC | 2.86e-20 | 9.54e-01 | 0.0926 |
| Page: 1 2 |
| Tissue | Expression Dynamics | Abbreviation |
| Esophagus | 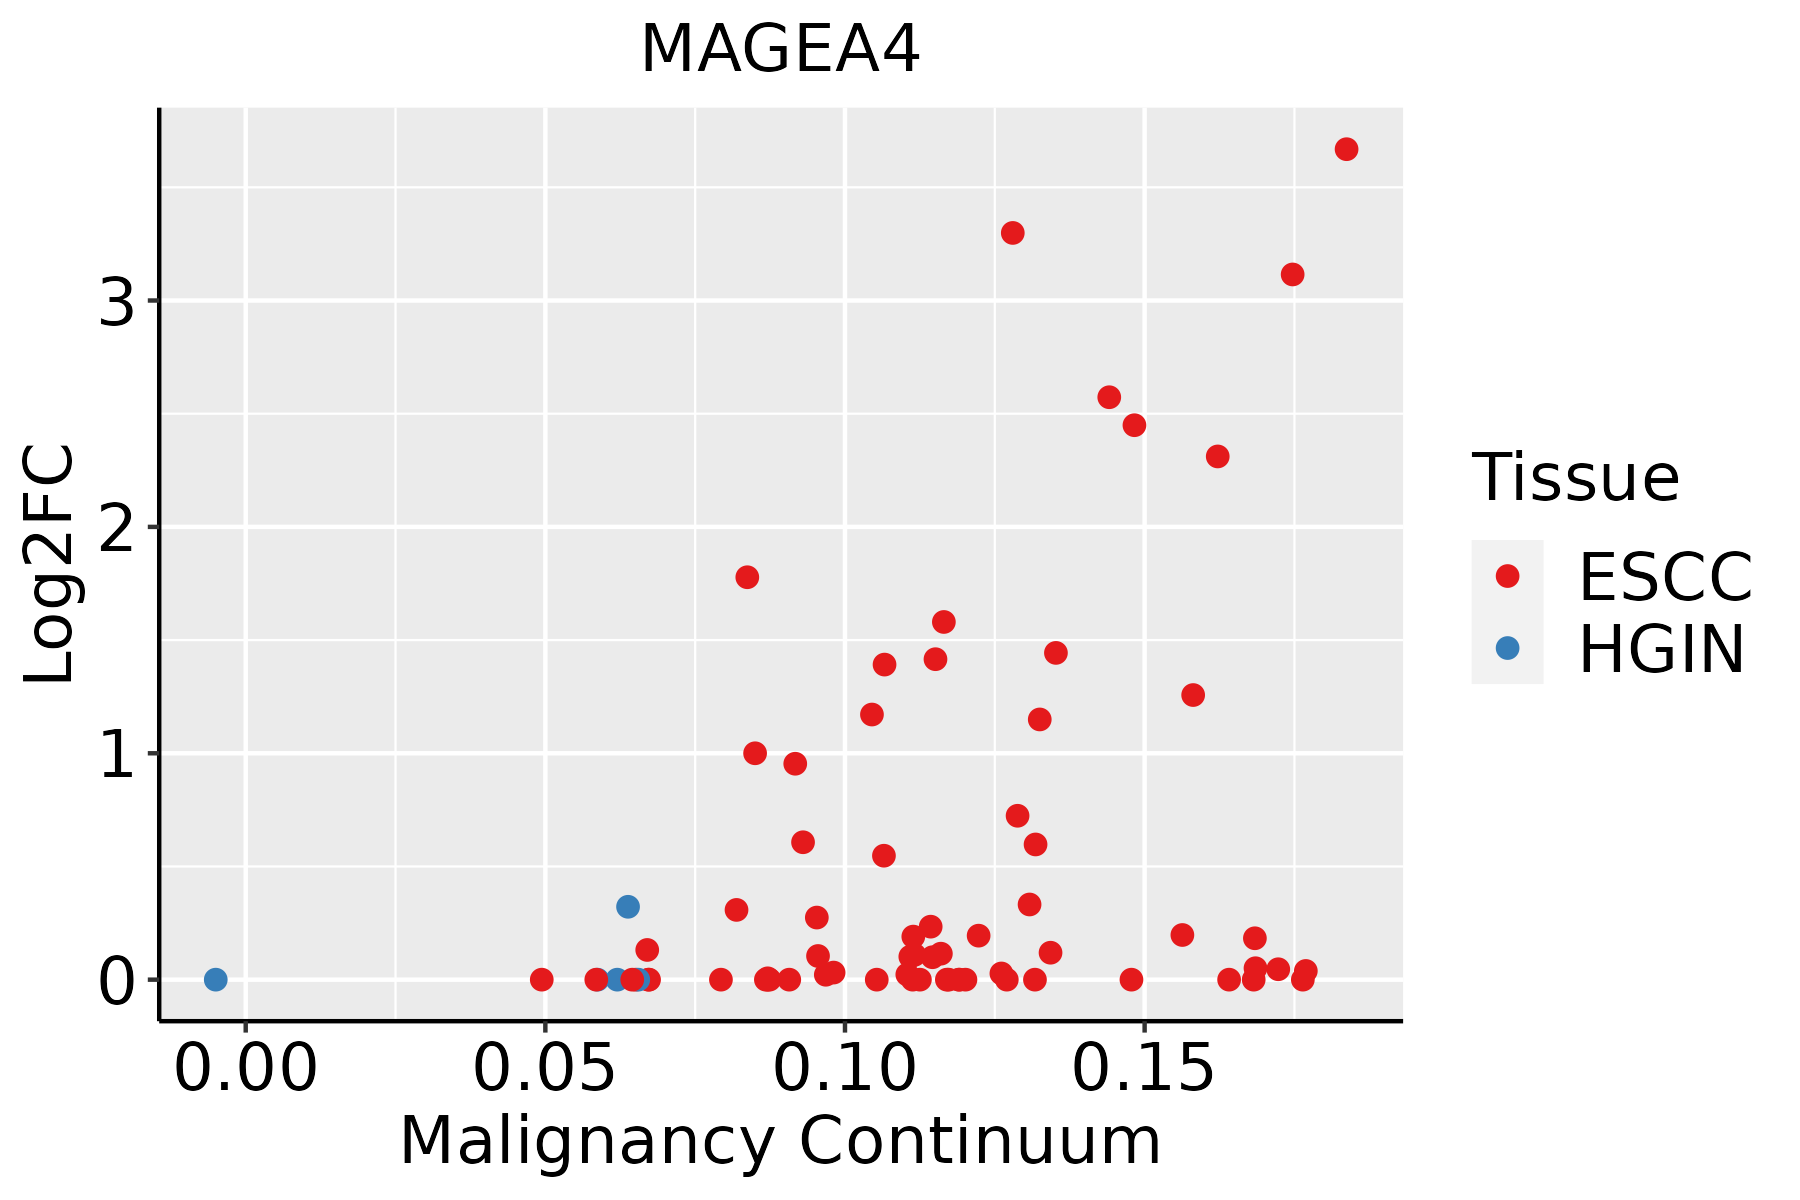 | ESCC: Esophageal squamous cell carcinoma |
| HGIN: High-grade intraepithelial neoplasias | ||
| LGIN: Low-grade intraepithelial neoplasias | ||
| Liver | 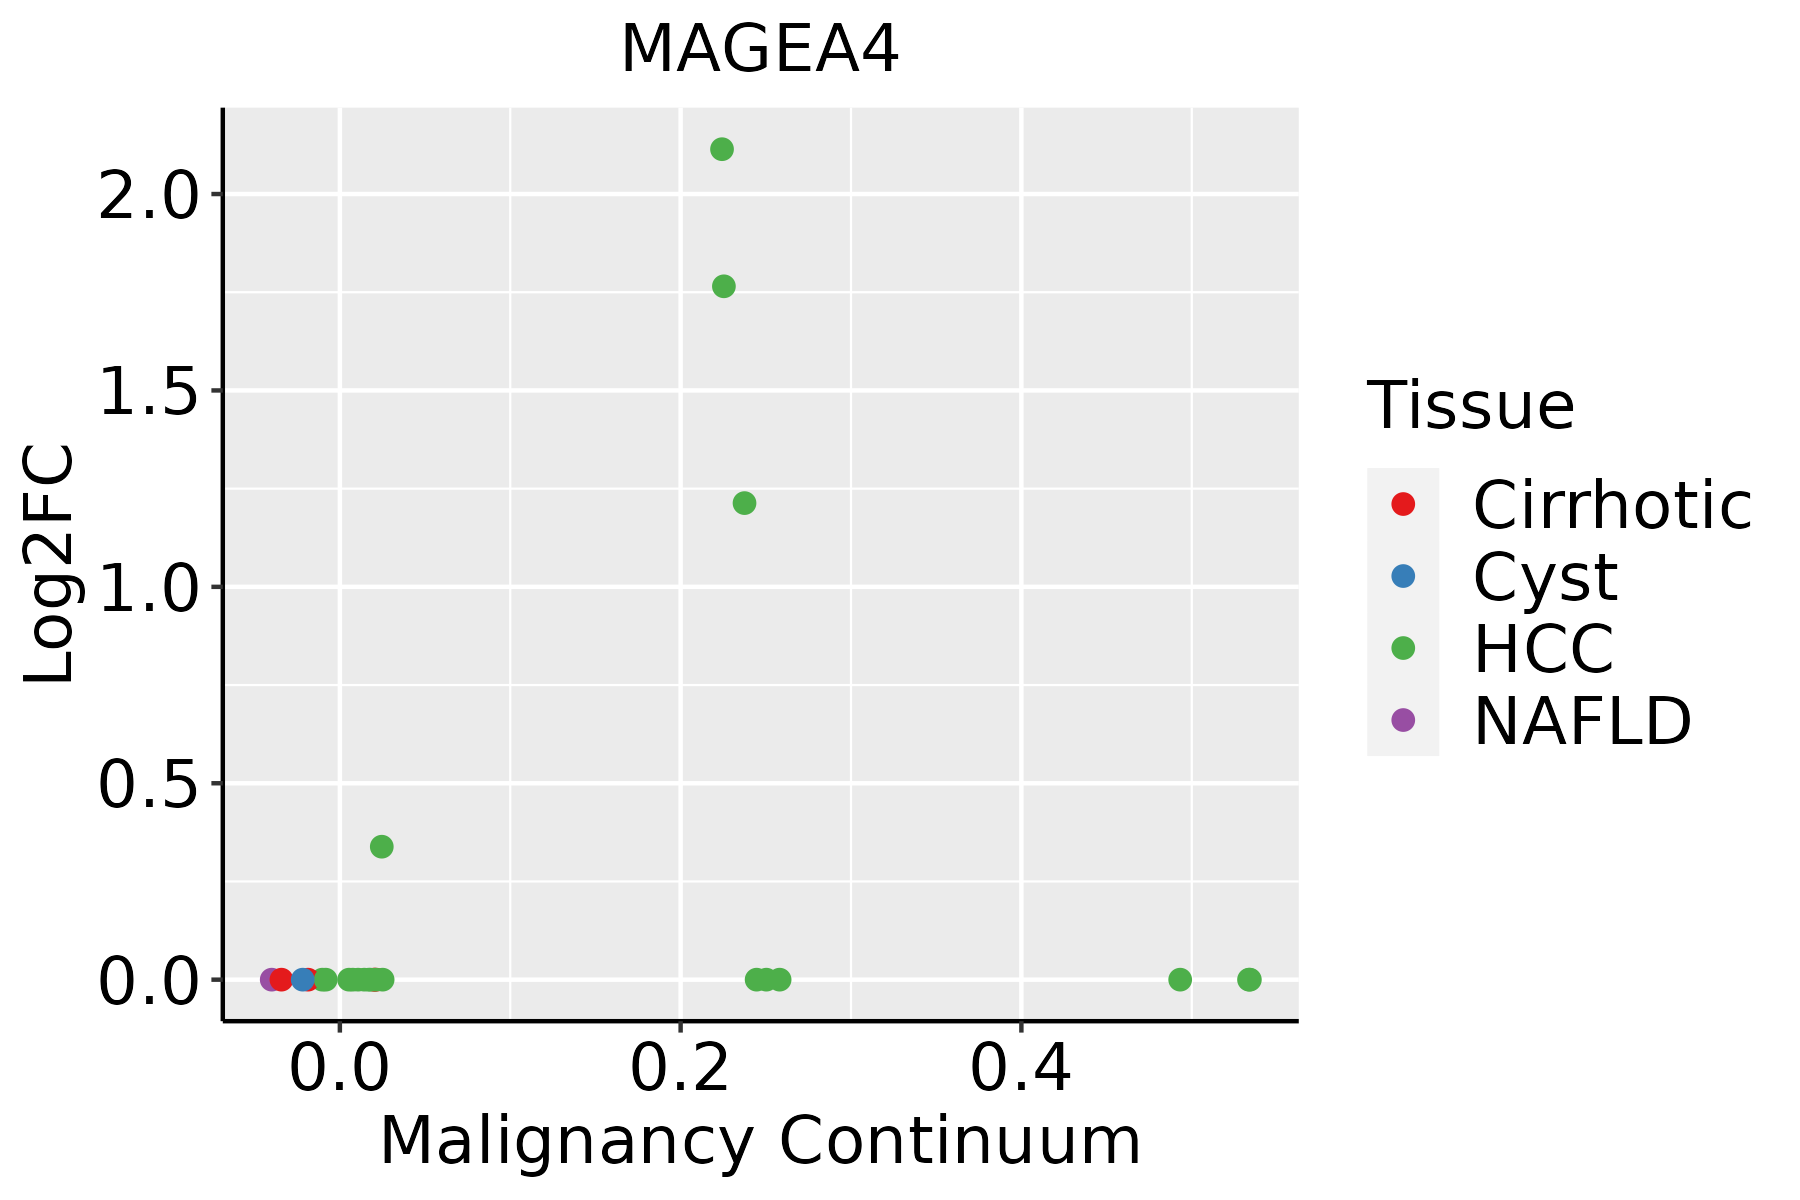 | HCC: Hepatocellular carcinoma |
| NAFLD: Non-alcoholic fatty liver disease | ||
| Oral Cavity | 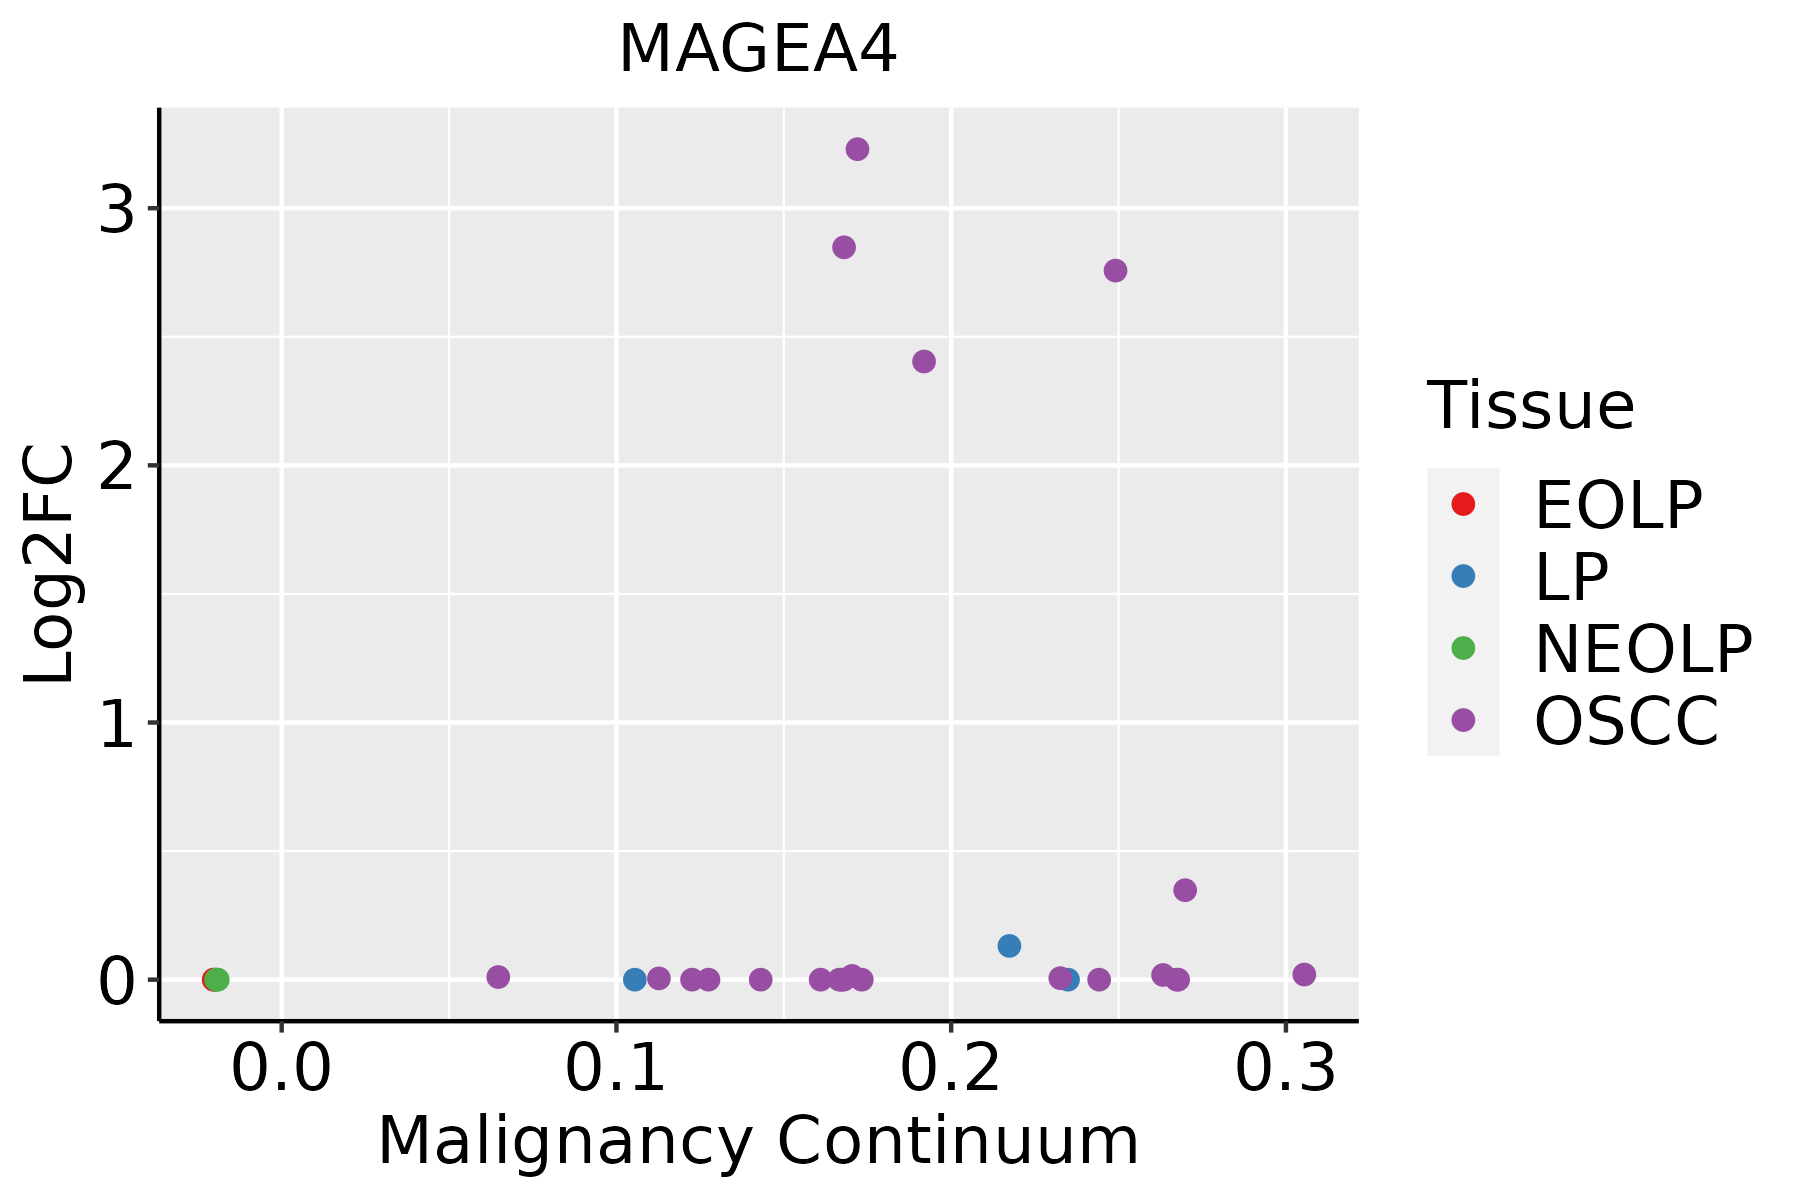 | EOLP: Erosive Oral lichen planus |
| LP: leukoplakia | ||
| NEOLP: Non-erosive oral lichen planus | ||
| OSCC: Oral squamous cell carcinoma | ||
| Skin |  | AK: Actinic keratosis |
| cSCC: Cutaneous squamous cell carcinoma | ||
| SCCIS:squamous cell carcinoma in situ | ||
| Thyroid | 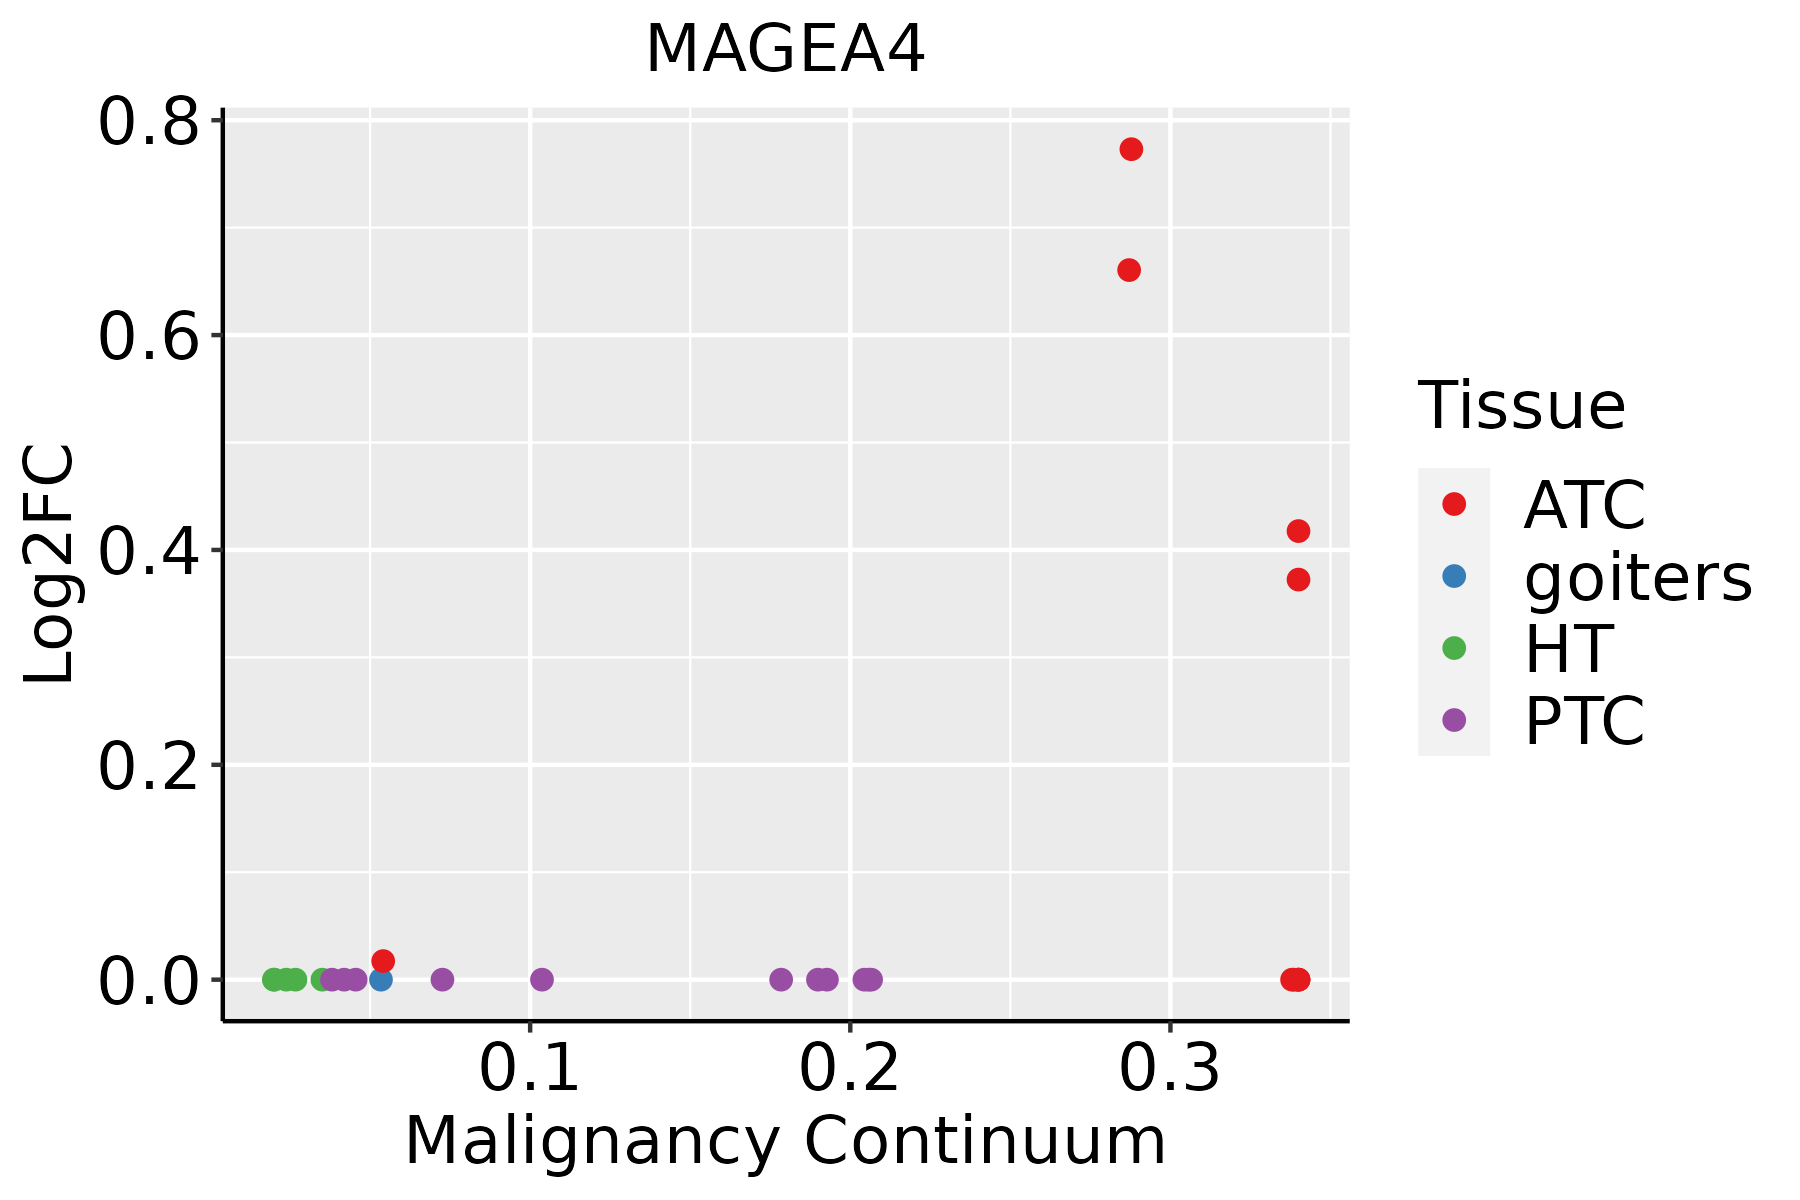 | ATC: Anaplastic thyroid cancer |
| HT: Hashimoto's thyroiditis | ||
| PTC: Papillary thyroid cancer |
| ∗log2FC in expression of this searched gene in stem-like cells from each diseased tissue sample relative to stem-like cells in normal samples in each tissue plotted against the malignancy continuum. Samples are colored based on if they are from different disease stage. |
Top |
Malignant transformation related pathway analysis |
| Find out the enriched GO biological processes and KEGG pathways involved in transition from healthy to precancer to cancer |
| Tissue | Disease Stage | Enriched GO biological Processes |
| Colorectum | AD |  |
| Colorectum | SER |  |
| Colorectum | MSS |  |
| Colorectum | MSI-H |  |
| Colorectum | FAP |  |
| ∗Top 15 enriched GO BP terms are showed in the bar plot of each disease state in each tissue. Each row represents a significant GO biological process which is colored according to the -log10(p.adjust). |
| Page: 1 2 3 4 5 6 7 8 9 |
| GO ID | Tissue | Disease Stage | Description | Gene Ratio | Bg Ratio | pvalue | p.adjust | Count |
| GO:004578710 | Esophagus | ESCC | positive regulation of cell cycle | 196/8552 | 313/18723 | 9.27e-10 | 2.24e-08 | 196 |
| GO:004578711 | Liver | HCC | positive regulation of cell cycle | 172/7958 | 313/18723 | 5.29e-06 | 6.58e-05 | 172 |
| GO:00457879 | Oral cavity | OSCC | positive regulation of cell cycle | 173/7305 | 313/18723 | 3.28e-09 | 7.44e-08 | 173 |
| GO:004578717 | Skin | cSCC | positive regulation of cell cycle | 120/4864 | 313/18723 | 8.95e-07 | 1.64e-05 | 120 |
| GO:004578719 | Thyroid | ATC | positive regulation of cell cycle | 158/6293 | 313/18723 | 4.18e-10 | 1.14e-08 | 158 |
| Page: 1 |
| Pathway ID | Tissue | Disease Stage | Description | Gene Ratio | Bg Ratio | pvalue | p.adjust | qvalue | Count |
| Page: 1 |
Top |
Cell-cell communication analysis |
| Identification of potential cell-cell interactions between two cell types and their ligand-receptor pairs for different disease states |
| Ligand | Receptor | LRpair | Pathway | Tissue | Disease Stage |
| Page: 1 |
Top |
Single-cell gene regulatory network inference analysis |
| Find out the significant the regulons (TFs) and the target genes of each regulon across cell types for different disease states |
| TF | Cell Type | Tissue | Disease Stage | Target Gene | RSS | Regulon Activity |
| ∗The dot plots of a searched regulon are shown for all cell subpopulations in each disease state of each tissue based on the regulon specific score inferred using pySCENIC and by calculating the average expression. |
| Page: 1 |
Top |
Somatic mutation of malignant transformation related genes |
| Annotation of somatic variants for genes involved in malignant transformation |
| Hugo Symbol | Variant Class | Variant Classification | dbSNP RS | HGVSc | HGVSp | HGVSp Short | SWISSPROT | BIOTYPE | SIFT | PolyPhen | Tumor Sample Barcode | Tissue | Histology | Sex | Age | Stage | Therapy Types | Drugs | Outcome |
| MAGEA4 | SNV | Missense_Mutation | c.154N>A | p.Glu52Lys | p.E52K | P43358 | protein_coding | tolerated(0.21) | possibly_damaging(0.622) | TCGA-A2-A0YK-01 | Breast | breast invasive carcinoma | Female | <65 | I/II | Chemotherapy | cytoxan | SD | |
| MAGEA4 | SNV | Missense_Mutation | c.10N>A | p.Glu4Lys | p.E4K | P43358 | protein_coding | tolerated(0.75) | probably_damaging(0.936) | TCGA-AC-A23H-01 | Breast | breast invasive carcinoma | Female | >=65 | I/II | Unknown | Unknown | PD | |
| MAGEA4 | SNV | Missense_Mutation | rs755062941 | c.805C>T | p.Arg269Cys | p.R269C | P43358 | protein_coding | tolerated(0.08) | benign(0.01) | TCGA-BH-A1FL-01 | Breast | breast invasive carcinoma | Female | >=65 | I/II | Unknown | Unknown | PD |
| MAGEA4 | SNV | Missense_Mutation | rs755062941 | c.805N>T | p.Arg269Cys | p.R269C | P43358 | protein_coding | tolerated(0.08) | benign(0.01) | TCGA-E2-A15I-01 | Breast | breast invasive carcinoma | Female | <65 | I/II | Hormone Therapy | tamoxiphen | SD |
| MAGEA4 | SNV | Missense_Mutation | novel | c.728N>A | p.Pro243His | p.P243H | P43358 | protein_coding | deleterious(0) | probably_damaging(0.996) | TCGA-2W-A8YY-01 | Cervix | cervical & endocervical cancer | Female | <65 | I/II | Chemotherapy | cisplatin | CR |
| MAGEA4 | SNV | Missense_Mutation | rs747218857 | c.916N>T | p.Arg306Cys | p.R306C | P43358 | protein_coding | deleterious(0.03) | possibly_damaging(0.502) | TCGA-IR-A3LI-01 | Cervix | cervical & endocervical cancer | Female | <65 | I/II | Chemotherapy | cisplatin | CR |
| MAGEA4 | SNV | Missense_Mutation | novel | c.442T>A | p.Phe148Ile | p.F148I | P43358 | protein_coding | deleterious(0) | probably_damaging(1) | TCGA-VS-A9UM-01 | Cervix | cervical & endocervical cancer | Female | <65 | I/II | Chemotherapy | cisplatin | CR |
| MAGEA4 | SNV | Missense_Mutation | rs778001194 | c.499N>A | p.Val167Met | p.V167M | P43358 | protein_coding | tolerated(0.08) | possibly_damaging(0.53) | TCGA-3L-AA1B-01 | Colorectum | colon adenocarcinoma | Female | <65 | I/II | Unknown | Unknown | SD |
| MAGEA4 | SNV | Missense_Mutation | c.545G>A | p.Cys182Tyr | p.C182Y | P43358 | protein_coding | deleterious(0.04) | probably_damaging(0.991) | TCGA-G4-6302-01 | Colorectum | colon adenocarcinoma | Female | >=65 | I/II | Unknown | Unknown | SD | |
| MAGEA4 | SNV | Missense_Mutation | c.446C>T | p.Pro149Leu | p.P149L | P43358 | protein_coding | tolerated(0.07) | probably_damaging(1) | TCGA-G4-6588-01 | Colorectum | colon adenocarcinoma | Female | <65 | I/II | Unknown | Unknown | SD |
| Page: 1 2 3 4 5 6 7 |
Top |
Related drugs of malignant transformation related genes |
| Identification of chemicals and drugs interact with genes involved in malignant transfromation |
| (DGIdb 4.0) |
| Entrez ID | Symbol | Category | Interaction Types | Drug Claim Name | Drug Name | PMIDs |
| 4103 | MAGEA4 | NA | CAR-T cells targeting MAGE-A4 |
| Page: 1 |

Copyright 2023-Present -The University of Texas Health Science Center at Houston |