
|
|||||
|
 | |
| |
| |
| |
| |
| |
|
Gene: MAGEA11 |
Gene summary for MAGEA11 |
| Gene information | Species | Human | Gene symbol | MAGEA11 | Gene ID | 4110 |
| Gene name | MAGE family member A11 | |
| Gene Alias | CT1.11 | |
| Cytomap | Xq28 | |
| Gene Type | protein-coding | GO ID | GO:0000122 | UniProtAcc | G5E962 |
Top |
Malignant transformation analysis |
| Identification of the aberrant gene expression in precancerous and cancerous lesions by comparing the gene expression of stem-like cells in diseased tissues with normal stem cells |
| Entrez ID | Symbol | Replicates | Species | Organ | Tissue | Adj P-value | Log2FC | Malignancy |
| 4110 | MAGEA11 | LZE2T | Human | Esophagus | ESCC | 2.18e-04 | 4.66e-01 | 0.082 |
| 4110 | MAGEA11 | LZE4T | Human | Esophagus | ESCC | 3.78e-08 | 2.52e-01 | 0.0811 |
| 4110 | MAGEA11 | LZE24T | Human | Esophagus | ESCC | 6.88e-12 | 3.04e-01 | 0.0596 |
| 4110 | MAGEA11 | P2T-E | Human | Esophagus | ESCC | 3.96e-39 | 6.22e-01 | 0.1177 |
| 4110 | MAGEA11 | P4T-E | Human | Esophagus | ESCC | 3.18e-14 | 2.92e-01 | 0.1323 |
| 4110 | MAGEA11 | P5T-E | Human | Esophagus | ESCC | 3.28e-14 | 2.67e-01 | 0.1327 |
| 4110 | MAGEA11 | P9T-E | Human | Esophagus | ESCC | 1.08e-07 | 2.28e-01 | 0.1131 |
| 4110 | MAGEA11 | P10T-E | Human | Esophagus | ESCC | 8.40e-04 | 1.35e-01 | 0.116 |
| 4110 | MAGEA11 | P15T-E | Human | Esophagus | ESCC | 1.87e-22 | 4.44e-01 | 0.1149 |
| 4110 | MAGEA11 | P17T-E | Human | Esophagus | ESCC | 8.50e-05 | 2.22e-01 | 0.1278 |
| 4110 | MAGEA11 | P19T-E | Human | Esophagus | ESCC | 5.57e-05 | 5.72e-01 | 0.1662 |
| 4110 | MAGEA11 | P20T-E | Human | Esophagus | ESCC | 1.17e-04 | 1.40e-01 | 0.1124 |
| 4110 | MAGEA11 | P26T-E | Human | Esophagus | ESCC | 5.22e-43 | 7.46e-01 | 0.1276 |
| 4110 | MAGEA11 | P28T-E | Human | Esophagus | ESCC | 6.56e-15 | 2.71e-01 | 0.1149 |
| 4110 | MAGEA11 | P37T-E | Human | Esophagus | ESCC | 2.70e-23 | 4.66e-01 | 0.1371 |
| 4110 | MAGEA11 | P42T-E | Human | Esophagus | ESCC | 6.59e-08 | 2.26e-01 | 0.1175 |
| 4110 | MAGEA11 | P47T-E | Human | Esophagus | ESCC | 9.35e-10 | 2.00e-01 | 0.1067 |
| 4110 | MAGEA11 | P54T-E | Human | Esophagus | ESCC | 9.07e-08 | 2.04e-01 | 0.0975 |
| 4110 | MAGEA11 | P56T-E | Human | Esophagus | ESCC | 1.26e-12 | 1.13e+00 | 0.1613 |
| 4110 | MAGEA11 | P57T-E | Human | Esophagus | ESCC | 8.84e-05 | 1.15e-01 | 0.0926 |
| Page: 1 2 |
| Tissue | Expression Dynamics | Abbreviation |
| Esophagus | 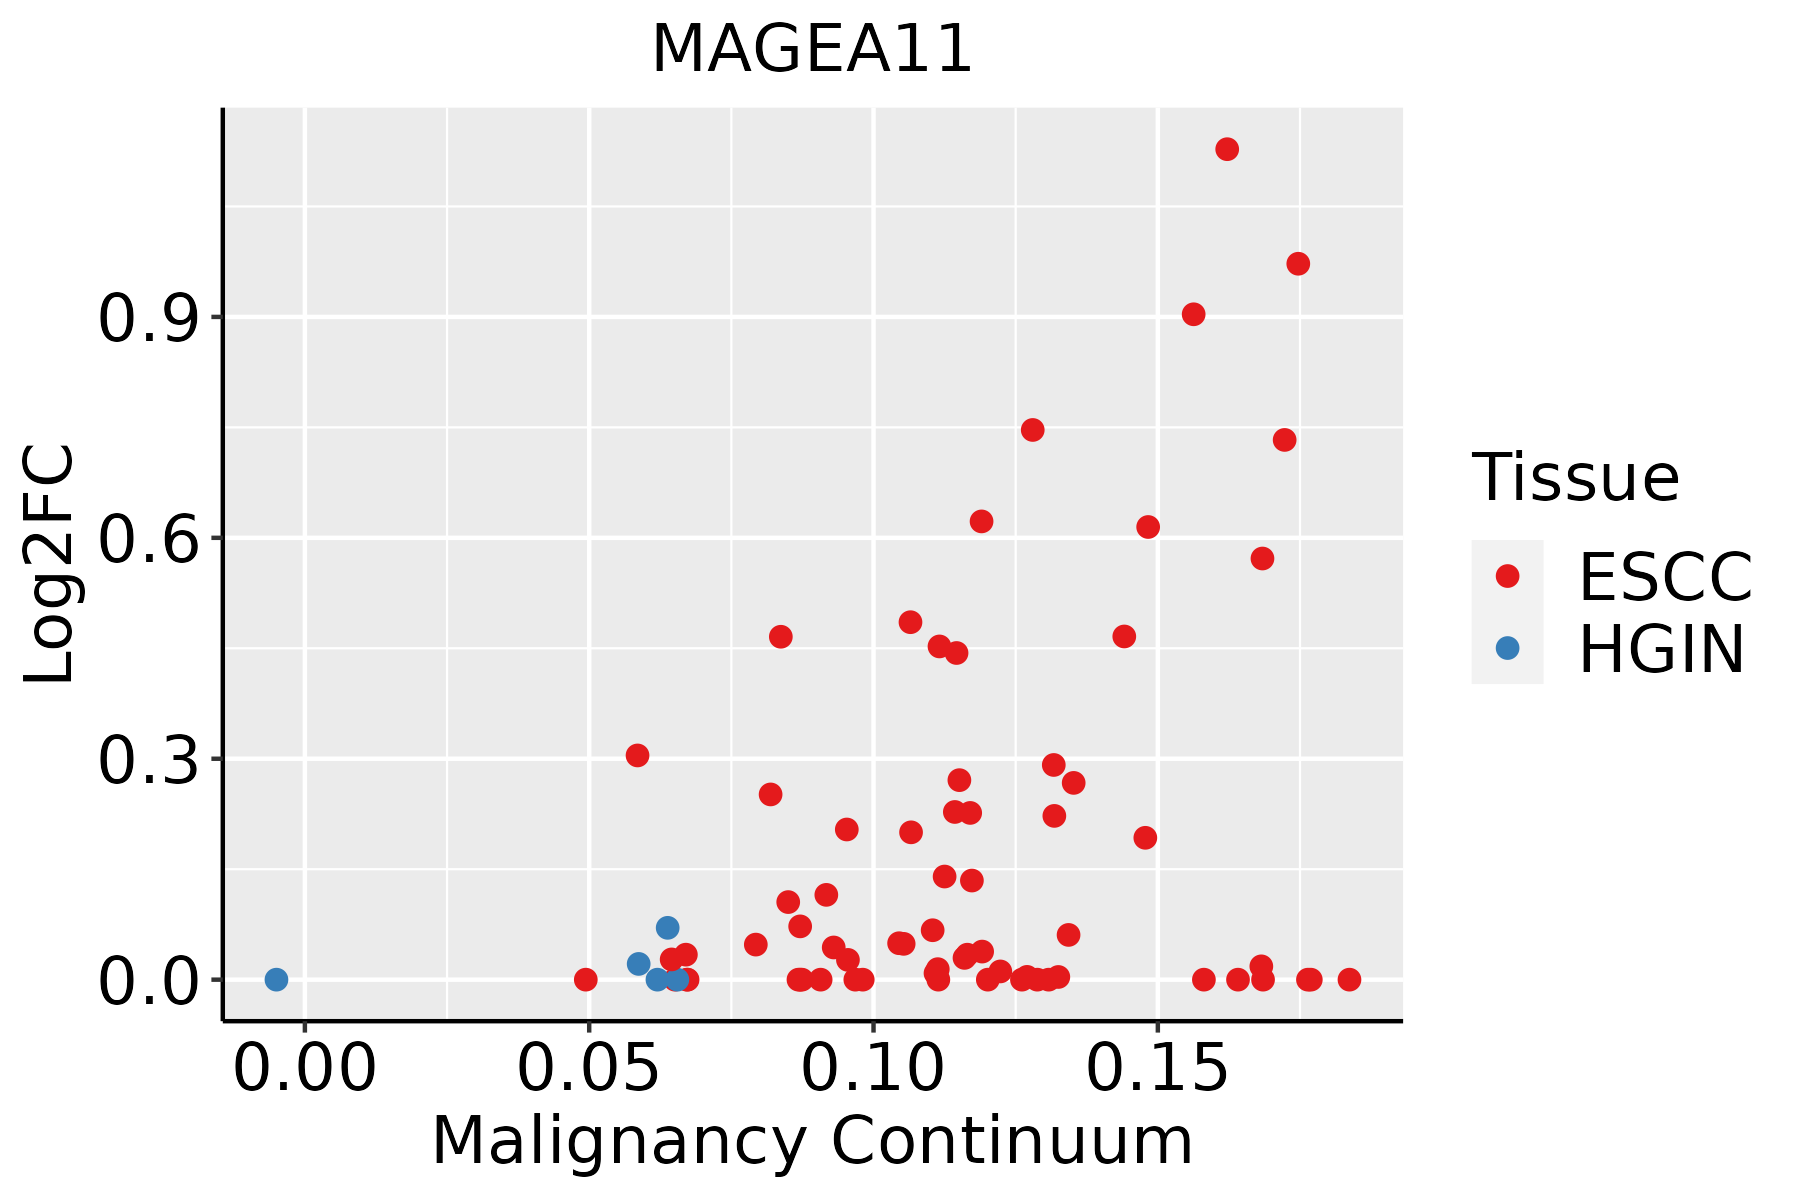 | ESCC: Esophageal squamous cell carcinoma |
| HGIN: High-grade intraepithelial neoplasias | ||
| LGIN: Low-grade intraepithelial neoplasias | ||
| Oral Cavity | 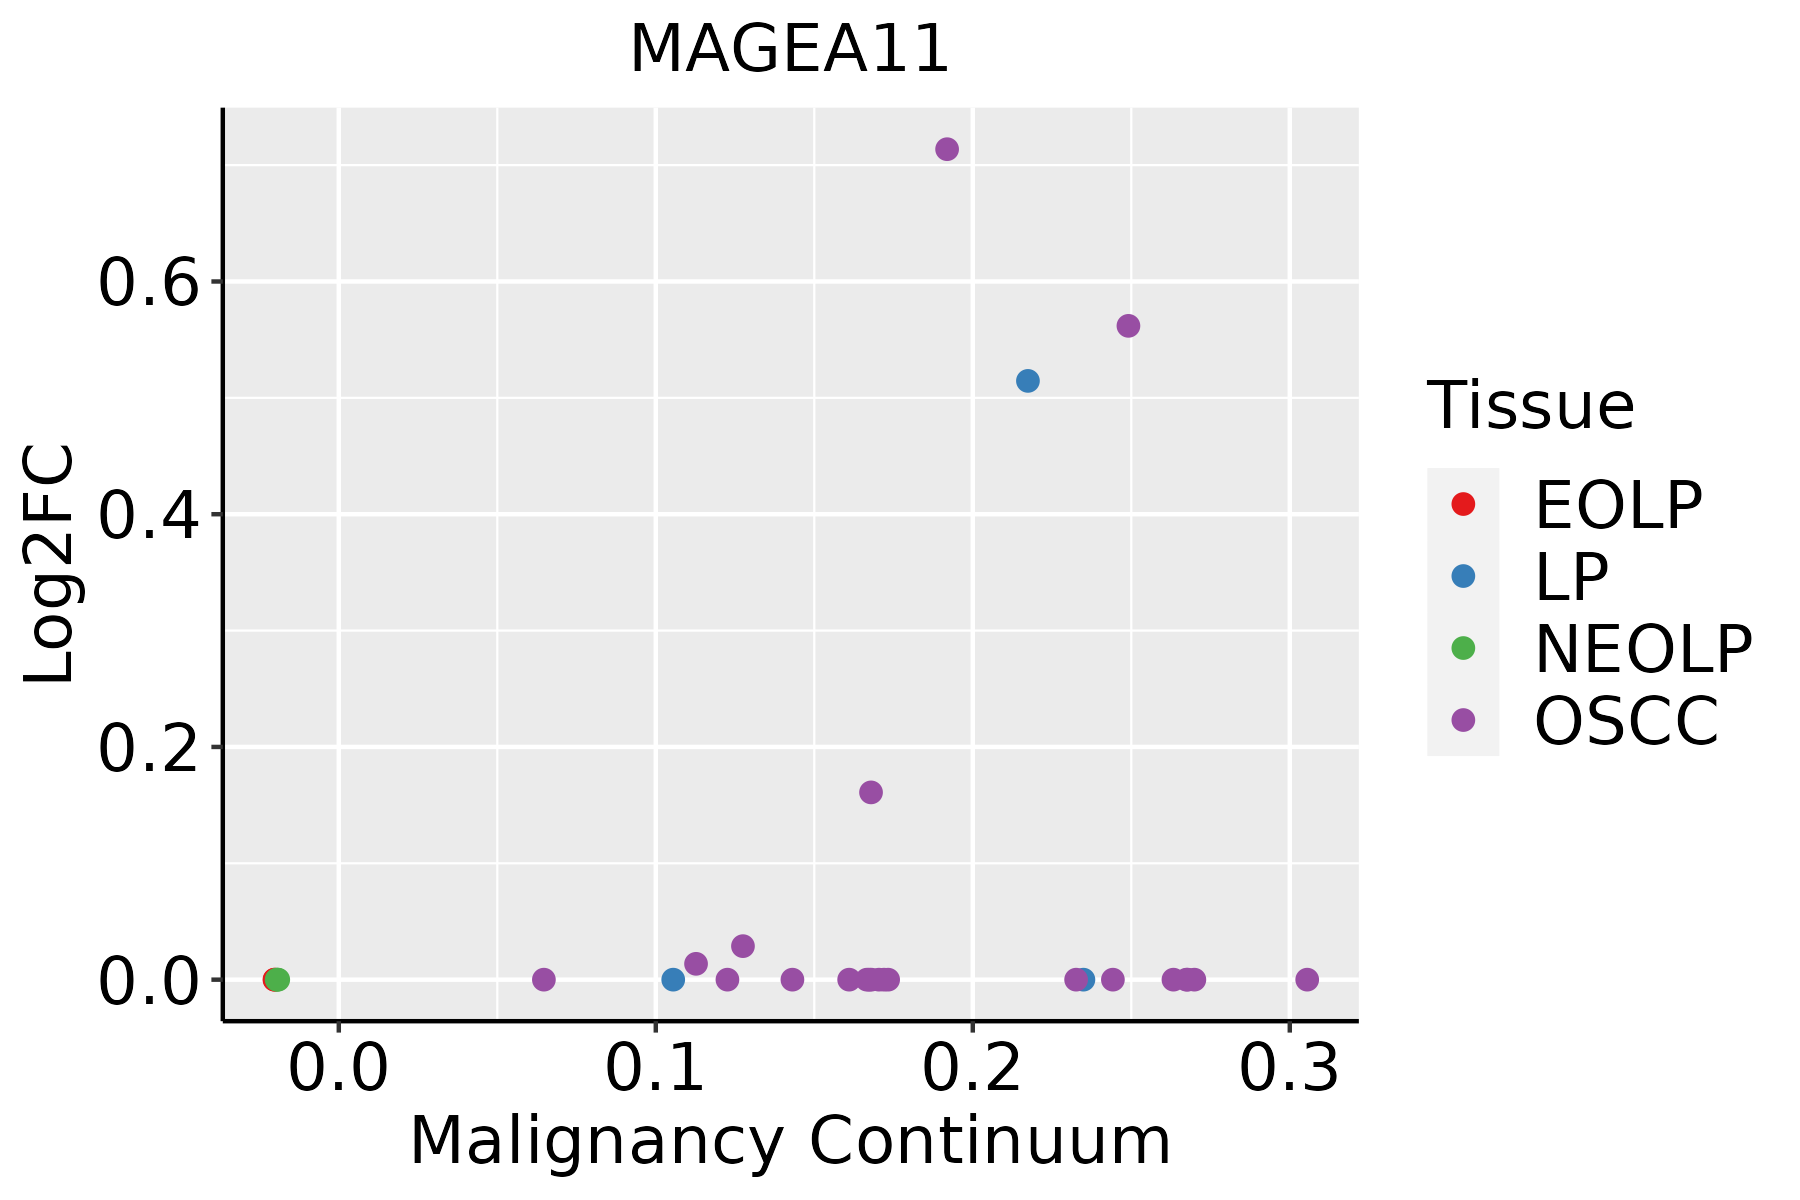 | EOLP: Erosive Oral lichen planus |
| LP: leukoplakia | ||
| NEOLP: Non-erosive oral lichen planus | ||
| OSCC: Oral squamous cell carcinoma |
| ∗log2FC in expression of this searched gene in stem-like cells from each diseased tissue sample relative to stem-like cells in normal samples in each tissue plotted against the malignancy continuum. Samples are colored based on if they are from different disease stage. |
Top |
Malignant transformation related pathway analysis |
| Find out the enriched GO biological processes and KEGG pathways involved in transition from healthy to precancer to cancer |
| Tissue | Disease Stage | Enriched GO biological Processes |
| Colorectum | AD |  |
| Colorectum | SER |  |
| Colorectum | MSS |  |
| Colorectum | MSI-H |  |
| Colorectum | FAP |  |
| ∗Top 15 enriched GO BP terms are showed in the bar plot of each disease state in each tissue. Each row represents a significant GO biological process which is colored according to the -log10(p.adjust). |
| Page: 1 2 3 4 5 6 7 8 9 |
| GO ID | Tissue | Disease Stage | Description | Gene Ratio | Bg Ratio | pvalue | p.adjust | Count |
| Page: 1 |
| Pathway ID | Tissue | Disease Stage | Description | Gene Ratio | Bg Ratio | pvalue | p.adjust | qvalue | Count |
| Page: 1 |
Top |
Cell-cell communication analysis |
| Identification of potential cell-cell interactions between two cell types and their ligand-receptor pairs for different disease states |
| Ligand | Receptor | LRpair | Pathway | Tissue | Disease Stage |
| Page: 1 |
Top |
Single-cell gene regulatory network inference analysis |
| Find out the significant the regulons (TFs) and the target genes of each regulon across cell types for different disease states |
| TF | Cell Type | Tissue | Disease Stage | Target Gene | RSS | Regulon Activity |
| ∗The dot plots of a searched regulon are shown for all cell subpopulations in each disease state of each tissue based on the regulon specific score inferred using pySCENIC and by calculating the average expression. |
| Page: 1 |
Top |
Somatic mutation of malignant transformation related genes |
| Annotation of somatic variants for genes involved in malignant transformation |
| Hugo Symbol | Variant Class | Variant Classification | dbSNP RS | HGVSc | HGVSp | HGVSp Short | SWISSPROT | BIOTYPE | SIFT | PolyPhen | Tumor Sample Barcode | Tissue | Histology | Sex | Age | Stage | Therapy Types | Drugs | Outcome |
| MAGEA11 | SNV | Missense_Mutation | c.592N>T | p.Gly198Cys | p.G198C | P43364 | protein_coding | deleterious(0.05) | benign(0.058) | TCGA-A2-A25A-01 | Breast | breast invasive carcinoma | Female | <65 | I/II | Unspecific | Cytoxan | SD | |
| MAGEA11 | SNV | Missense_Mutation | novel | c.935N>G | p.Ser312Cys | p.S312C | P43364 | protein_coding | deleterious(0) | probably_damaging(0.95) | TCGA-A2-A3Y0-01 | Breast | breast invasive carcinoma | Female | <65 | I/II | Chemotherapy | adriamycin | CR |
| MAGEA11 | SNV | Missense_Mutation | c.1189N>T | p.Met397Leu | p.M397L | P43364 | protein_coding | deleterious(0.05) | benign(0.086) | TCGA-C8-A26Y-01 | Breast | breast invasive carcinoma | Female | >=65 | I/II | Unknown | Unknown | SD | |
| MAGEA11 | SNV | Missense_Mutation | novel | c.809N>A | p.Cys270Tyr | p.C270Y | P43364 | protein_coding | tolerated(1) | benign(0.348) | TCGA-E2-A573-01 | Breast | breast invasive carcinoma | Female | <65 | I/II | Chemotherapy | taxotere | CR |
| MAGEA11 | SNV | Missense_Mutation | rs781912143 | c.848A>C | p.Asp283Ala | p.D283A | P43364 | protein_coding | deleterious(0) | possibly_damaging(0.653) | TCGA-EW-A1P7-01 | Breast | breast invasive carcinoma | Female | <65 | I/II | Chemotherapy | carboplatin | PD |
| MAGEA11 | SNV | Missense_Mutation | rs782024340 | c.437A>G | p.Gln146Arg | p.Q146R | P43364 | protein_coding | deleterious(0.05) | possibly_damaging(0.69) | TCGA-XX-A89A-01 | Breast | breast invasive carcinoma | Female | >=65 | I/II | Unknown | Unknown | SD |
| MAGEA11 | SNV | Missense_Mutation | c.1060N>A | p.Glu354Lys | p.E354K | P43364 | protein_coding | deleterious(0.01) | possibly_damaging(0.763) | TCGA-DR-A0ZM-01 | Cervix | cervical & endocervical cancer | Female | <65 | III/IV | Unspecific | Cisplatin | SD | |
| MAGEA11 | SNV | Missense_Mutation | c.35N>T | p.Cys12Phe | p.C12F | P43364 | protein_coding | tolerated_low_confidence(0.87) | benign(0.308) | TCGA-AA-3492-01 | Colorectum | colon adenocarcinoma | Female | >=65 | I/II | Unknown | Unknown | SD | |
| MAGEA11 | SNV | Missense_Mutation | novel | c.338N>C | p.Leu113Pro | p.L113P | P43364 | protein_coding | tolerated(0.21) | probably_damaging(0.996) | TCGA-AA-3947-01 | Colorectum | colon adenocarcinoma | Female | <65 | I/II | Unknown | Unknown | SD |
| MAGEA11 | SNV | Missense_Mutation | novel | c.1068N>T | p.Lys356Asn | p.K356N | P43364 | protein_coding | deleterious(0.01) | possibly_damaging(0.786) | TCGA-AA-3947-01 | Colorectum | colon adenocarcinoma | Female | <65 | I/II | Unknown | Unknown | SD |
| Page: 1 2 3 4 5 6 7 8 |
Top |
Related drugs of malignant transformation related genes |
| Identification of chemicals and drugs interact with genes involved in malignant transfromation |
| (DGIdb 4.0) |
| Entrez ID | Symbol | Category | Interaction Types | Drug Claim Name | Drug Name | PMIDs |
| Page: 1 |

Copyright 2023-Present -The University of Texas Health Science Center at Houston |