
|
|||||
|
 | |
| |
| |
| |
| |
| |
|
Gene: MAGEA1 |
Gene summary for MAGEA1 |
| Gene information | Species | Human | Gene symbol | MAGEA1 | Gene ID | 4100 |
| Gene name | MAGE family member A1 | |
| Gene Alias | CT1.1 | |
| Cytomap | Xq28 | |
| Gene Type | protein-coding | GO ID | GO:0000122 | UniProtAcc | P43355 |
Top |
Malignant transformation analysis |
| Identification of the aberrant gene expression in precancerous and cancerous lesions by comparing the gene expression of stem-like cells in diseased tissues with normal stem cells |
| Entrez ID | Symbol | Replicates | Species | Organ | Tissue | Adj P-value | Log2FC | Malignancy |
| 4100 | MAGEA1 | LZE2T | Human | Esophagus | ESCC | 5.44e-10 | 8.56e-01 | 0.082 |
| 4100 | MAGEA1 | LZE4T | Human | Esophagus | ESCC | 1.70e-03 | 1.31e-01 | 0.0811 |
| 4100 | MAGEA1 | LZE7T | Human | Esophagus | ESCC | 2.68e-16 | 8.80e-01 | 0.0667 |
| 4100 | MAGEA1 | HCC1_Meng | Human | Liver | HCC | 4.33e-03 | 1.91e-02 | 0.0246 |
| 4100 | MAGEA1 | HCC2 | Human | Liver | HCC | 2.50e-06 | 1.05e+00 | 0.5341 |
| 4100 | MAGEA1 | S014 | Human | Liver | HCC | 2.45e-28 | 7.74e-01 | 0.2254 |
| 4100 | MAGEA1 | S015 | Human | Liver | HCC | 3.77e-10 | 5.96e-01 | 0.2375 |
| 4100 | MAGEA1 | S016 | Human | Liver | HCC | 9.85e-26 | 7.68e-01 | 0.2243 |
| 4100 | MAGEA1 | C30 | Human | Oral cavity | OSCC | 4.65e-50 | 1.88e+00 | 0.3055 |
| 4100 | MAGEA1 | C43 | Human | Oral cavity | OSCC | 3.76e-70 | 1.20e+00 | 0.1704 |
| 4100 | MAGEA1 | C08 | Human | Oral cavity | OSCC | 9.26e-07 | 2.63e-01 | 0.1919 |
| 4100 | MAGEA1 | SYSMH1 | Human | Oral cavity | OSCC | 6.15e-15 | 3.08e-01 | 0.1127 |
| Page: 1 |
| Tissue | Expression Dynamics | Abbreviation |
| Esophagus |  | ESCC: Esophageal squamous cell carcinoma |
| HGIN: High-grade intraepithelial neoplasias | ||
| LGIN: Low-grade intraepithelial neoplasias | ||
| Liver | 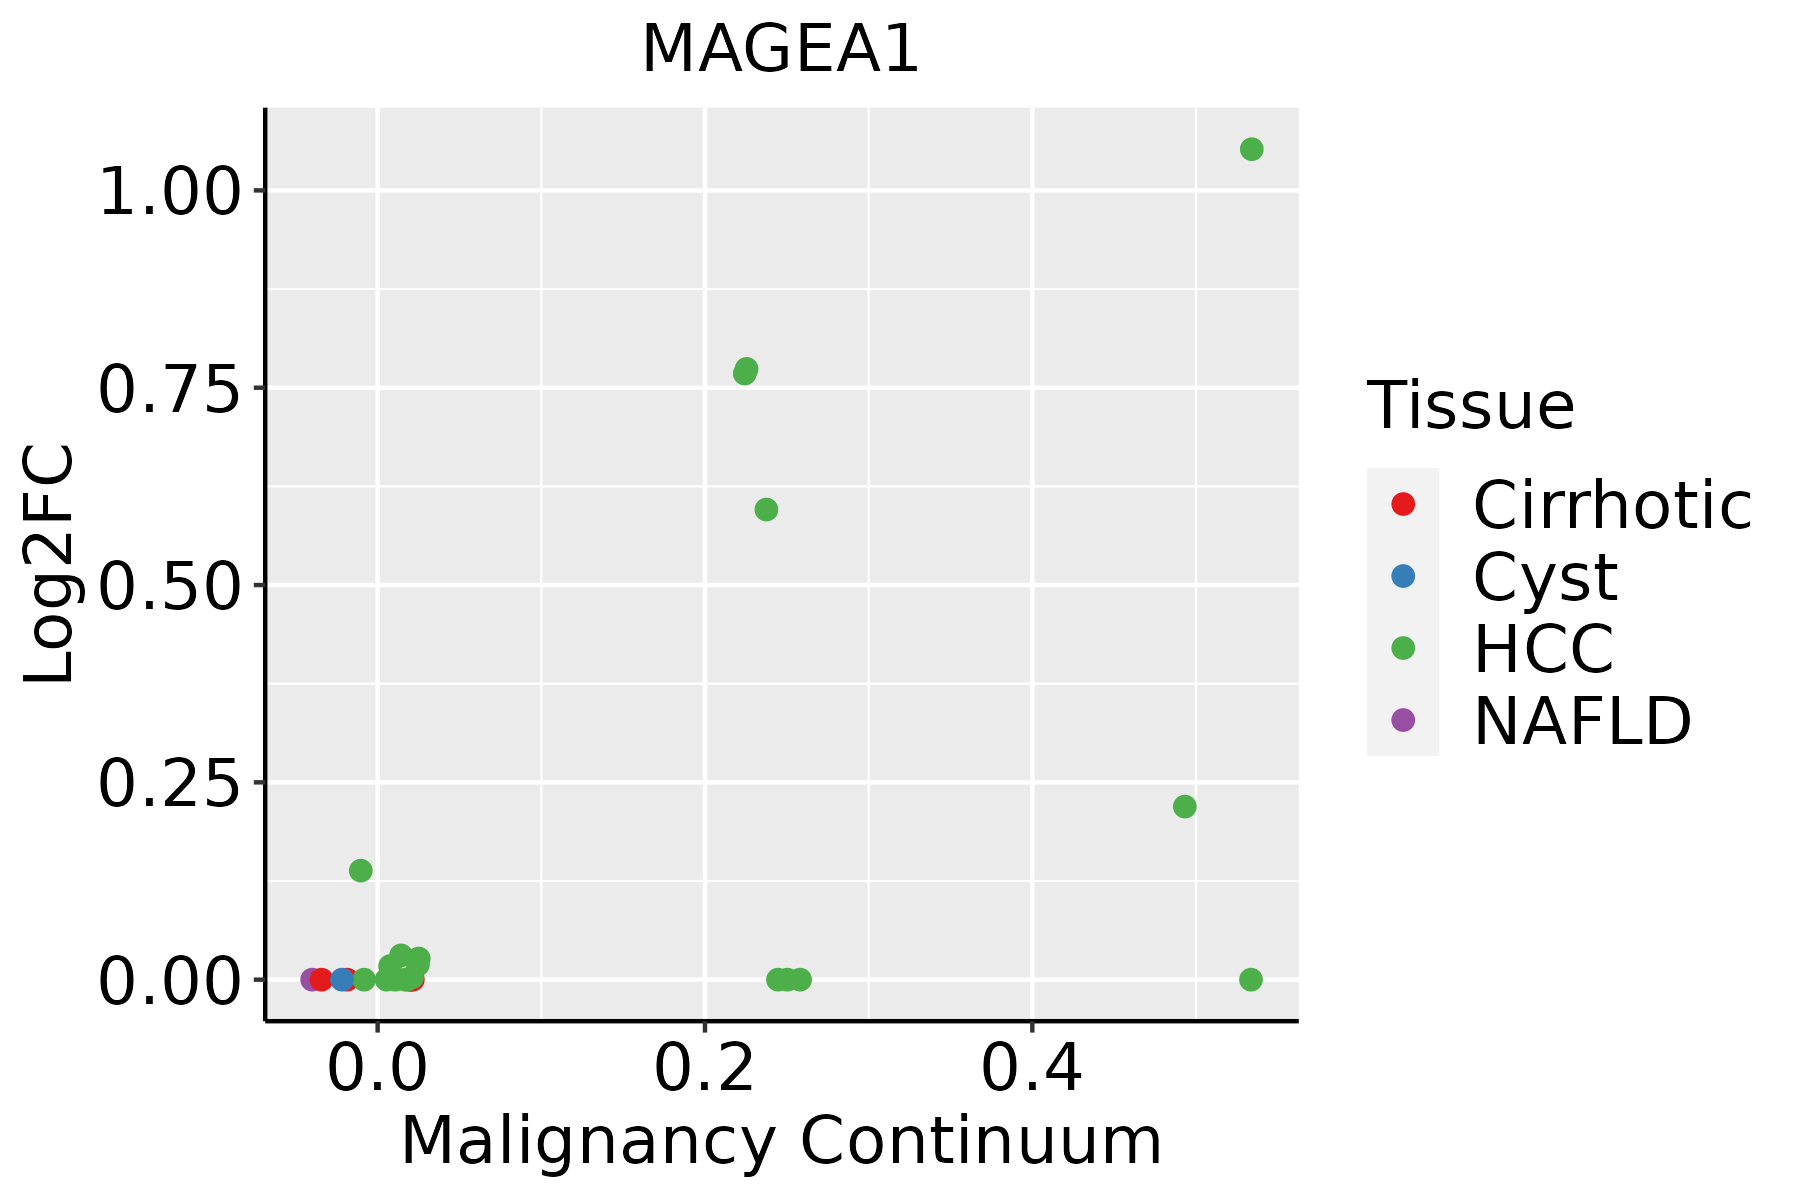 | HCC: Hepatocellular carcinoma |
| NAFLD: Non-alcoholic fatty liver disease | ||
| Oral Cavity |  | EOLP: Erosive Oral lichen planus |
| LP: leukoplakia | ||
| NEOLP: Non-erosive oral lichen planus | ||
| OSCC: Oral squamous cell carcinoma |
| ∗log2FC in expression of this searched gene in stem-like cells from each diseased tissue sample relative to stem-like cells in normal samples in each tissue plotted against the malignancy continuum. Samples are colored based on if they are from different disease stage. |
Top |
Malignant transformation related pathway analysis |
| Find out the enriched GO biological processes and KEGG pathways involved in transition from healthy to precancer to cancer |
| Tissue | Disease Stage | Enriched GO biological Processes |
| Colorectum | AD |  |
| Colorectum | SER |  |
| Colorectum | MSS |  |
| Colorectum | MSI-H |  |
| Colorectum | FAP |  |
| ∗Top 15 enriched GO BP terms are showed in the bar plot of each disease state in each tissue. Each row represents a significant GO biological process which is colored according to the -log10(p.adjust). |
| Page: 1 2 3 4 5 6 7 8 9 |
| GO ID | Tissue | Disease Stage | Description | Gene Ratio | Bg Ratio | pvalue | p.adjust | Count |
| GO:00072197 | Esophagus | ESCC | Notch signaling pathway | 106/8552 | 172/18723 | 1.74e-05 | 1.55e-04 | 106 |
| GO:0045746 | Esophagus | ESCC | negative regulation of Notch signaling pathway | 28/8552 | 36/18723 | 8.62e-05 | 6.22e-04 | 28 |
| GO:00085935 | Esophagus | ESCC | regulation of Notch signaling pathway | 59/8552 | 95/18723 | 9.12e-04 | 4.65e-03 | 59 |
| GO:00072196 | Oral cavity | OSCC | Notch signaling pathway | 92/7305 | 172/18723 | 7.84e-05 | 6.08e-04 | 92 |
| GO:00085934 | Oral cavity | OSCC | regulation of Notch signaling pathway | 53/7305 | 95/18723 | 6.64e-04 | 3.72e-03 | 53 |
| Page: 1 |
| Pathway ID | Tissue | Disease Stage | Description | Gene Ratio | Bg Ratio | pvalue | p.adjust | qvalue | Count |
| Page: 1 |
Top |
Cell-cell communication analysis |
| Identification of potential cell-cell interactions between two cell types and their ligand-receptor pairs for different disease states |
| Ligand | Receptor | LRpair | Pathway | Tissue | Disease Stage |
| Page: 1 |
Top |
Single-cell gene regulatory network inference analysis |
| Find out the significant the regulons (TFs) and the target genes of each regulon across cell types for different disease states |
| TF | Cell Type | Tissue | Disease Stage | Target Gene | RSS | Regulon Activity |
| ∗The dot plots of a searched regulon are shown for all cell subpopulations in each disease state of each tissue based on the regulon specific score inferred using pySCENIC and by calculating the average expression. |
| Page: 1 |
Top |
Somatic mutation of malignant transformation related genes |
| Annotation of somatic variants for genes involved in malignant transformation |
| Hugo Symbol | Variant Class | Variant Classification | dbSNP RS | HGVSc | HGVSp | HGVSp Short | SWISSPROT | BIOTYPE | SIFT | PolyPhen | Tumor Sample Barcode | Tissue | Histology | Sex | Age | Stage | Therapy Types | Drugs | Outcome |
| MAGEA1 | SNV | Missense_Mutation | c.836N>C | p.Val279Ala | p.V279A | P43355 | protein_coding | tolerated(0.06) | probably_damaging(0.986) | TCGA-A2-A04P-01 | Breast | breast invasive carcinoma | Female | <65 | III/IV | Chemotherapy | taxol | PD | |
| MAGEA1 | insertion | In_Frame_Ins | novel | c.882_883insAGGGAGCCT | p.Phe294_Pro295insArgGluPro | p.F294_P295insREP | P43355 | protein_coding | TCGA-B6-A0I6-01 | Breast | breast invasive carcinoma | Female | <65 | I/II | Unknown | Unknown | PD | ||
| MAGEA1 | SNV | Missense_Mutation | c.871N>T | p.Arg291Cys | p.R291C | P43355 | protein_coding | deleterious(0.03) | possibly_damaging(0.777) | TCGA-C5-A1BE-01 | Cervix | cervical & endocervical cancer | Female | <65 | I/II | Chemotherapy | cisplatin | PD | |
| MAGEA1 | SNV | Missense_Mutation | novel | c.631G>A | p.Glu211Lys | p.E211K | P43355 | protein_coding | deleterious(0.01) | probably_damaging(1) | TCGA-C5-A8YQ-01 | Cervix | cervical & endocervical cancer | Female | >=65 | I/II | Chemotherapy | cisplatin | PD |
| MAGEA1 | SNV | Missense_Mutation | novel | c.176N>G | p.Gln59Arg | p.Q59R | P43355 | protein_coding | deleterious(0.02) | benign(0.056) | TCGA-Q1-A5R1-01 | Cervix | cervical & endocervical cancer | Female | <65 | I/II | Unknown | Unknown | SD |
| MAGEA1 | SNV | Missense_Mutation | c.766N>A | p.Asp256Asn | p.D256N | P43355 | protein_coding | tolerated(1) | benign(0.109) | TCGA-A6-2685-01 | Colorectum | colon adenocarcinoma | Female | <65 | I/II | Unknown | Unknown | PD | |
| MAGEA1 | SNV | Missense_Mutation | c.381N>C | p.Glu127Asp | p.E127D | P43355 | protein_coding | tolerated(0.3) | probably_damaging(0.997) | TCGA-AA-3510-01 | Colorectum | colon adenocarcinoma | Male | >=65 | I/II | Unknown | Unknown | SD | |
| MAGEA1 | SNV | Missense_Mutation | c.332G>A | p.Gly111Asp | p.G111D | P43355 | protein_coding | tolerated(0.11) | benign(0.005) | TCGA-AY-6197-01 | Colorectum | colon adenocarcinoma | Male | <65 | I/II | Unknown | Unknown | SD | |
| MAGEA1 | SNV | Missense_Mutation | c.262C>G | p.Pro88Ala | p.P88A | P43355 | protein_coding | tolerated(0.08) | probably_damaging(0.984) | TCGA-CK-5916-01 | Colorectum | colon adenocarcinoma | Female | >=65 | I/II | Unknown | Unknown | PD | |
| MAGEA1 | SNV | Missense_Mutation | c.781N>T | p.Arg261Cys | p.R261C | P43355 | protein_coding | tolerated(0.1) | benign(0.01) | TCGA-DY-A1H8-01 | Colorectum | rectum adenocarcinoma | Female | >=65 | III/IV | Unknown | Unknown | SD |
| Page: 1 2 3 4 5 |
Top |
Related drugs of malignant transformation related genes |
| Identification of chemicals and drugs interact with genes involved in malignant transfromation |
| (DGIdb 4.0) |
| Entrez ID | Symbol | Category | Interaction Types | Drug Claim Name | Drug Name | PMIDs |
| 4100 | MAGEA1 | NA | ARA-C | 8749237 | ||
| 4100 | MAGEA1 | NA | 5-AZA-2-DEOXYCYTIDINE | 9247253 | ||
| 4100 | MAGEA1 | NA | 5-AZA-2&APOS;-DEOXYCYTIDINE | 8757382,15256472,7511051,8698626 | ||
| 4100 | MAGEA1 | NA | CAR-T cells targeting MAGE-A1 |
| Page: 1 |

Copyright 2023-Present -The University of Texas Health Science Center at Houston |