
|
|||||
|
 | |
| |
| |
| |
| |
| |
|
Gene: MAFG |
Gene summary for MAFG |
| Gene information | Species | Human | Gene symbol | MAFG | Gene ID | 4097 |
| Gene name | MAF bZIP transcription factor G | |
| Gene Alias | hMAF | |
| Cytomap | 17q25.3 | |
| Gene Type | protein-coding | GO ID | GO:0001701 | UniProtAcc | A0A024R8X1 |
Top |
Malignant transformation analysis |
| Identification of the aberrant gene expression in precancerous and cancerous lesions by comparing the gene expression of stem-like cells in diseased tissues with normal stem cells |
| Entrez ID | Symbol | Replicates | Species | Organ | Tissue | Adj P-value | Log2FC | Malignancy |
| 4097 | MAFG | HTA11_3410_2000001011 | Human | Colorectum | AD | 6.02e-07 | 2.13e-01 | 0.0155 |
| 4097 | MAFG | HTA11_2487_2000001011 | Human | Colorectum | SER | 9.60e-07 | 4.70e-01 | -0.1808 |
| 4097 | MAFG | HTA11_1938_2000001011 | Human | Colorectum | AD | 8.96e-08 | 5.24e-01 | -0.0811 |
| 4097 | MAFG | HTA11_78_2000001011 | Human | Colorectum | AD | 7.84e-04 | 2.69e-01 | -0.1088 |
| 4097 | MAFG | HTA11_347_2000001011 | Human | Colorectum | AD | 1.19e-07 | 3.04e-01 | -0.1954 |
| 4097 | MAFG | HTA11_411_2000001011 | Human | Colorectum | SER | 1.69e-03 | 7.44e-01 | -0.2602 |
| 4097 | MAFG | HTA11_3361_2000001011 | Human | Colorectum | AD | 2.63e-02 | 2.93e-01 | -0.1207 |
| 4097 | MAFG | HTA11_83_2000001011 | Human | Colorectum | SER | 1.66e-10 | 5.60e-01 | -0.1526 |
| 4097 | MAFG | HTA11_696_2000001011 | Human | Colorectum | AD | 2.78e-12 | 4.08e-01 | -0.1464 |
| 4097 | MAFG | HTA11_866_2000001011 | Human | Colorectum | AD | 1.29e-04 | 1.95e-01 | -0.1001 |
| 4097 | MAFG | HTA11_1391_2000001011 | Human | Colorectum | AD | 3.52e-10 | 4.32e-01 | -0.059 |
| 4097 | MAFG | HTA11_5212_2000001011 | Human | Colorectum | AD | 1.08e-02 | 3.46e-01 | -0.2061 |
| 4097 | MAFG | HTA11_7862_2000001011 | Human | Colorectum | AD | 1.60e-02 | 2.82e-01 | -0.0179 |
| 4097 | MAFG | HTA11_866_3004761011 | Human | Colorectum | AD | 1.18e-10 | 3.92e-01 | 0.096 |
| 4097 | MAFG | HTA11_8622_2000001021 | Human | Colorectum | SER | 4.26e-03 | 3.46e-01 | 0.0528 |
| 4097 | MAFG | HTA11_7696_3000711011 | Human | Colorectum | AD | 5.08e-06 | 2.36e-01 | 0.0674 |
| 4097 | MAFG | HTA11_6818_2000001011 | Human | Colorectum | AD | 3.26e-03 | 3.85e-01 | 0.0112 |
| 4097 | MAFG | HTA11_6818_2000001021 | Human | Colorectum | AD | 2.17e-03 | 3.31e-01 | 0.0588 |
| 4097 | MAFG | HTA11_99999970781_79442 | Human | Colorectum | MSS | 5.22e-20 | 5.86e-01 | 0.294 |
| 4097 | MAFG | HTA11_99999965062_69753 | Human | Colorectum | MSI-H | 1.06e-04 | 7.92e-01 | 0.3487 |
| Page: 1 2 3 4 5 6 7 |
| Tissue | Expression Dynamics | Abbreviation |
| Colorectum (GSE201348) |  | FAP: Familial adenomatous polyposis |
| CRC: Colorectal cancer | ||
| Colorectum (HTA11) |  | AD: Adenomas |
| SER: Sessile serrated lesions | ||
| MSI-H: Microsatellite-high colorectal cancer | ||
| MSS: Microsatellite stable colorectal cancer | ||
| Endometrium | 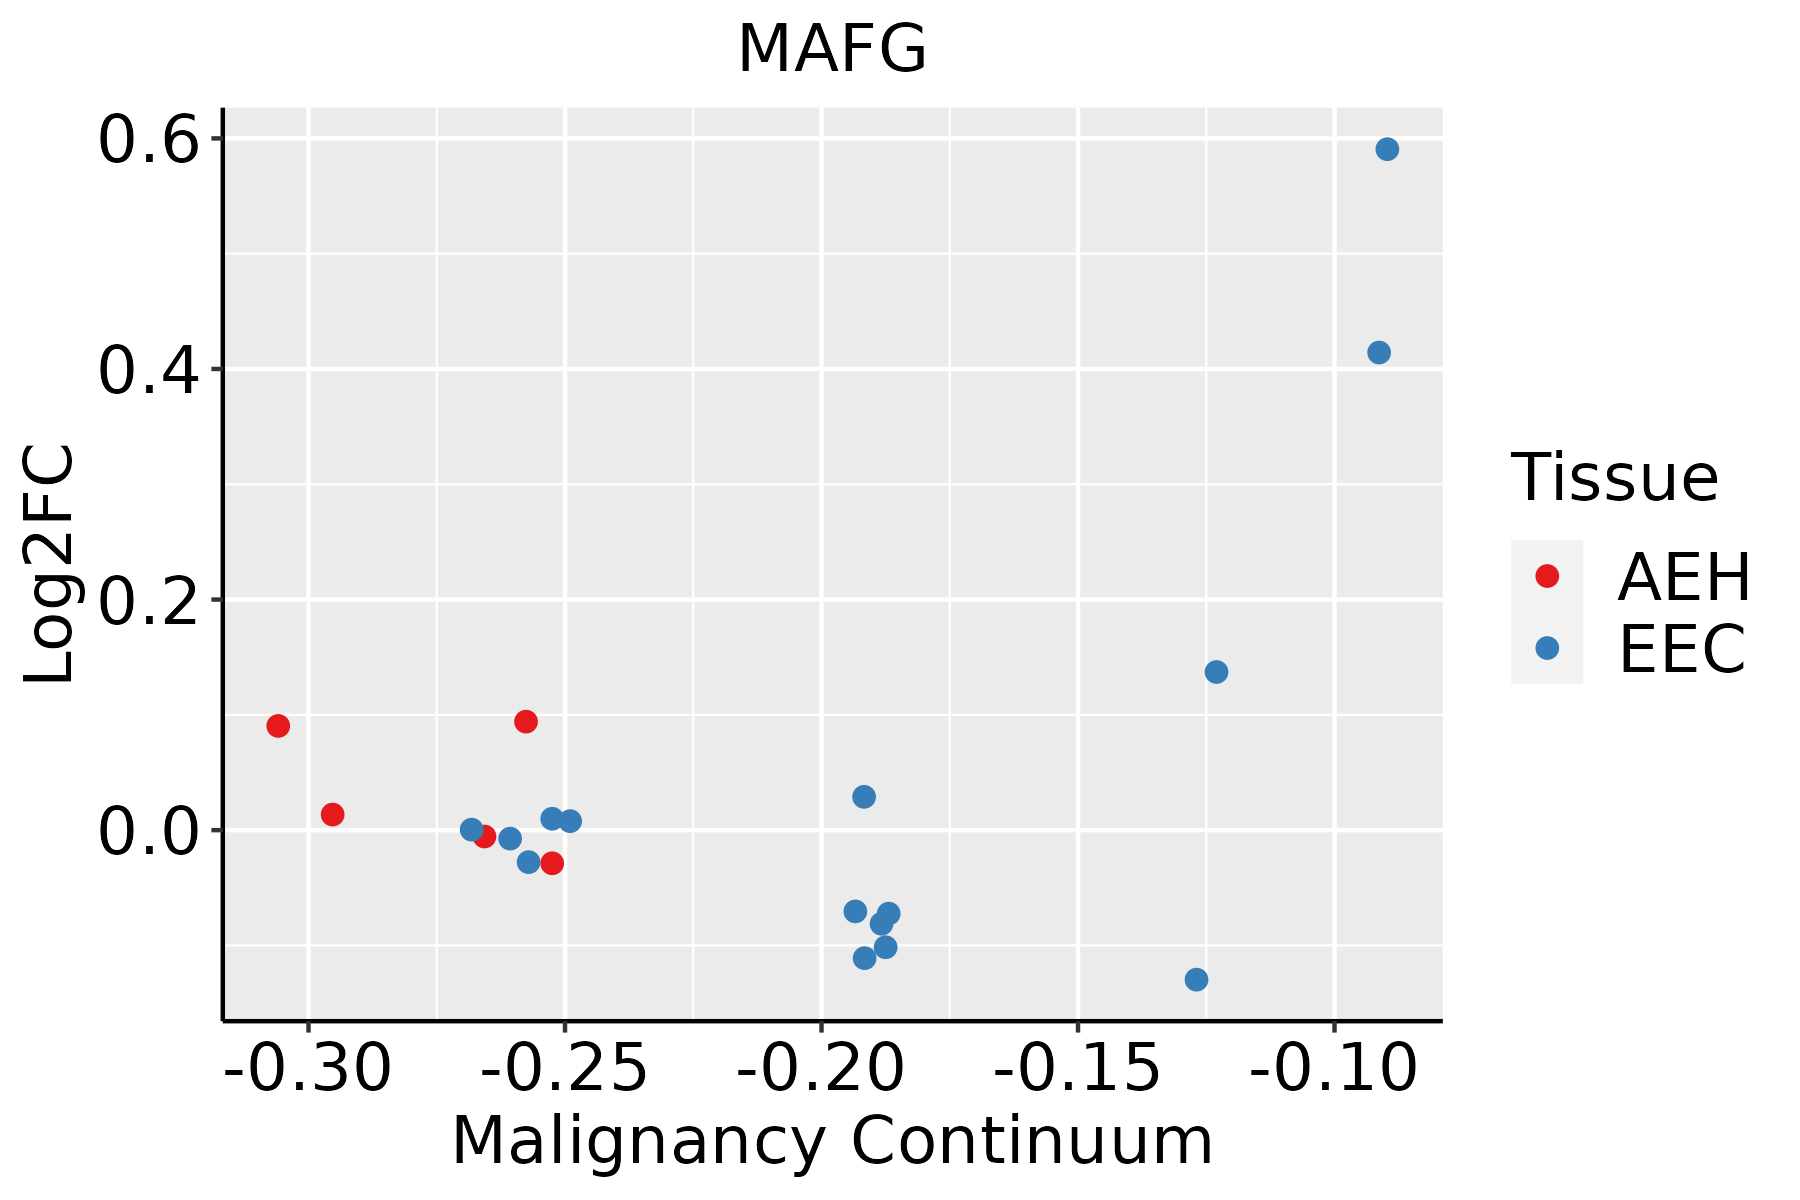 | AEH: Atypical endometrial hyperplasia |
| EEC: Endometrioid Cancer | ||
| Esophagus | 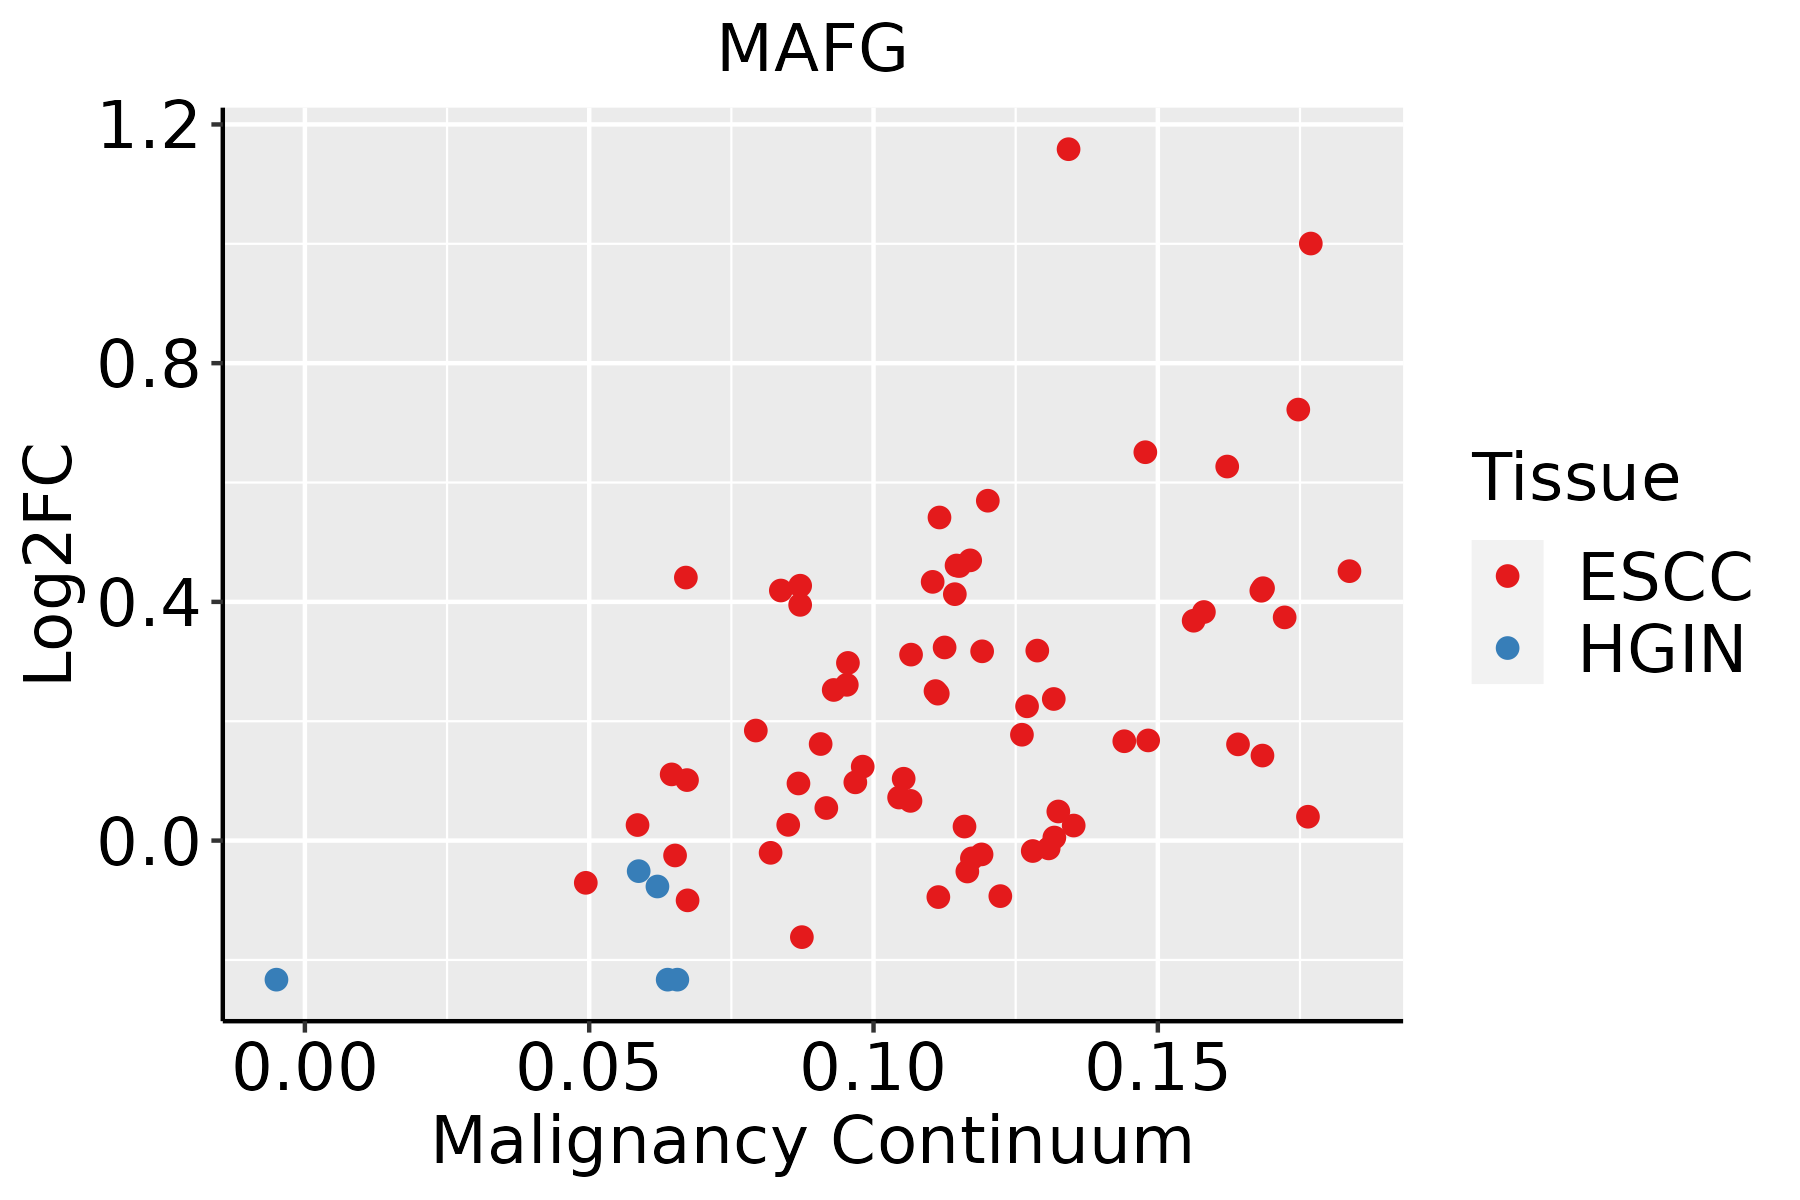 | ESCC: Esophageal squamous cell carcinoma |
| HGIN: High-grade intraepithelial neoplasias | ||
| LGIN: Low-grade intraepithelial neoplasias | ||
| Liver |  | HCC: Hepatocellular carcinoma |
| NAFLD: Non-alcoholic fatty liver disease | ||
| Oral Cavity |  | EOLP: Erosive Oral lichen planus |
| LP: leukoplakia | ||
| NEOLP: Non-erosive oral lichen planus | ||
| OSCC: Oral squamous cell carcinoma | ||
| Prostate | 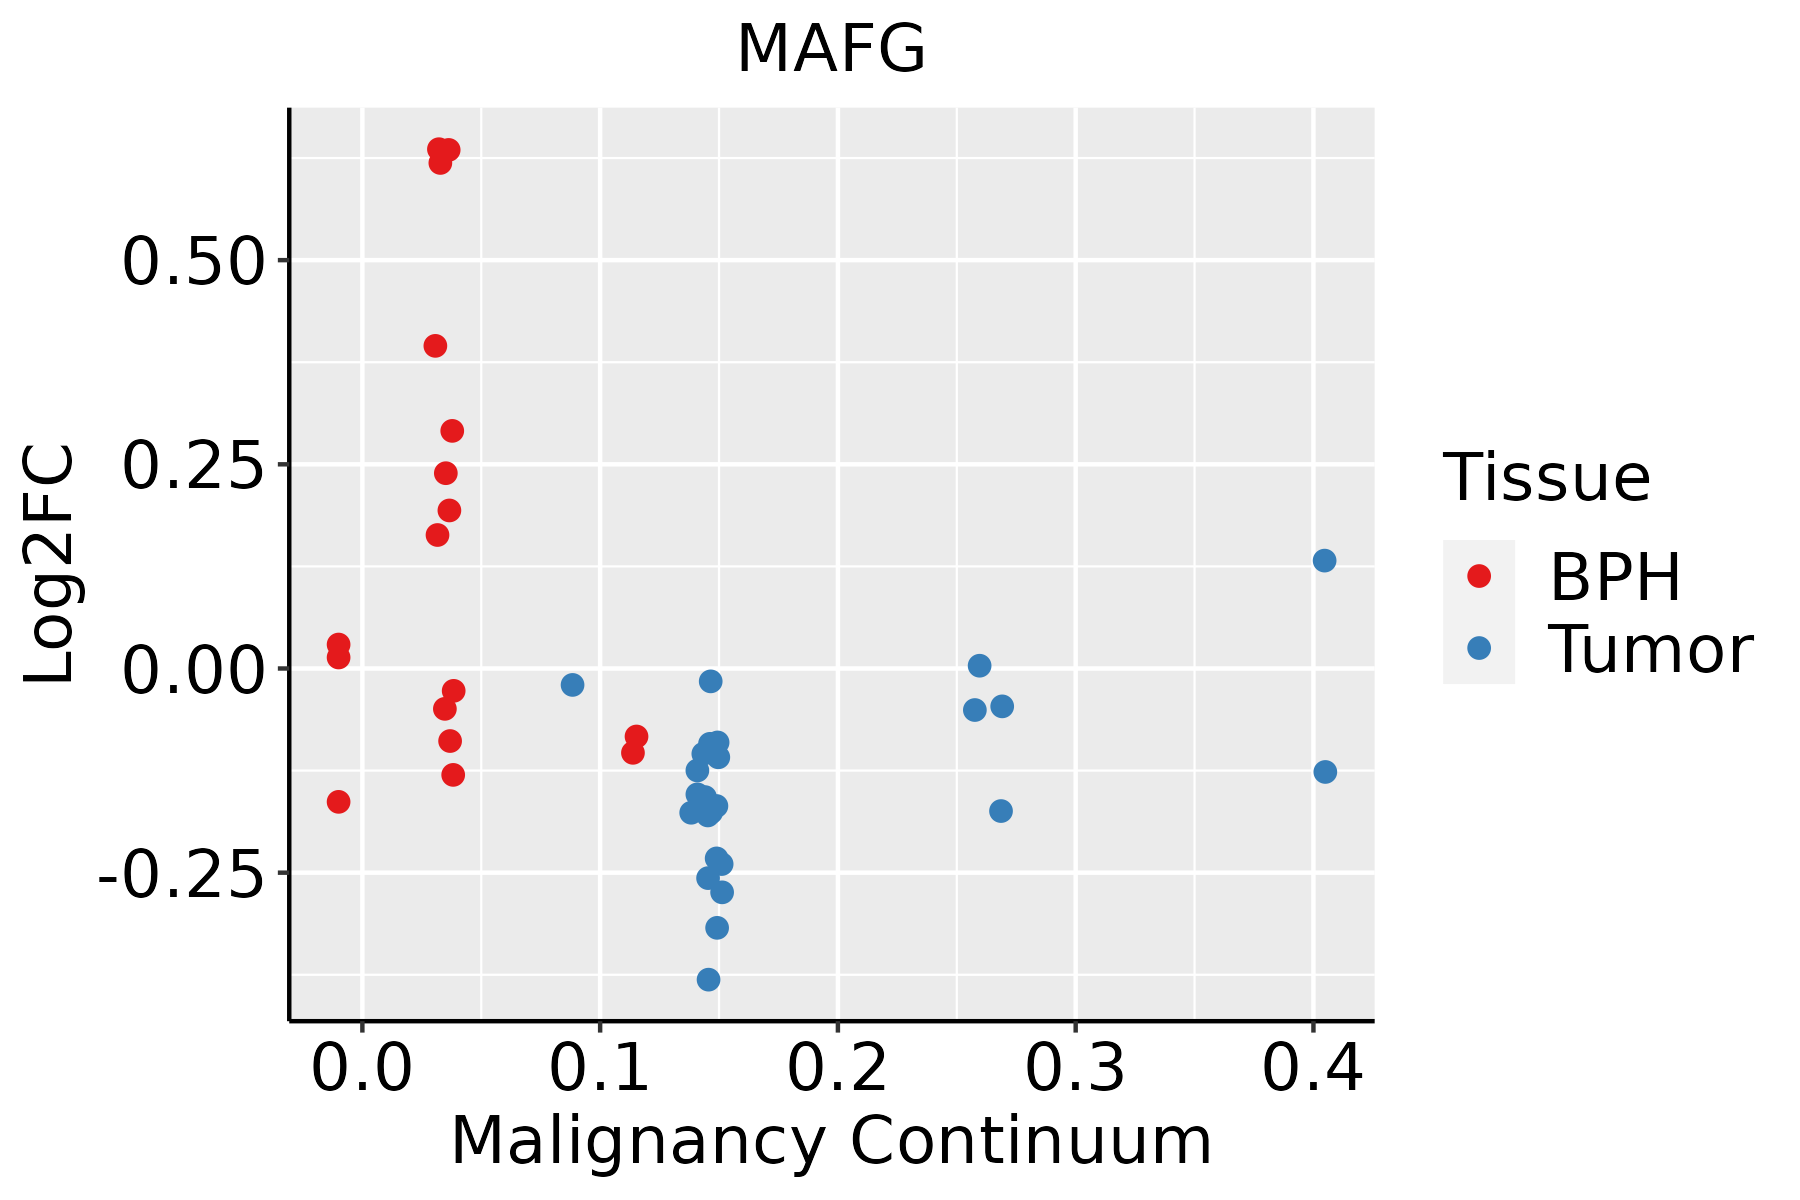 | BPH: Benign Prostatic Hyperplasia |
| Thyroid |  | ATC: Anaplastic thyroid cancer |
| HT: Hashimoto's thyroiditis | ||
| PTC: Papillary thyroid cancer |
| ∗log2FC in expression of this searched gene in stem-like cells from each diseased tissue sample relative to stem-like cells in normal samples in each tissue plotted against the malignancy continuum. Samples are colored based on if they are from different disease stage. |
Top |
Malignant transformation related pathway analysis |
| Find out the enriched GO biological processes and KEGG pathways involved in transition from healthy to precancer to cancer |
| Tissue | Disease Stage | Enriched GO biological Processes |
| Colorectum | AD |  |
| Colorectum | SER |  |
| Colorectum | MSS |  |
| Colorectum | MSI-H |  |
| Colorectum | FAP |  |
| ∗Top 15 enriched GO BP terms are showed in the bar plot of each disease state in each tissue. Each row represents a significant GO biological process which is colored according to the -log10(p.adjust). |
| Page: 1 2 3 4 5 6 7 8 9 |
| GO ID | Tissue | Disease Stage | Description | Gene Ratio | Bg Ratio | pvalue | p.adjust | Count |
| GO:0001701 | Colorectum | AD | in utero embryonic development | 110/3918 | 367/18723 | 2.36e-05 | 4.62e-04 | 110 |
| GO:0030004 | Colorectum | AD | cellular monovalent inorganic cation homeostasis | 36/3918 | 103/18723 | 6.80e-04 | 6.95e-03 | 36 |
| GO:0030641 | Colorectum | AD | regulation of cellular pH | 29/3918 | 81/18723 | 1.42e-03 | 1.22e-02 | 29 |
| GO:0006885 | Colorectum | AD | regulation of pH | 30/3918 | 91/18723 | 4.95e-03 | 3.32e-02 | 30 |
| GO:0009913 | Colorectum | AD | epidermal cell differentiation | 58/3918 | 202/18723 | 5.16e-03 | 3.42e-02 | 58 |
| GO:0008544 | Colorectum | AD | epidermis development | 87/3918 | 324/18723 | 5.99e-03 | 3.76e-02 | 87 |
| GO:0055067 | Colorectum | AD | monovalent inorganic cation homeostasis | 45/3918 | 151/18723 | 6.19e-03 | 3.88e-02 | 45 |
| GO:00300041 | Colorectum | SER | cellular monovalent inorganic cation homeostasis | 31/2897 | 103/18723 | 1.31e-04 | 2.66e-03 | 31 |
| GO:00306411 | Colorectum | SER | regulation of cellular pH | 24/2897 | 81/18723 | 9.20e-04 | 1.11e-02 | 24 |
| GO:00550671 | Colorectum | SER | monovalent inorganic cation homeostasis | 37/2897 | 151/18723 | 2.48e-03 | 2.33e-02 | 37 |
| GO:00017011 | Colorectum | SER | in utero embryonic development | 77/2897 | 367/18723 | 2.77e-03 | 2.48e-02 | 77 |
| GO:00068851 | Colorectum | SER | regulation of pH | 24/2897 | 91/18723 | 5.03e-03 | 3.88e-02 | 24 |
| GO:00017012 | Colorectum | MSS | in utero embryonic development | 99/3467 | 367/18723 | 3.71e-05 | 7.10e-04 | 99 |
| GO:00300042 | Colorectum | MSS | cellular monovalent inorganic cation homeostasis | 31/3467 | 103/18723 | 2.94e-03 | 2.27e-02 | 31 |
| GO:00306412 | Colorectum | MSS | regulation of cellular pH | 25/3467 | 81/18723 | 4.97e-03 | 3.46e-02 | 25 |
| GO:00099131 | Colorectum | MSS | epidermal cell differentiation | 52/3467 | 202/18723 | 6.59e-03 | 4.38e-02 | 52 |
| GO:00017019 | Endometrium | AEH | in utero embryonic development | 73/2100 | 367/18723 | 7.18e-07 | 2.63e-05 | 73 |
| GO:00308564 | Endometrium | AEH | regulation of epithelial cell differentiation | 33/2100 | 154/18723 | 1.81e-04 | 2.32e-03 | 33 |
| GO:00456823 | Endometrium | AEH | regulation of epidermis development | 16/2100 | 65/18723 | 1.81e-03 | 1.44e-02 | 16 |
| GO:00456043 | Endometrium | AEH | regulation of epidermal cell differentiation | 14/2100 | 58/18723 | 4.12e-03 | 2.73e-02 | 14 |
| Page: 1 2 3 |
| Pathway ID | Tissue | Disease Stage | Description | Gene Ratio | Bg Ratio | pvalue | p.adjust | qvalue | Count |
| Page: 1 |
Top |
Cell-cell communication analysis |
| Identification of potential cell-cell interactions between two cell types and their ligand-receptor pairs for different disease states |
| Ligand | Receptor | LRpair | Pathway | Tissue | Disease Stage |
| Page: 1 |
Top |
Single-cell gene regulatory network inference analysis |
| Find out the significant the regulons (TFs) and the target genes of each regulon across cell types for different disease states |
| TF | Cell Type | Tissue | Disease Stage | Target Gene | RSS | Regulon Activity |
| MAFG | MON | Colorectum | MSI-H | OGFR,SLC12A7,FUCA1, etc. | 5.11e-01 |  |
| MAFG | END | Colorectum | SER | CD320,ADAM15,RAMP3, etc. | 5.46e-01 |  |
| MAFG | MVA | Liver | HCC | DLG4,C17orf70,MIR24-2, etc. | 3.99e-01 |  |
| MAFG | PFIB | Liver | HCC | DLG4,C17orf70,MIR24-2, etc. | 1.59e-01 | |
| MAFG | MVA | Liver | Healthy | DLG4,C17orf70,MIR24-2, etc. | 5.21e-02 |  |
| MAFG | CAF | Stomach | CAG | GLTSCR2,NHP2L1,SLC25A48, etc. | 3.02e-01 |  |
| ∗The dot plots of a searched regulon are shown for all cell subpopulations in each disease state of each tissue based on the regulon specific score inferred using pySCENIC and by calculating the average expression. |
| Page: 1 |
Top |
Somatic mutation of malignant transformation related genes |
| Annotation of somatic variants for genes involved in malignant transformation |
| Hugo Symbol | Variant Class | Variant Classification | dbSNP RS | HGVSc | HGVSp | HGVSp Short | SWISSPROT | BIOTYPE | SIFT | PolyPhen | Tumor Sample Barcode | Tissue | Histology | Sex | Age | Stage | Therapy Types | Drugs | Outcome |
| MAFG | SNV | Missense_Mutation | novel | c.356N>A | p.Arg119Gln | p.R119Q | O15525 | protein_coding | deleterious(0.02) | benign(0.358) | TCGA-AX-A1C4-01 | Endometrium | uterine corpus endometrioid carcinoma | Female | <65 | I/II | Unknown | Unknown | SD |
| MAFG | SNV | Missense_Mutation | c.170G>A | p.Arg57His | p.R57H | O15525 | protein_coding | deleterious(0) | probably_damaging(0.998) | TCGA-B5-A3FC-01 | Endometrium | uterine corpus endometrioid carcinoma | Female | <65 | I/II | Unknown | Unknown | SD | |
| MAFG | SNV | Missense_Mutation | rs772676495 | c.81N>C | p.Glu27Asp | p.E27D | O15525 | protein_coding | tolerated(1) | benign(0.003) | TCGA-55-1595-01 | Lung | lung adenocarcinoma | Female | >=65 | I/II | Unknown | Unknown | SD |
| MAFG | SNV | Missense_Mutation | novel | c.44N>A | p.Arg15Gln | p.R15Q | O15525 | protein_coding | tolerated(0.13) | benign(0.081) | TCGA-MP-A4SW-01 | Lung | lung adenocarcinoma | Male | <65 | I/II | Unknown | Unknown | SD |
| Page: 1 |
Top |
Related drugs of malignant transformation related genes |
| Identification of chemicals and drugs interact with genes involved in malignant transfromation |
| (DGIdb 4.0) |
| Entrez ID | Symbol | Category | Interaction Types | Drug Claim Name | Drug Name | PMIDs |
| Page: 1 |

Copyright 2023-Present -The University of Texas Health Science Center at Houston |