
|
|||||
|
 | |
| |
| |
| |
| |
| |
|
Gene: MAFF |
Gene summary for MAFF |
| Gene information | Species | Human | Gene symbol | MAFF | Gene ID | 23764 |
| Gene name | MAF bZIP transcription factor F | |
| Gene Alias | U-MAF | |
| Cytomap | 22q13.1 | |
| Gene Type | protein-coding | GO ID | GO:0000003 | UniProtAcc | Q9ULX9 |
Top |
Malignant transformation analysis |
| Identification of the aberrant gene expression in precancerous and cancerous lesions by comparing the gene expression of stem-like cells in diseased tissues with normal stem cells |
| Entrez ID | Symbol | Replicates | Species | Organ | Tissue | Adj P-value | Log2FC | Malignancy |
| 23764 | MAFF | GSM4909281 | Human | Breast | IDC | 1.29e-07 | -3.99e-01 | 0.21 |
| 23764 | MAFF | GSM4909285 | Human | Breast | IDC | 5.54e-25 | -6.20e-01 | 0.21 |
| 23764 | MAFF | GSM4909286 | Human | Breast | IDC | 1.40e-06 | -3.36e-01 | 0.1081 |
| 23764 | MAFF | GSM4909290 | Human | Breast | IDC | 7.31e-18 | -6.13e-01 | 0.2096 |
| 23764 | MAFF | GSM4909291 | Human | Breast | IDC | 1.14e-06 | -4.62e-01 | 0.1753 |
| 23764 | MAFF | GSM4909294 | Human | Breast | IDC | 6.66e-25 | -5.95e-01 | 0.2022 |
| 23764 | MAFF | GSM4909296 | Human | Breast | IDC | 6.85e-29 | -5.98e-01 | 0.1524 |
| 23764 | MAFF | GSM4909297 | Human | Breast | IDC | 5.16e-16 | -3.93e-01 | 0.1517 |
| 23764 | MAFF | GSM4909298 | Human | Breast | IDC | 3.55e-16 | -5.22e-01 | 0.1551 |
| 23764 | MAFF | GSM4909299 | Human | Breast | IDC | 1.62e-02 | 2.45e-01 | 0.035 |
| 23764 | MAFF | GSM4909301 | Human | Breast | IDC | 6.42e-04 | -3.46e-01 | 0.1577 |
| 23764 | MAFF | GSM4909302 | Human | Breast | IDC | 1.31e-24 | -6.13e-01 | 0.1545 |
| 23764 | MAFF | GSM4909304 | Human | Breast | IDC | 1.61e-17 | -5.84e-01 | 0.1636 |
| 23764 | MAFF | GSM4909306 | Human | Breast | IDC | 1.06e-11 | -4.85e-01 | 0.1564 |
| 23764 | MAFF | GSM4909307 | Human | Breast | IDC | 4.55e-28 | -6.42e-01 | 0.1569 |
| 23764 | MAFF | GSM4909309 | Human | Breast | IDC | 3.08e-12 | -4.83e-01 | 0.0483 |
| 23764 | MAFF | GSM4909311 | Human | Breast | IDC | 8.81e-33 | -6.06e-01 | 0.1534 |
| 23764 | MAFF | GSM4909312 | Human | Breast | IDC | 2.60e-18 | -4.75e-01 | 0.1552 |
| 23764 | MAFF | GSM4909315 | Human | Breast | IDC | 3.26e-23 | -6.27e-01 | 0.21 |
| 23764 | MAFF | GSM4909316 | Human | Breast | IDC | 4.91e-10 | -6.32e-01 | 0.21 |
| Page: 1 2 3 4 5 6 7 8 9 |
| Tissue | Expression Dynamics | Abbreviation |
| Breast |  | IDC: Invasive ductal carcinoma |
| DCIS: Ductal carcinoma in situ | ||
| Precancer(BRCA1-mut): Precancerous lesion from BRCA1 mutation carriers | ||
| Cervix | 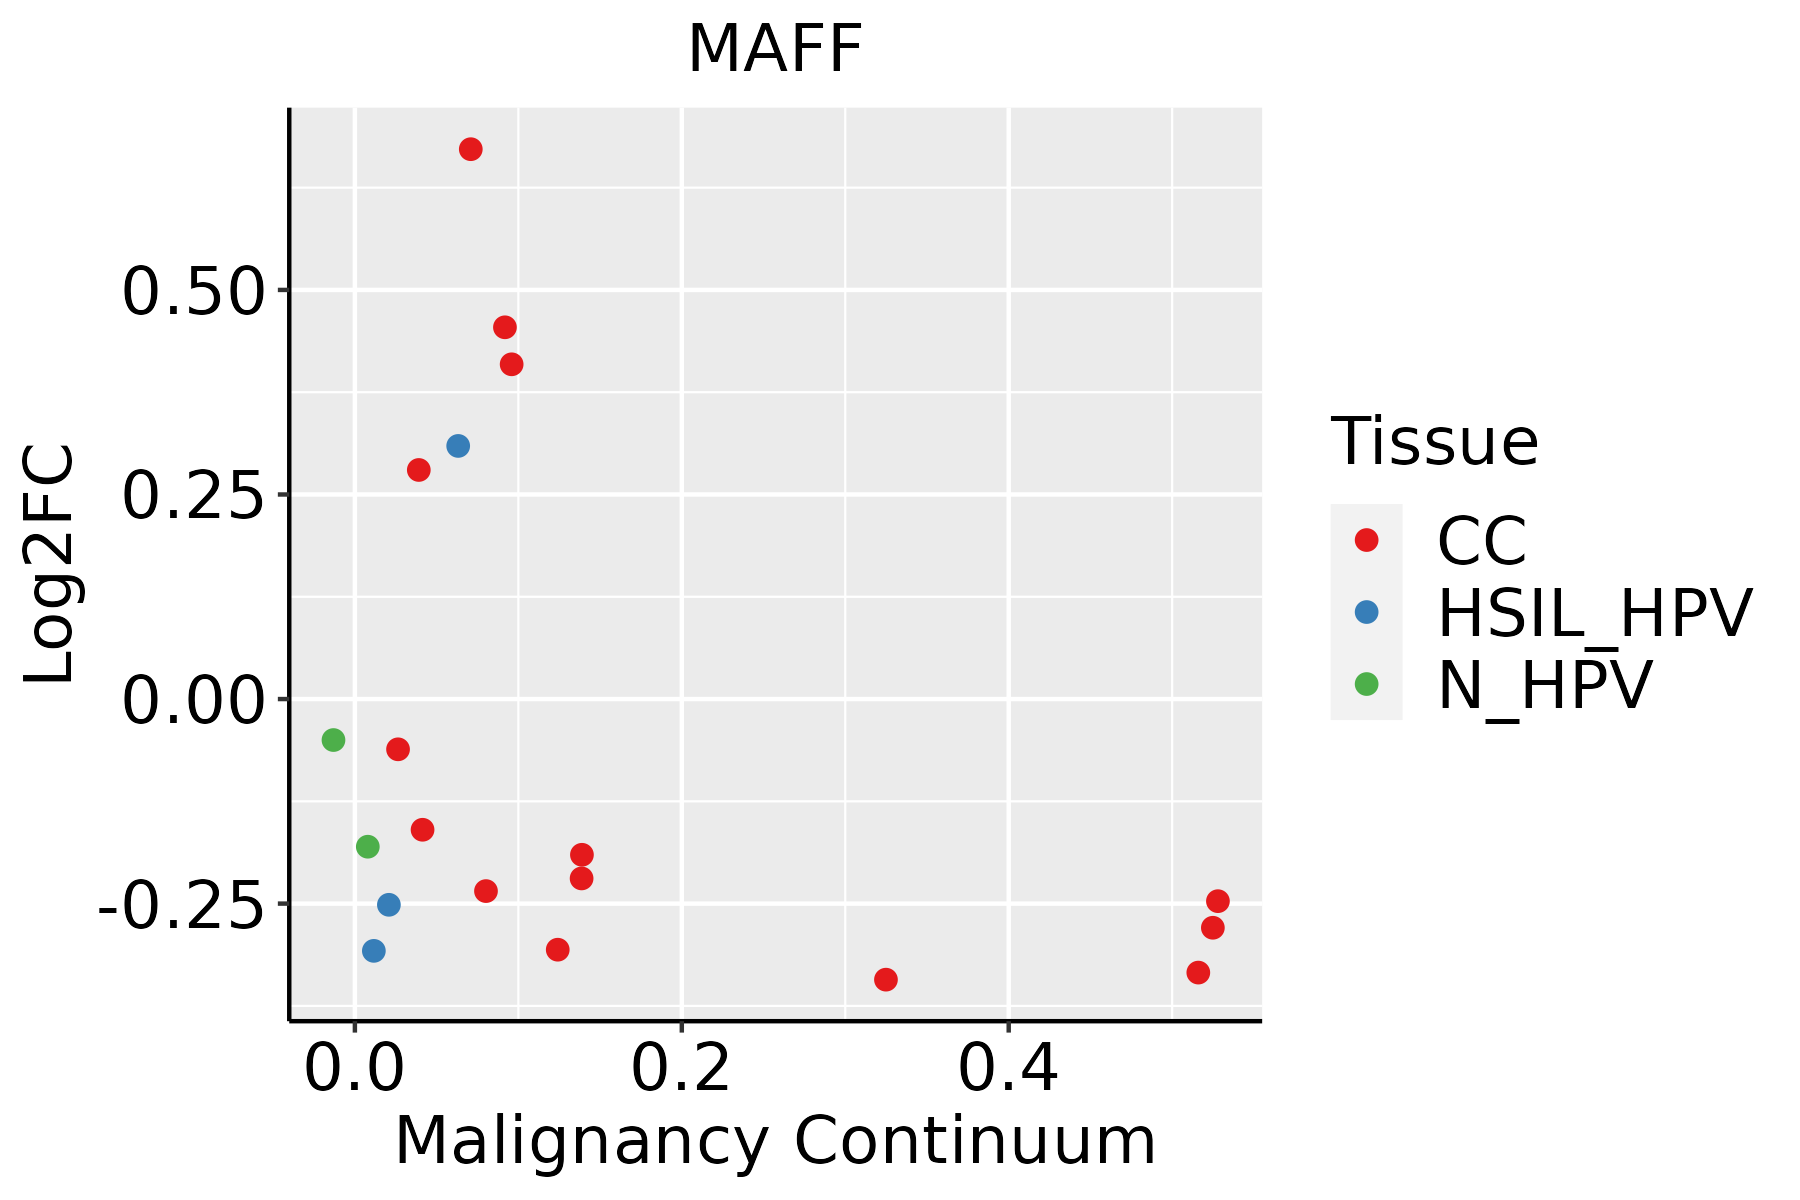 | CC: Cervix cancer |
| HSIL_HPV: HPV-infected high-grade squamous intraepithelial lesions | ||
| N_HPV: HPV-infected normal cervix | ||
| Esophagus | 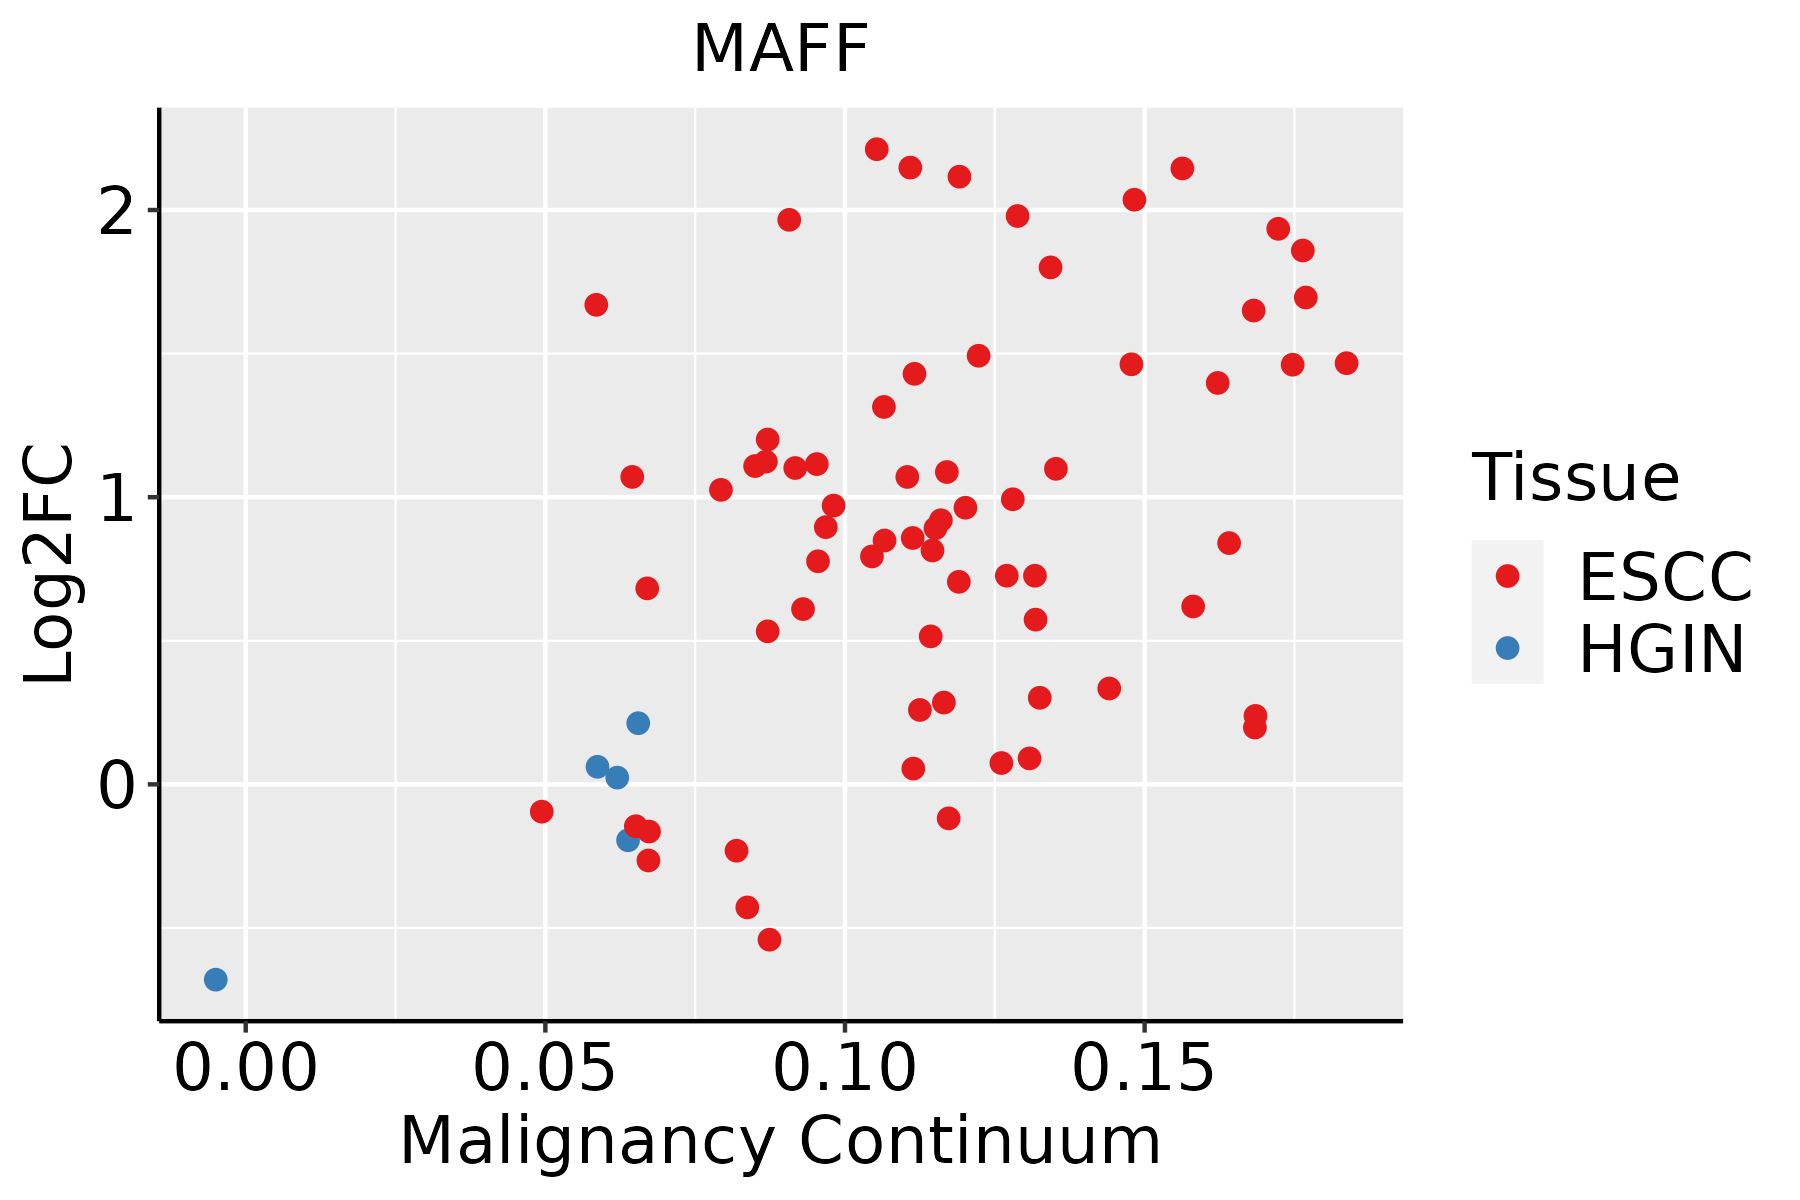 | ESCC: Esophageal squamous cell carcinoma |
| HGIN: High-grade intraepithelial neoplasias | ||
| LGIN: Low-grade intraepithelial neoplasias | ||
| Liver | 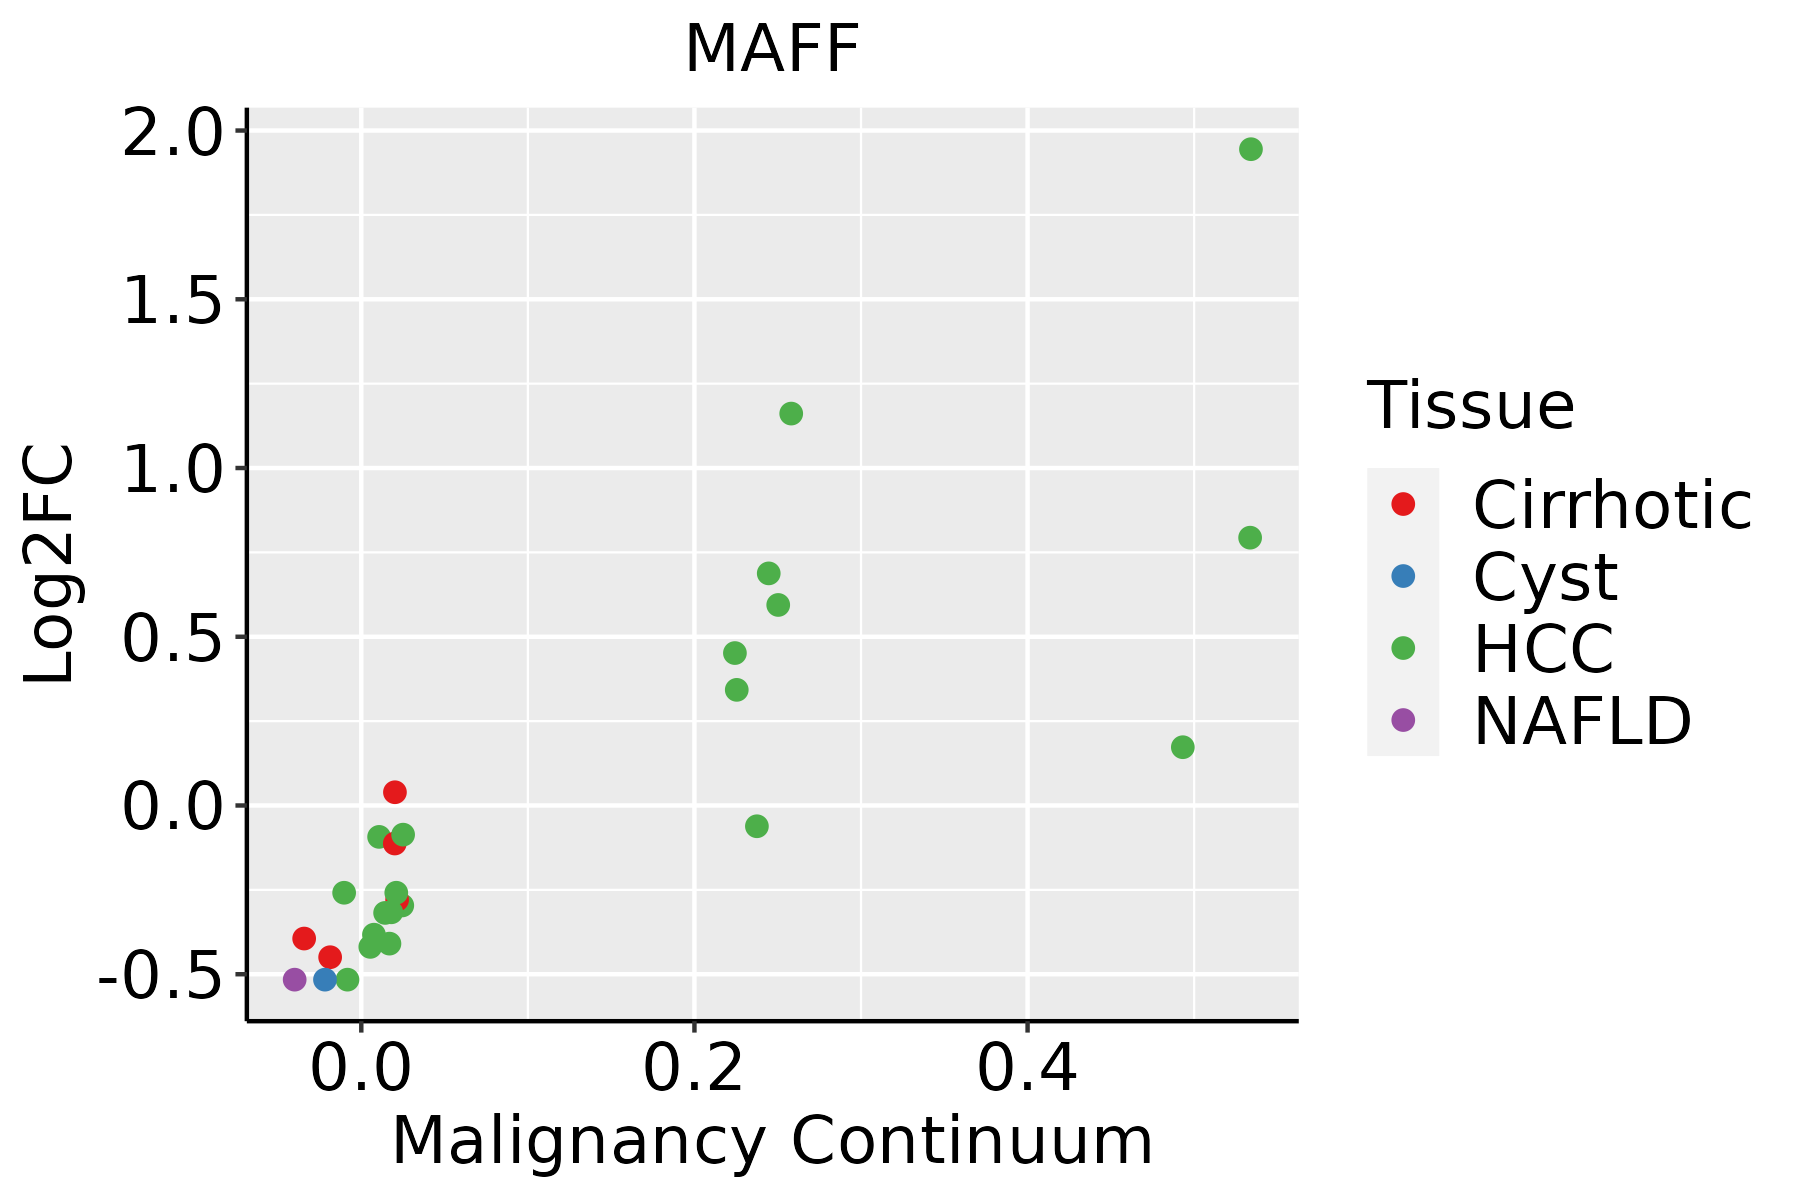 | HCC: Hepatocellular carcinoma |
| NAFLD: Non-alcoholic fatty liver disease | ||
| Oral Cavity | 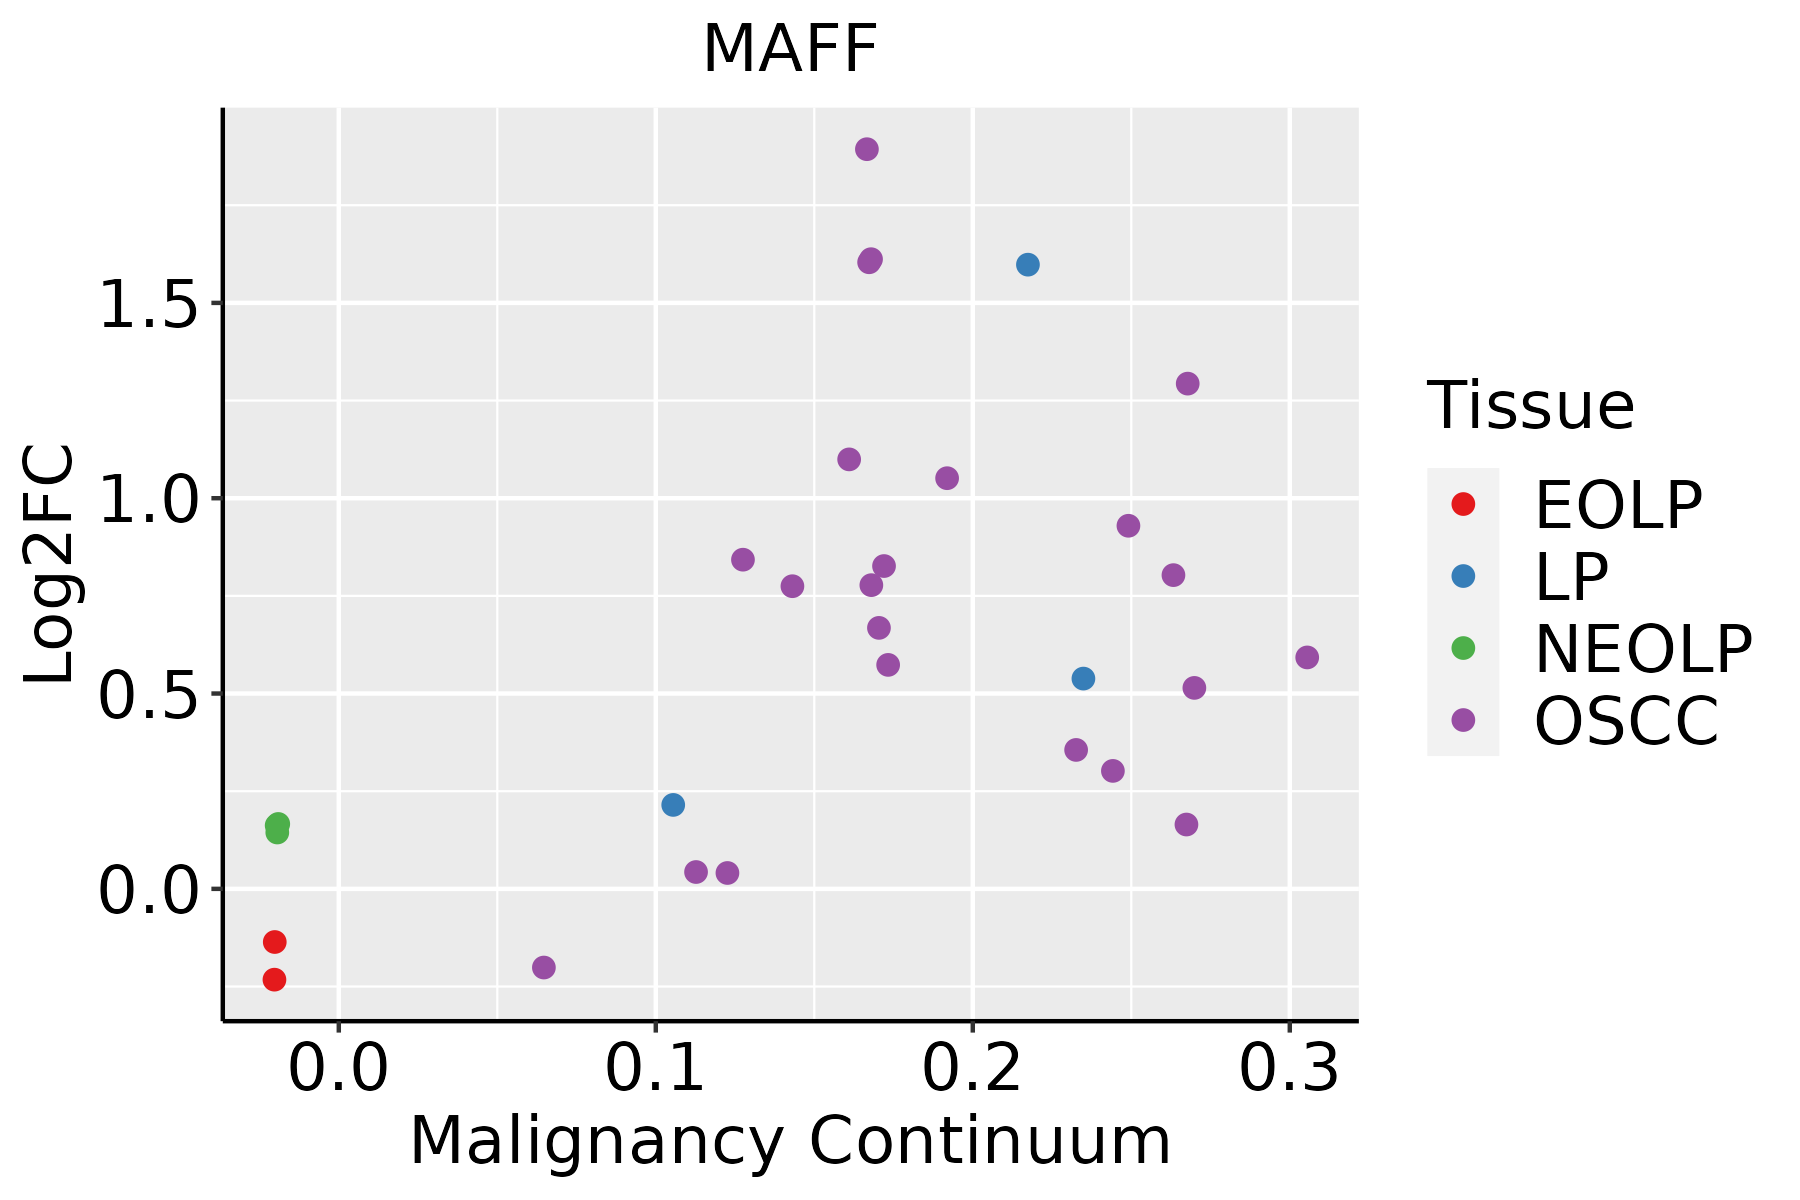 | EOLP: Erosive Oral lichen planus |
| LP: leukoplakia | ||
| NEOLP: Non-erosive oral lichen planus | ||
| OSCC: Oral squamous cell carcinoma | ||
| Prostate | 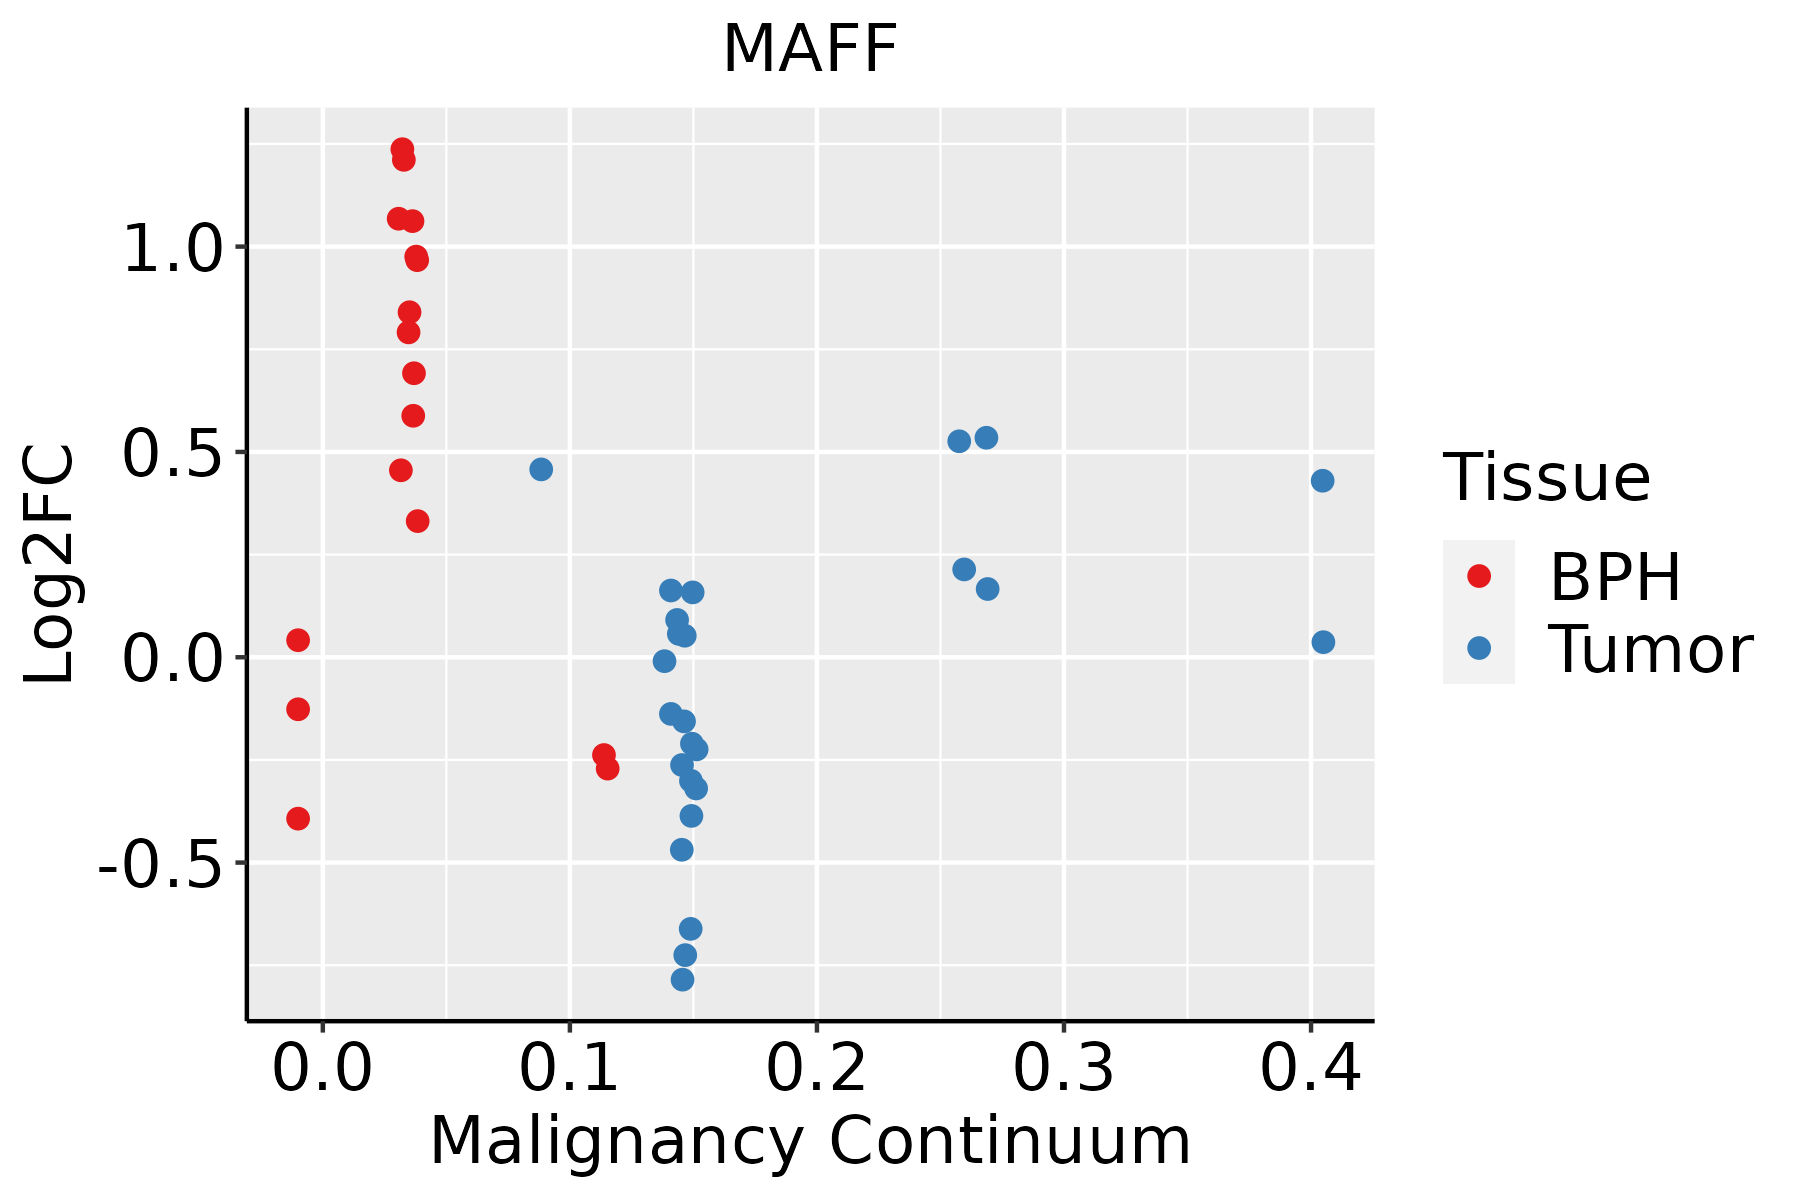 | BPH: Benign Prostatic Hyperplasia |
| Thyroid | 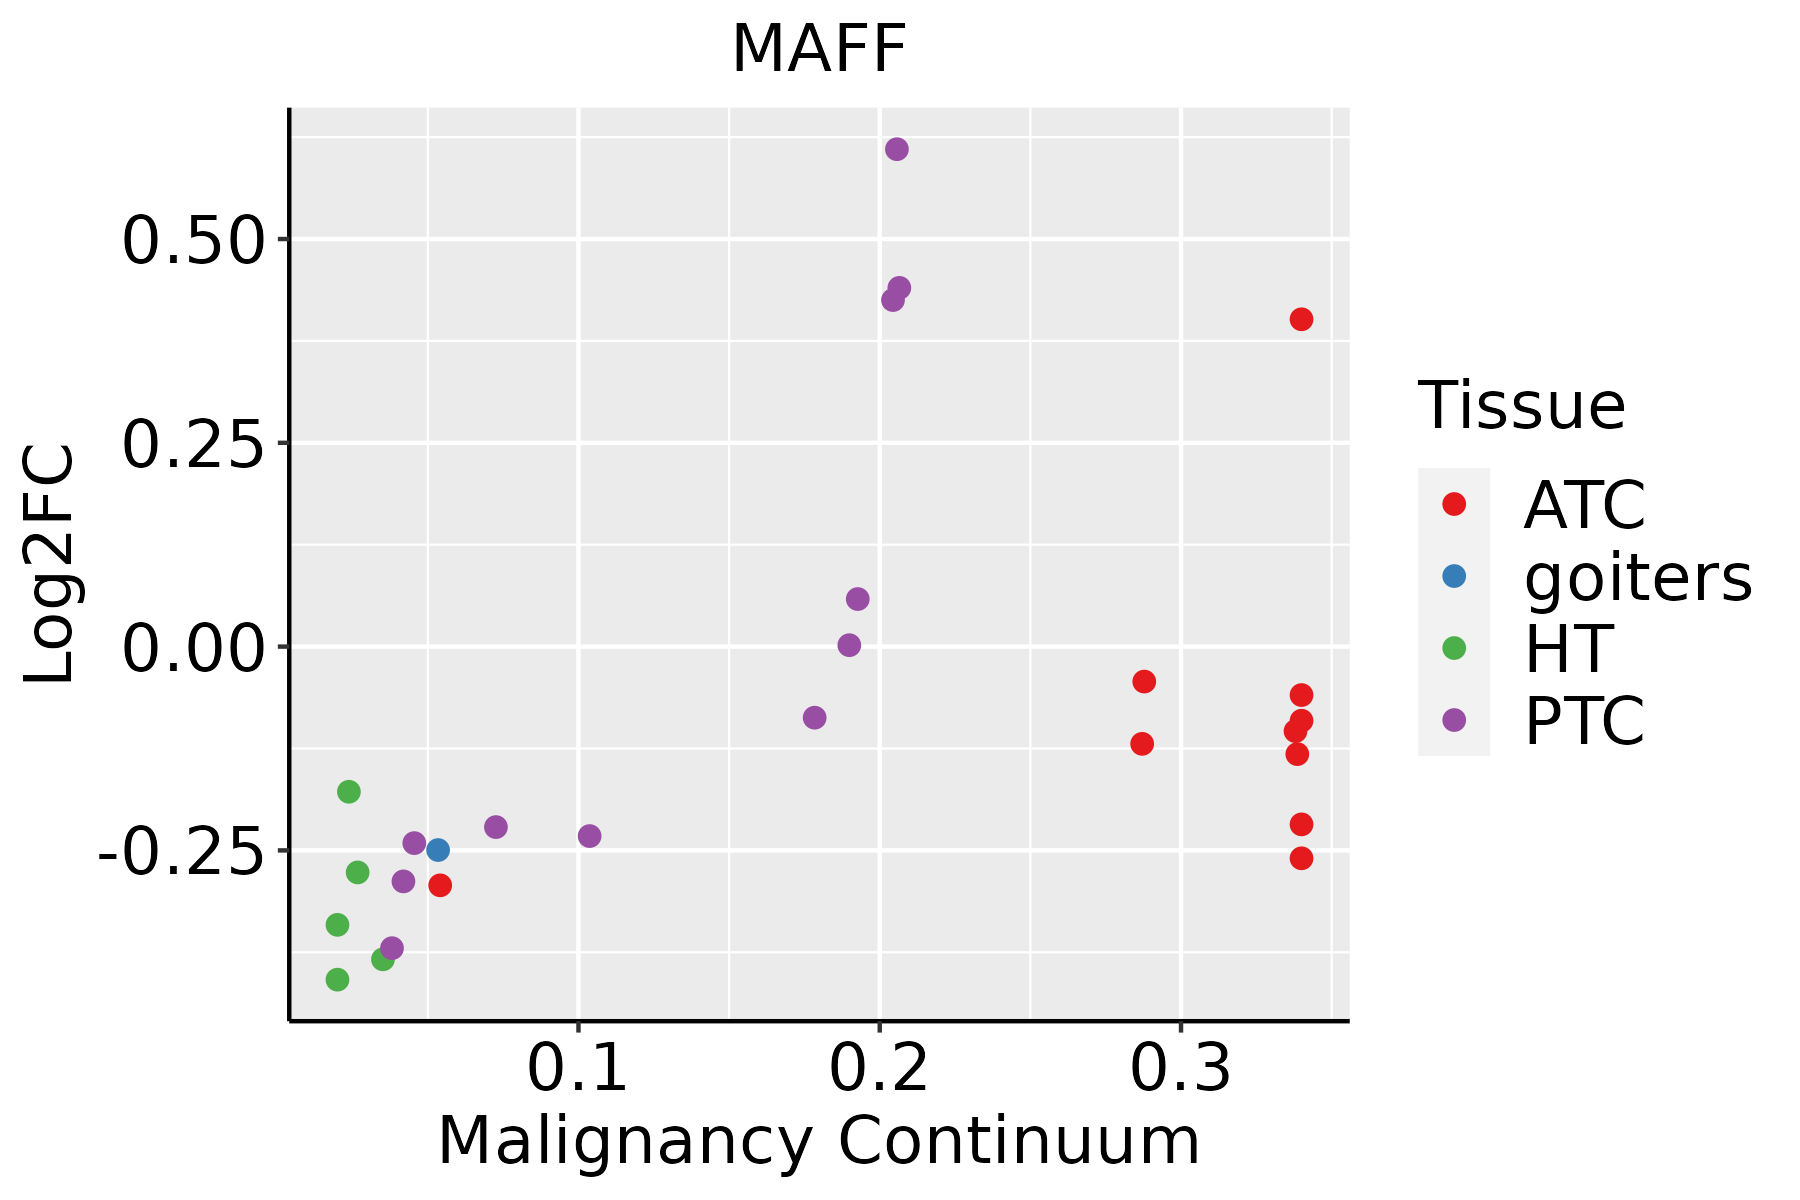 | ATC: Anaplastic thyroid cancer |
| HT: Hashimoto's thyroiditis | ||
| PTC: Papillary thyroid cancer |
| ∗log2FC in expression of this searched gene in stem-like cells from each diseased tissue sample relative to stem-like cells in normal samples in each tissue plotted against the malignancy continuum. Samples are colored based on if they are from different disease stage. |
Top |
Malignant transformation related pathway analysis |
| Find out the enriched GO biological processes and KEGG pathways involved in transition from healthy to precancer to cancer |
| Tissue | Disease Stage | Enriched GO biological Processes |
| Colorectum | AD |  |
| Colorectum | SER |  |
| Colorectum | MSS |  |
| Colorectum | MSI-H |  |
| Colorectum | FAP |  |
| ∗Top 15 enriched GO BP terms are showed in the bar plot of each disease state in each tissue. Each row represents a significant GO biological process which is colored according to the -log10(p.adjust). |
| Page: 1 2 3 4 5 6 7 8 9 |
| GO ID | Tissue | Disease Stage | Description | Gene Ratio | Bg Ratio | pvalue | p.adjust | Count |
| GO:00447063 | Breast | Precancer | multi-multicellular organism process | 31/1080 | 220/18723 | 3.73e-06 | 1.19e-04 | 31 |
| GO:00085445 | Breast | Precancer | epidermis development | 35/1080 | 324/18723 | 2.71e-04 | 3.96e-03 | 35 |
| GO:00099136 | Breast | Precancer | epidermal cell differentiation | 23/1080 | 202/18723 | 1.43e-03 | 1.50e-02 | 23 |
| GO:0035914 | Breast | Precancer | skeletal muscle cell differentiation | 11/1080 | 67/18723 | 1.47e-03 | 1.52e-02 | 11 |
| GO:00017017 | Breast | Precancer | in utero embryonic development | 35/1080 | 367/18723 | 2.47e-03 | 2.27e-02 | 35 |
| GO:00605374 | Breast | Precancer | muscle tissue development | 37/1080 | 403/18723 | 3.60e-03 | 2.98e-02 | 37 |
| GO:00147063 | Breast | Precancer | striated muscle tissue development | 35/1080 | 384/18723 | 5.10e-03 | 3.83e-02 | 35 |
| GO:00447061 | Breast | IDC | multi-multicellular organism process | 41/1434 | 220/18723 | 8.58e-08 | 5.19e-06 | 41 |
| GO:006053711 | Breast | IDC | muscle tissue development | 50/1434 | 403/18723 | 4.91e-04 | 6.45e-03 | 50 |
| GO:000854412 | Breast | IDC | epidermis development | 41/1434 | 324/18723 | 1.03e-03 | 1.14e-02 | 41 |
| GO:00359141 | Breast | IDC | skeletal muscle cell differentiation | 13/1434 | 67/18723 | 1.52e-03 | 1.52e-02 | 13 |
| GO:000991312 | Breast | IDC | epidermal cell differentiation | 28/1434 | 202/18723 | 1.62e-03 | 1.60e-02 | 28 |
| GO:00147061 | Breast | IDC | striated muscle tissue development | 46/1434 | 384/18723 | 1.67e-03 | 1.63e-02 | 46 |
| GO:000170113 | Breast | IDC | in utero embryonic development | 42/1434 | 367/18723 | 5.85e-03 | 4.24e-02 | 42 |
| GO:00075172 | Breast | IDC | muscle organ development | 38/1434 | 327/18723 | 6.63e-03 | 4.62e-02 | 38 |
| GO:00447062 | Breast | DCIS | multi-multicellular organism process | 39/1390 | 220/18723 | 3.05e-07 | 1.46e-05 | 39 |
| GO:006053721 | Breast | DCIS | muscle tissue development | 50/1390 | 403/18723 | 2.39e-04 | 3.74e-03 | 50 |
| GO:00147062 | Breast | DCIS | striated muscle tissue development | 46/1390 | 384/18723 | 8.88e-04 | 1.01e-02 | 46 |
| GO:000854422 | Breast | DCIS | epidermis development | 40/1390 | 324/18723 | 1.05e-03 | 1.16e-02 | 40 |
| GO:00359142 | Breast | DCIS | skeletal muscle cell differentiation | 13/1390 | 67/18723 | 1.14e-03 | 1.22e-02 | 13 |
| Page: 1 2 3 4 5 6 |
| Pathway ID | Tissue | Disease Stage | Description | Gene Ratio | Bg Ratio | pvalue | p.adjust | qvalue | Count |
| Page: 1 |
Top |
Cell-cell communication analysis |
| Identification of potential cell-cell interactions between two cell types and their ligand-receptor pairs for different disease states |
| Ligand | Receptor | LRpair | Pathway | Tissue | Disease Stage |
| Page: 1 |
Top |
Single-cell gene regulatory network inference analysis |
| Find out the significant the regulons (TFs) and the target genes of each regulon across cell types for different disease states |
| TF | Cell Type | Tissue | Disease Stage | Target Gene | RSS | Regulon Activity |
| MAFF | LC | Lung | AIS | PLA2G6,GPR183,AC009690.2, etc. | 2.91e-01 |  |
| MAFF | STM | Oral cavity | EOLP | ELF3,ITPKC,CSRNP1, etc. | 8.08e-01 |  |
| ∗The dot plots of a searched regulon are shown for all cell subpopulations in each disease state of each tissue based on the regulon specific score inferred using pySCENIC and by calculating the average expression. |
| Page: 1 |
Top |
Somatic mutation of malignant transformation related genes |
| Annotation of somatic variants for genes involved in malignant transformation |
| Hugo Symbol | Variant Class | Variant Classification | dbSNP RS | HGVSc | HGVSp | HGVSp Short | SWISSPROT | BIOTYPE | SIFT | PolyPhen | Tumor Sample Barcode | Tissue | Histology | Sex | Age | Stage | Therapy Types | Drugs | Outcome |
| MAFF | SNV | Missense_Mutation | novel | c.300G>A | p.Met100Ile | p.M100I | Q9ULX9 | protein_coding | deleterious(0.03) | benign(0.085) | TCGA-ZJ-AAXA-01 | Cervix | cervical & endocervical cancer | Female | <65 | I/II | Unknown | Unknown | SD |
| MAFF | SNV | Missense_Mutation | c.125N>A | p.Arg42His | p.R42H | Q9ULX9 | protein_coding | deleterious(0) | probably_damaging(0.999) | TCGA-AJ-A5DW-01 | Endometrium | uterine corpus endometrioid carcinoma | Female | <65 | I/II | Unknown | Unknown | SD | |
| MAFF | SNV | Missense_Mutation | novel | c.284G>A | p.Arg95His | p.R95H | Q9ULX9 | protein_coding | deleterious(0.03) | possibly_damaging(0.879) | TCGA-AP-A0LM-01 | Endometrium | uterine corpus endometrioid carcinoma | Female | <65 | III/IV | Chemotherapy | cisplatin | SD |
| MAFF | SNV | Missense_Mutation | novel | c.88N>G | p.Met30Val | p.M30V | Q9ULX9 | protein_coding | tolerated(1) | benign(0.027) | TCGA-BG-A222-01 | Endometrium | uterine corpus endometrioid carcinoma | Female | <65 | I/II | Unknown | Unknown | SD |
| MAFF | SNV | Missense_Mutation | c.208G>A | p.Val70Met | p.V70M | Q9ULX9 | protein_coding | deleterious(0.04) | probably_damaging(0.974) | TCGA-DF-A2KU-01 | Endometrium | uterine corpus endometrioid carcinoma | Female | Unknown | I/II | Unknown | Unknown | SD | |
| MAFF | SNV | Missense_Mutation | novel | c.103N>T | p.Arg35Cys | p.R35C | Q9ULX9 | protein_coding | deleterious(0) | probably_damaging(1) | TCGA-FI-A2D5-01 | Endometrium | uterine corpus endometrioid carcinoma | Female | <65 | III/IV | Chemotherapy | carboplatinum | PD |
| MAFF | SNV | Missense_Mutation | rs377667070 | c.19N>C | p.Ser7Pro | p.S7P | Q9ULX9 | protein_coding | tolerated(0.25) | benign(0.003) | TCGA-J9-A52E-01 | Prostate | prostate adenocarcinoma | Male | >=65 | 9 | Hormone Therapy | zoladex | SD |
| MAFF | SNV | Missense_Mutation | c.208N>A | p.Val70Met | p.V70M | Q9ULX9 | protein_coding | deleterious(0.04) | probably_damaging(0.974) | TCGA-BR-8372-01 | Stomach | stomach adenocarcinoma | Male | <65 | III/IV | Chemotherapy | etoposide | CR |
| Page: 1 |
Top |
Related drugs of malignant transformation related genes |
| Identification of chemicals and drugs interact with genes involved in malignant transfromation |
| (DGIdb 4.0) |
| Entrez ID | Symbol | Category | Interaction Types | Drug Claim Name | Drug Name | PMIDs |
| Page: 1 |

Copyright 2023-Present -The University of Texas Health Science Center at Houston |