
|
|||||
|
 | |
| |
| |
| |
| |
| |
|
Gene: MAF1 |
Gene summary for MAF1 |
| Gene information | Species | Human | Gene symbol | MAF1 | Gene ID | 84232 |
| Gene name | MAF1 homolog, negative regulator of RNA polymerase III | |
| Gene Alias | MAF1 | |
| Cytomap | 8q24.3 | |
| Gene Type | protein-coding | GO ID | GO:0006139 | UniProtAcc | Q9H063 |
Top |
Malignant transformation analysis |
| Identification of the aberrant gene expression in precancerous and cancerous lesions by comparing the gene expression of stem-like cells in diseased tissues with normal stem cells |
| Entrez ID | Symbol | Replicates | Species | Organ | Tissue | Adj P-value | Log2FC | Malignancy |
| 84232 | MAF1 | HTA11_3410_2000001011 | Human | Colorectum | AD | 1.09e-03 | 1.34e-01 | 0.0155 |
| 84232 | MAF1 | HTA11_2487_2000001011 | Human | Colorectum | SER | 7.87e-08 | 2.35e-01 | -0.1808 |
| 84232 | MAF1 | HTA11_2951_2000001011 | Human | Colorectum | AD | 2.71e-02 | 2.40e-01 | 0.0216 |
| 84232 | MAF1 | HTA11_1938_2000001011 | Human | Colorectum | AD | 7.76e-08 | 3.00e-01 | -0.0811 |
| 84232 | MAF1 | HTA11_78_2000001011 | Human | Colorectum | AD | 4.16e-05 | 2.09e-01 | -0.1088 |
| 84232 | MAF1 | HTA11_347_2000001011 | Human | Colorectum | AD | 1.01e-10 | 3.00e-01 | -0.1954 |
| 84232 | MAF1 | HTA11_411_2000001011 | Human | Colorectum | SER | 8.89e-07 | 4.65e-01 | -0.2602 |
| 84232 | MAF1 | HTA11_3361_2000001011 | Human | Colorectum | AD | 3.88e-06 | 3.30e-01 | -0.1207 |
| 84232 | MAF1 | HTA11_83_2000001011 | Human | Colorectum | SER | 2.07e-03 | 2.57e-01 | -0.1526 |
| 84232 | MAF1 | HTA11_696_2000001011 | Human | Colorectum | AD | 6.00e-07 | 2.62e-01 | -0.1464 |
| 84232 | MAF1 | HTA11_866_2000001011 | Human | Colorectum | AD | 1.47e-05 | 1.92e-01 | -0.1001 |
| 84232 | MAF1 | HTA11_1391_2000001011 | Human | Colorectum | AD | 1.21e-14 | 4.12e-01 | -0.059 |
| 84232 | MAF1 | HTA11_2992_2000001011 | Human | Colorectum | SER | 6.23e-03 | 3.16e-01 | -0.1706 |
| 84232 | MAF1 | HTA11_546_2000001011 | Human | Colorectum | AD | 1.86e-05 | 3.48e-01 | -0.0842 |
| 84232 | MAF1 | HTA11_866_3004761011 | Human | Colorectum | AD | 5.53e-09 | 1.77e-01 | 0.096 |
| 84232 | MAF1 | HTA11_9408_2000001011 | Human | Colorectum | AD | 6.67e-04 | 3.64e-01 | 0.0451 |
| 84232 | MAF1 | HTA11_7663_2000001011 | Human | Colorectum | SER | 2.45e-03 | 3.43e-01 | 0.0131 |
| 84232 | MAF1 | HTA11_10623_2000001011 | Human | Colorectum | AD | 7.54e-03 | 2.23e-01 | -0.0177 |
| 84232 | MAF1 | HTA11_10711_2000001011 | Human | Colorectum | AD | 4.30e-07 | 2.97e-01 | 0.0338 |
| 84232 | MAF1 | HTA11_7696_3000711011 | Human | Colorectum | AD | 7.30e-04 | 1.66e-01 | 0.0674 |
| Page: 1 2 3 4 5 6 7 8 |
| Tissue | Expression Dynamics | Abbreviation |
| Colorectum (GSE201348) |  | FAP: Familial adenomatous polyposis |
| CRC: Colorectal cancer | ||
| Colorectum (HTA11) |  | AD: Adenomas |
| SER: Sessile serrated lesions | ||
| MSI-H: Microsatellite-high colorectal cancer | ||
| MSS: Microsatellite stable colorectal cancer | ||
| Esophagus | 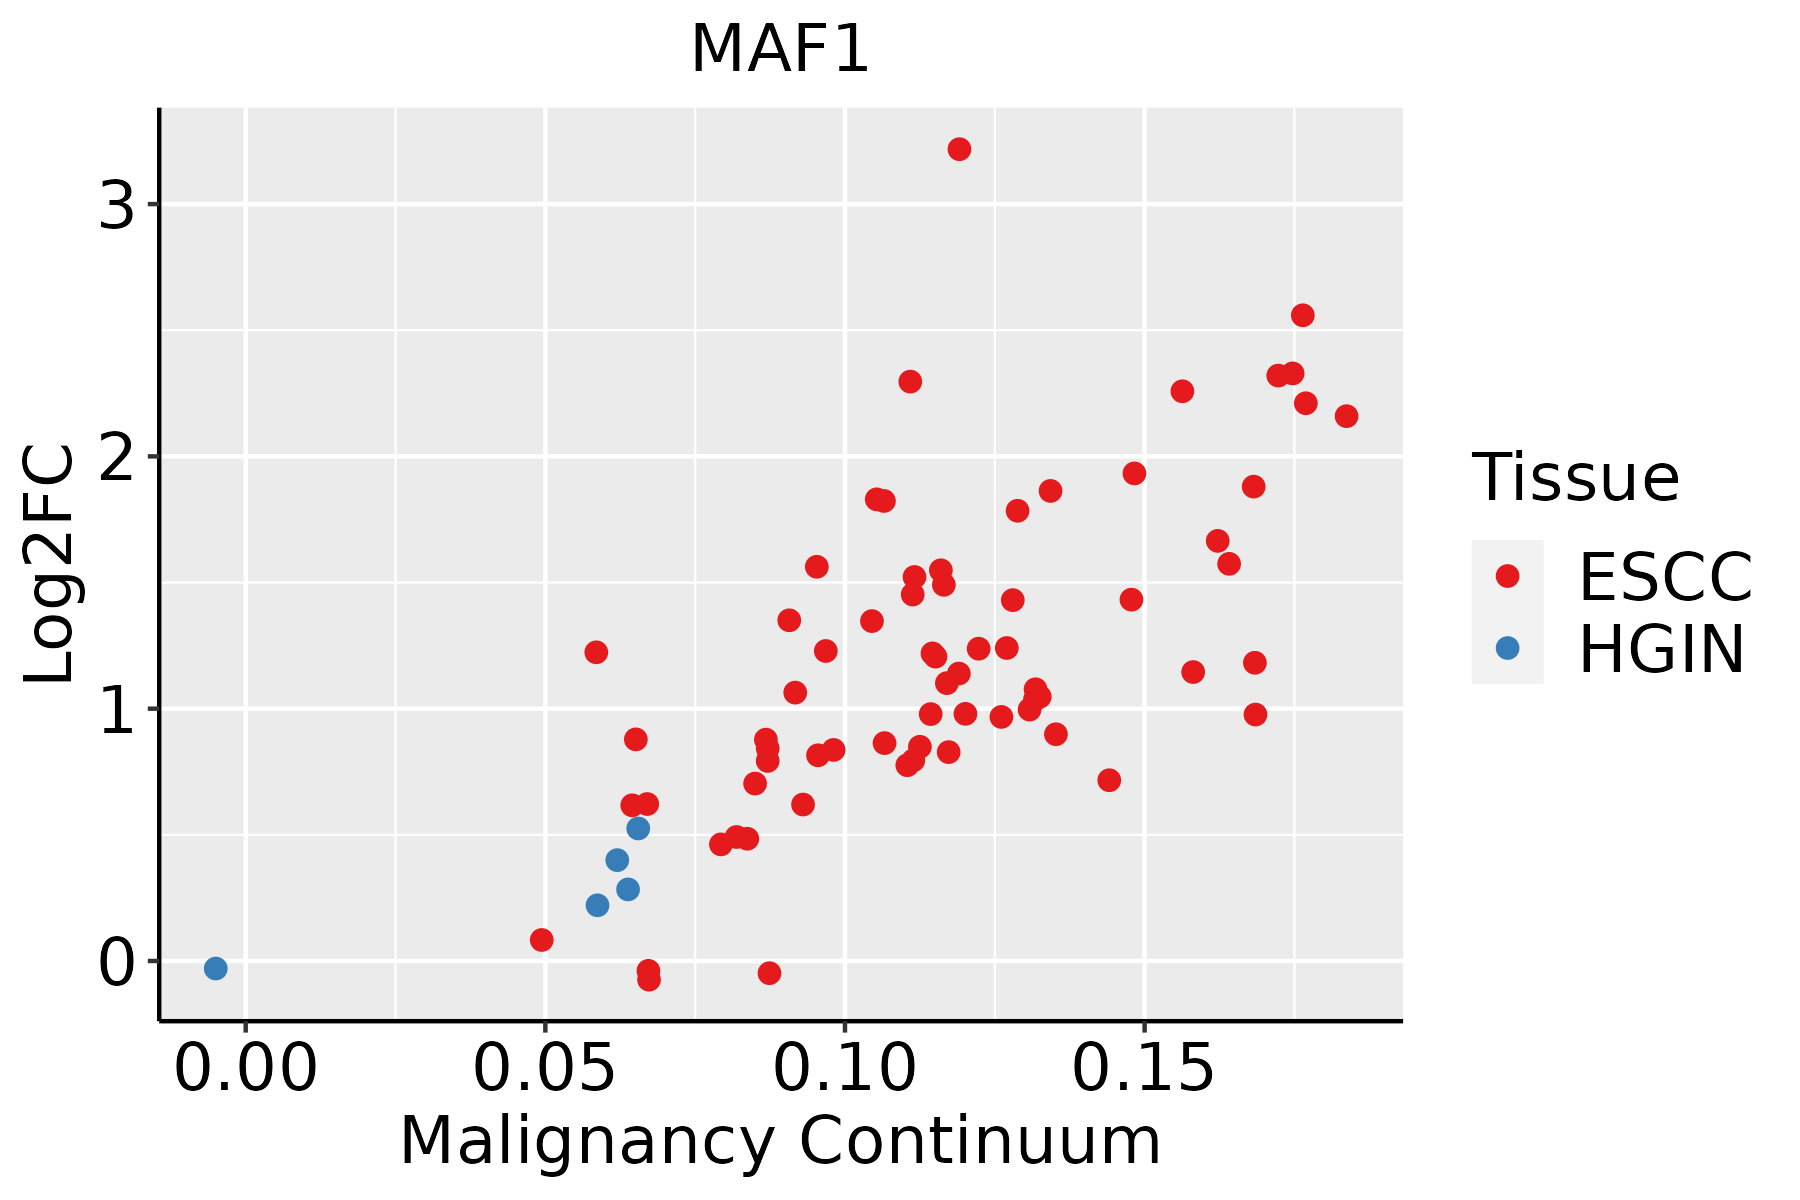 | ESCC: Esophageal squamous cell carcinoma |
| HGIN: High-grade intraepithelial neoplasias | ||
| LGIN: Low-grade intraepithelial neoplasias | ||
| Liver | 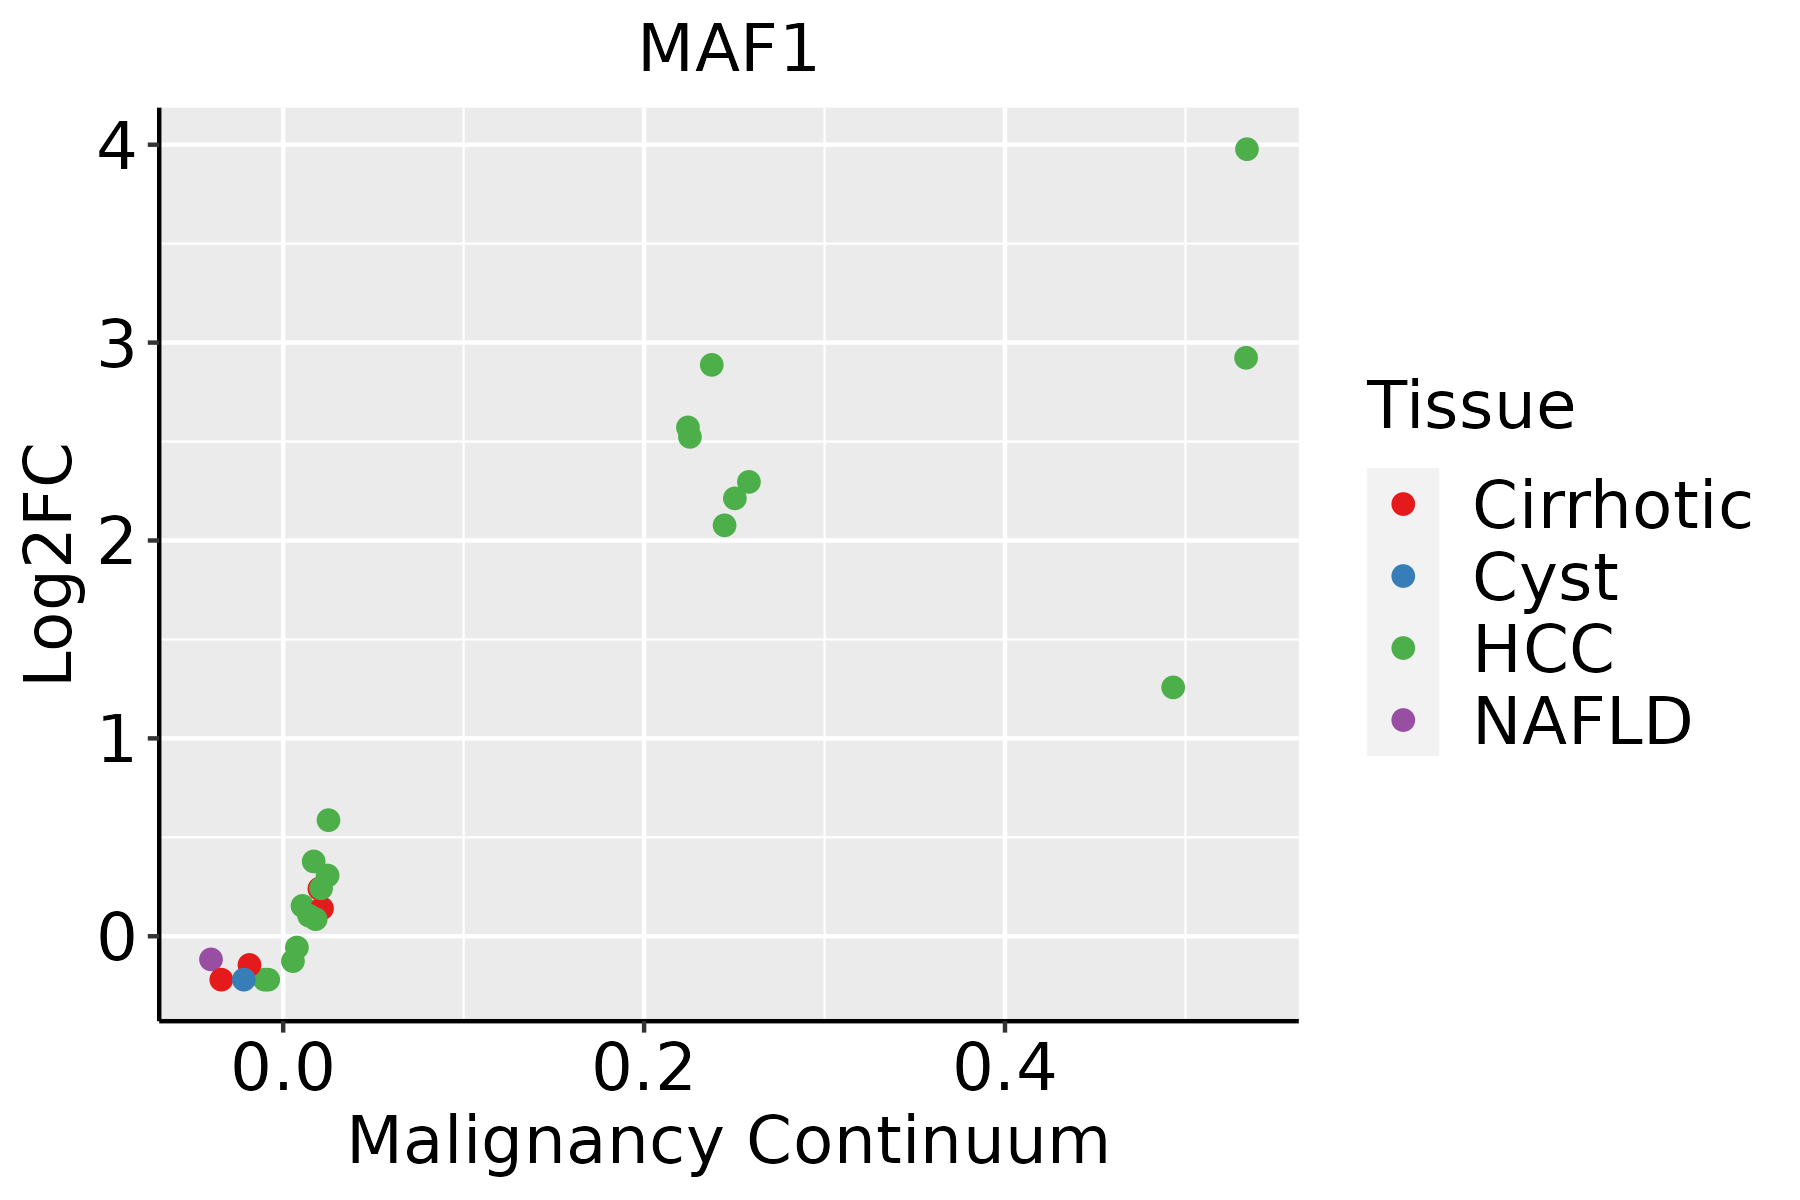 | HCC: Hepatocellular carcinoma |
| NAFLD: Non-alcoholic fatty liver disease | ||
| Oral Cavity | 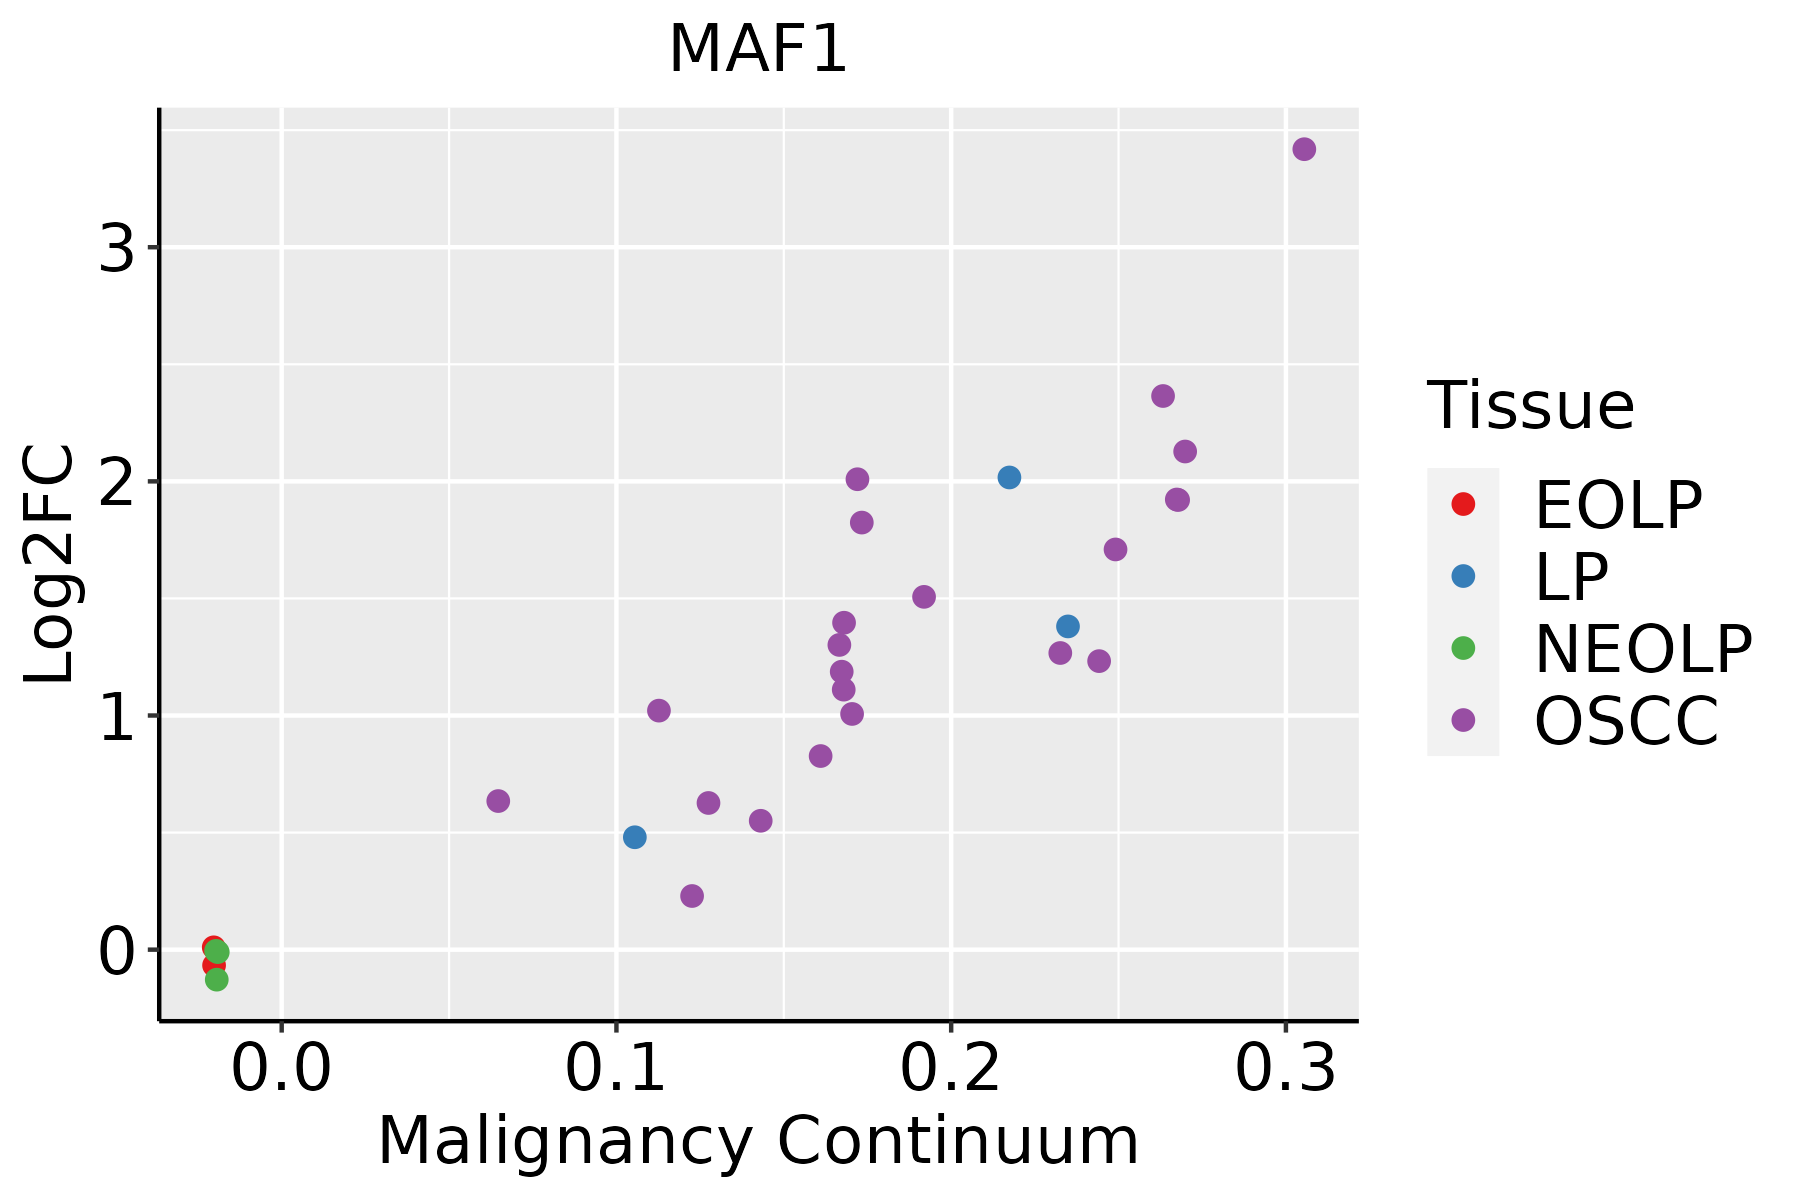 | EOLP: Erosive Oral lichen planus |
| LP: leukoplakia | ||
| NEOLP: Non-erosive oral lichen planus | ||
| OSCC: Oral squamous cell carcinoma | ||
| Prostate | 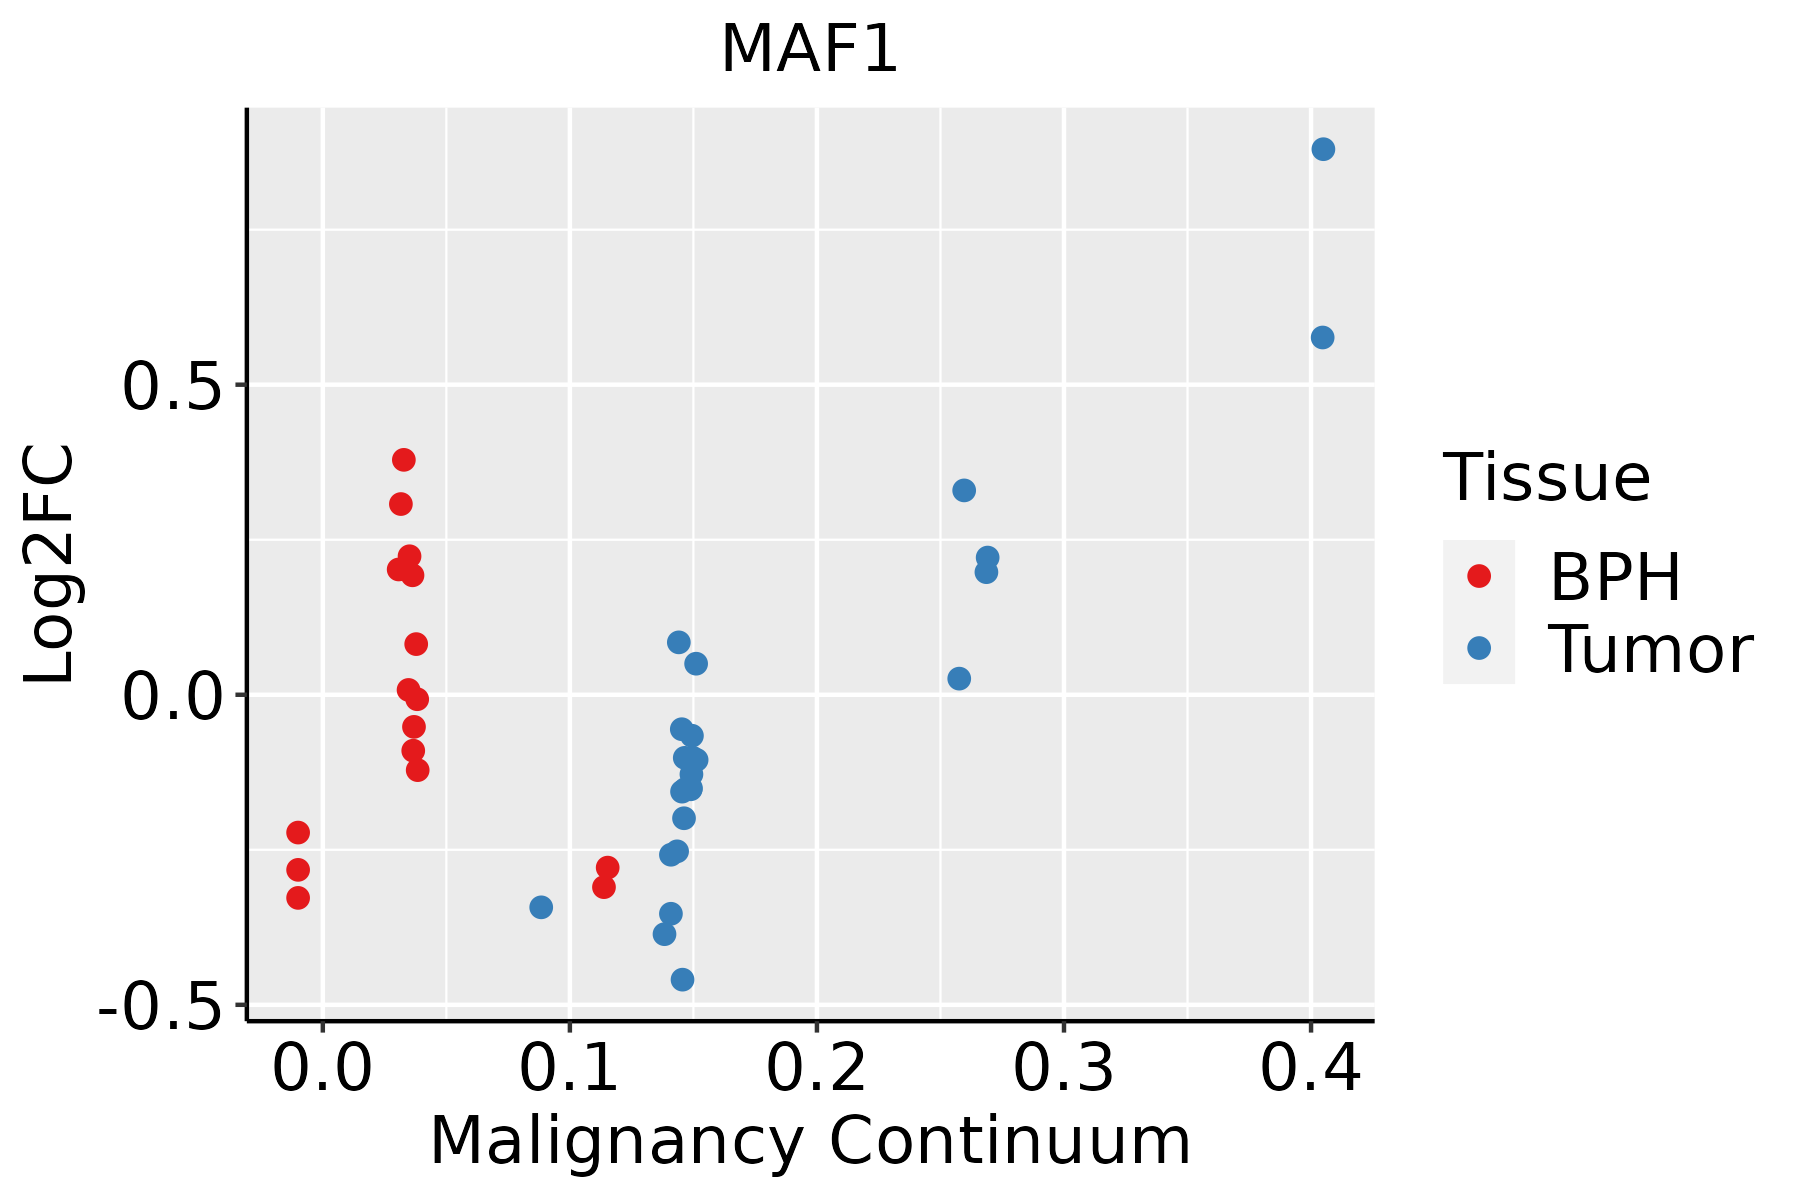 | BPH: Benign Prostatic Hyperplasia |
| Skin | 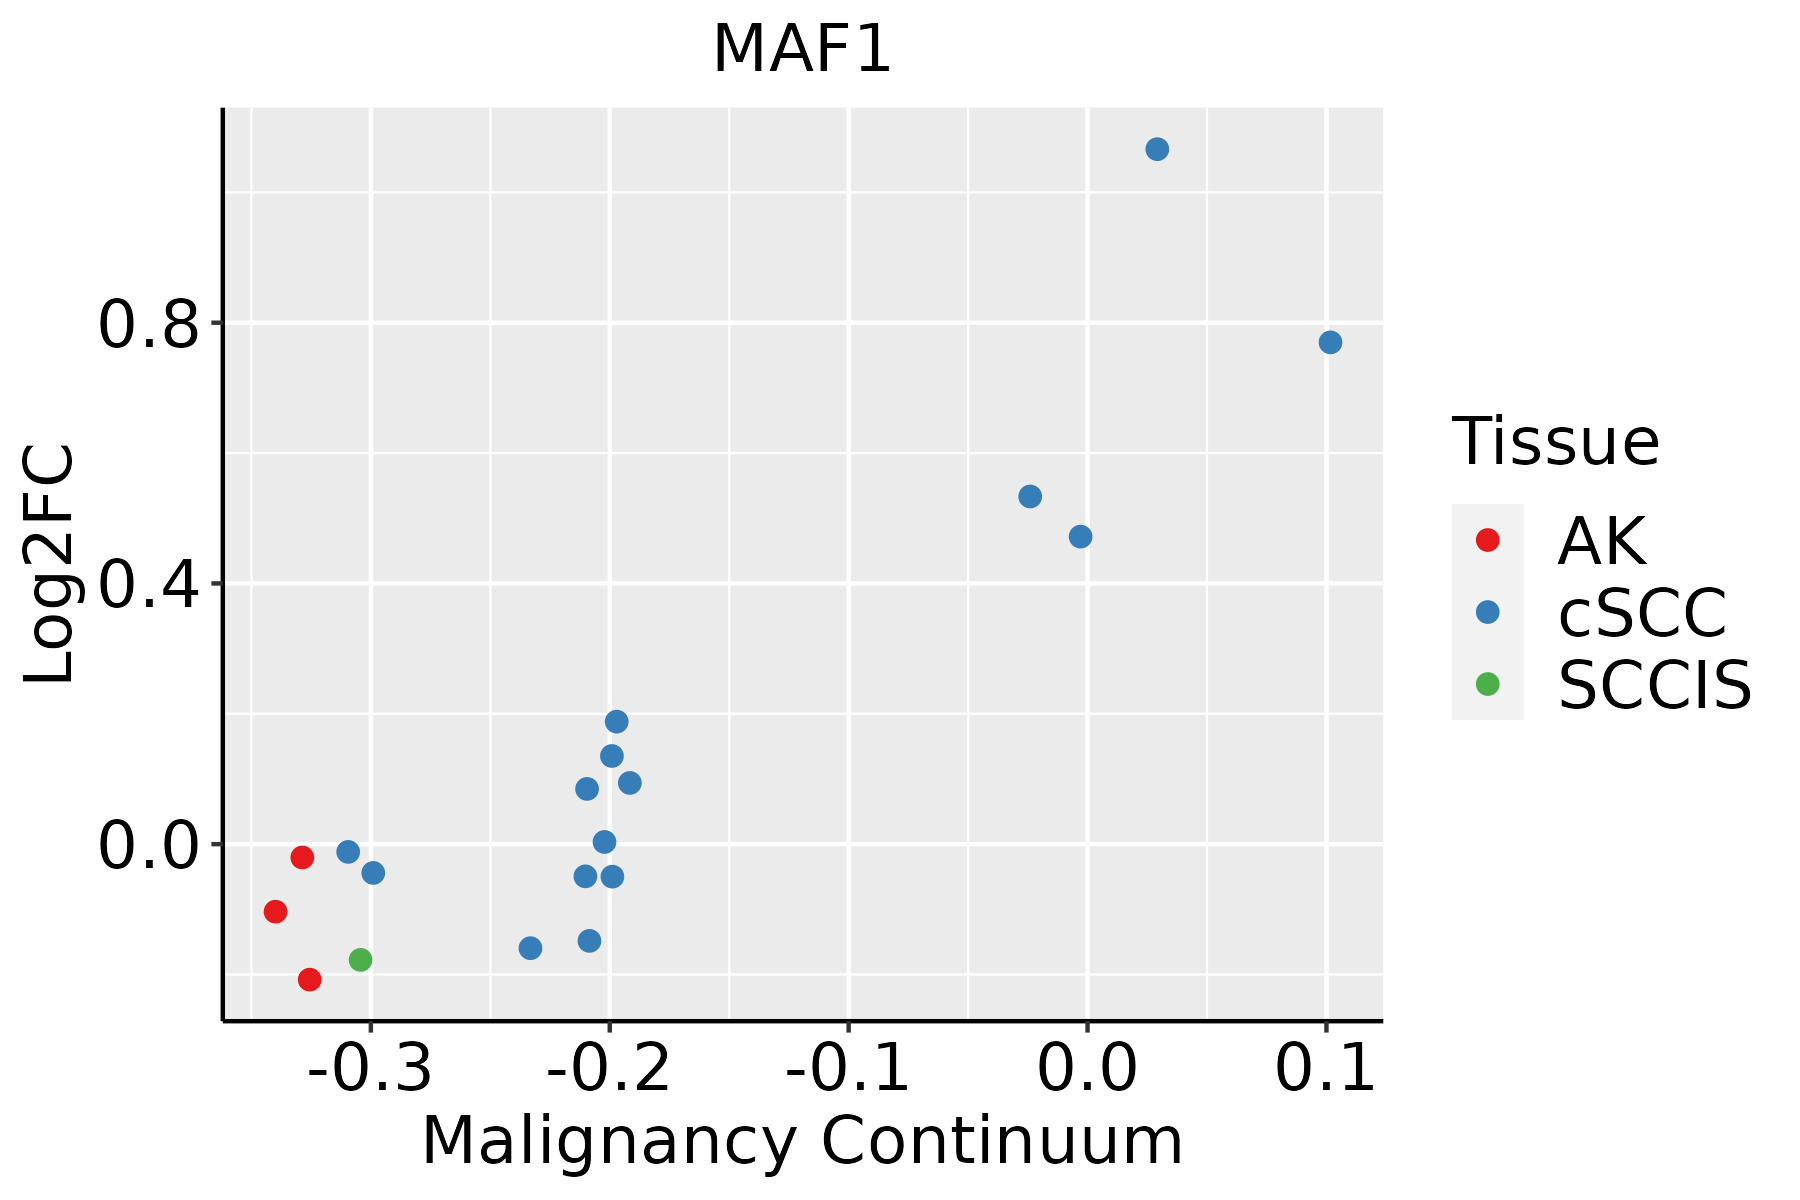 | AK: Actinic keratosis |
| cSCC: Cutaneous squamous cell carcinoma | ||
| SCCIS:squamous cell carcinoma in situ | ||
| Thyroid | 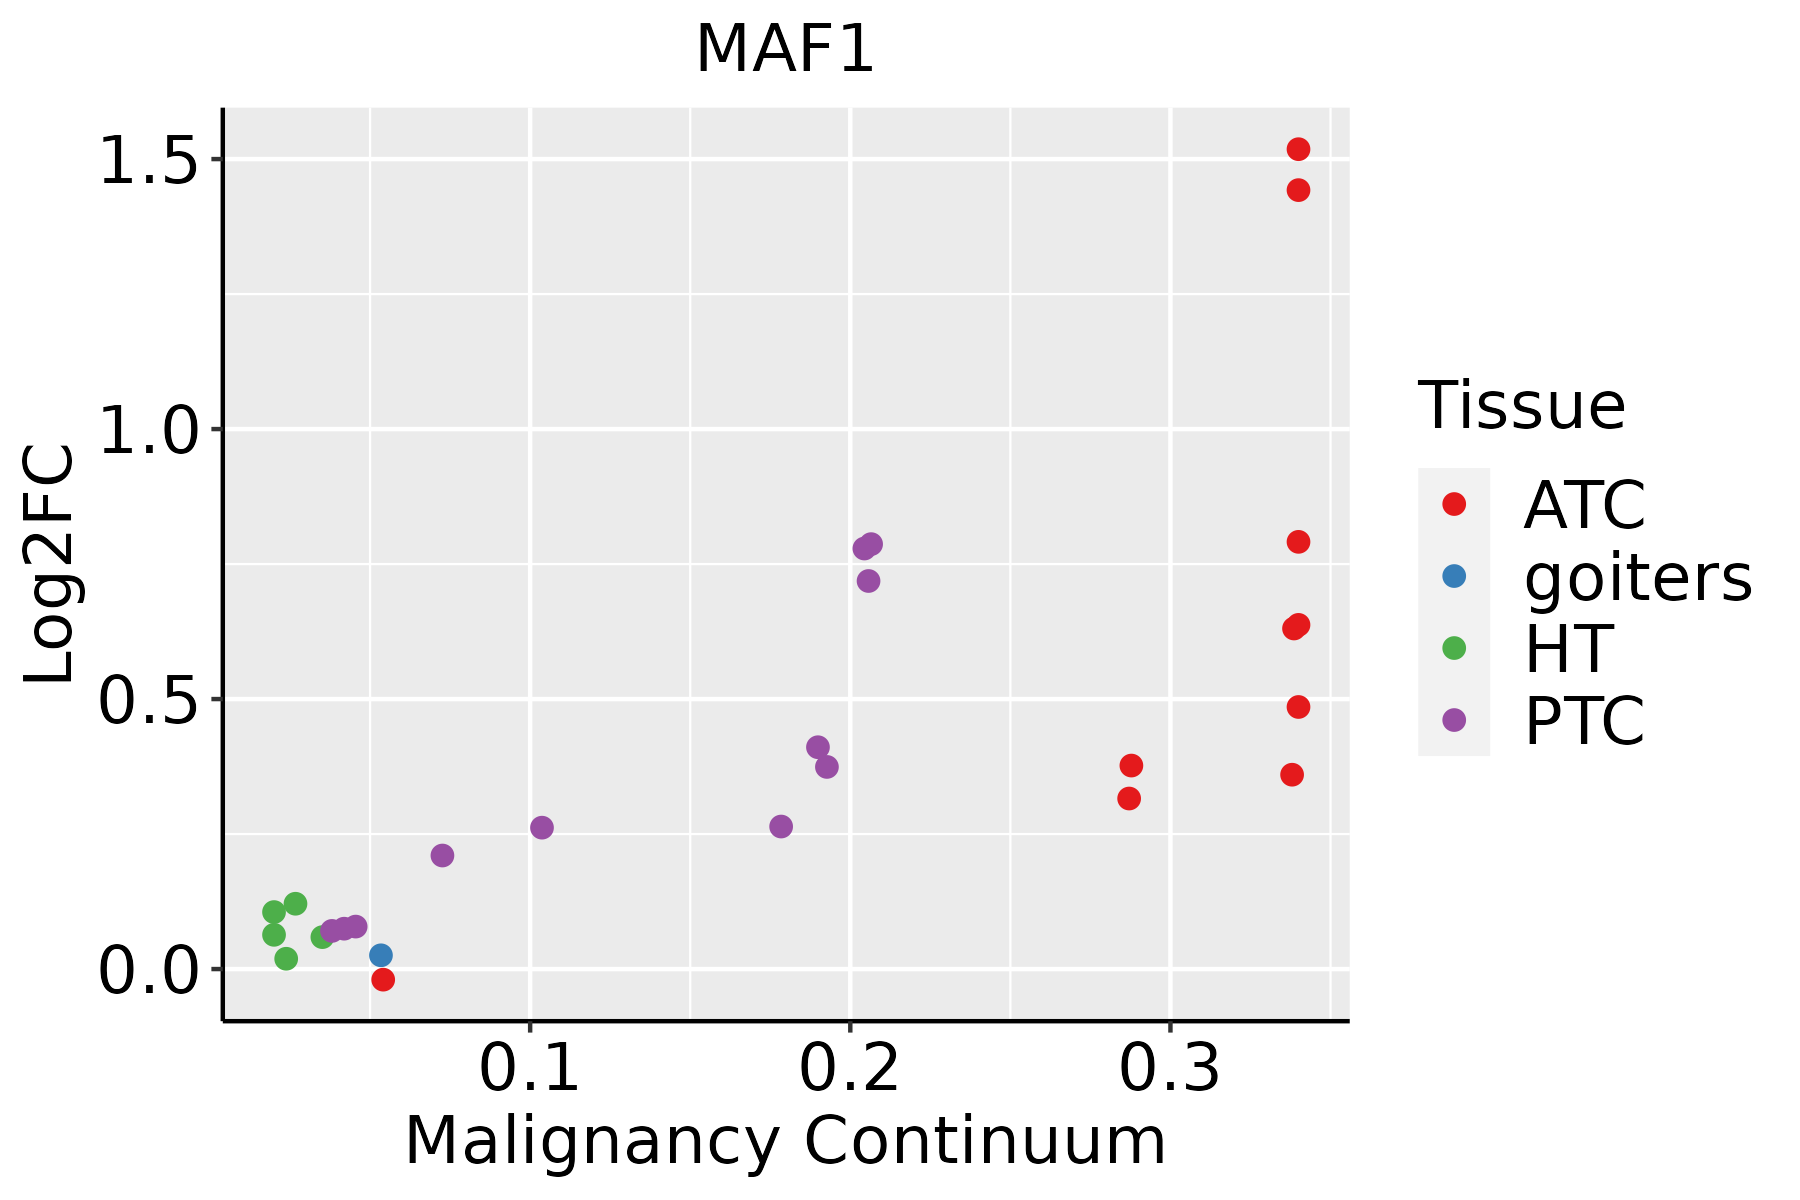 | ATC: Anaplastic thyroid cancer |
| HT: Hashimoto's thyroiditis | ||
| PTC: Papillary thyroid cancer |
| ∗log2FC in expression of this searched gene in stem-like cells from each diseased tissue sample relative to stem-like cells in normal samples in each tissue plotted against the malignancy continuum. Samples are colored based on if they are from different disease stage. |
Top |
Malignant transformation related pathway analysis |
| Find out the enriched GO biological processes and KEGG pathways involved in transition from healthy to precancer to cancer |
| Tissue | Disease Stage | Enriched GO biological Processes |
| Colorectum | AD |  |
| Colorectum | SER |  |
| Colorectum | MSS |  |
| Colorectum | MSI-H |  |
| Colorectum | FAP |  |
| ∗Top 15 enriched GO BP terms are showed in the bar plot of each disease state in each tissue. Each row represents a significant GO biological process which is colored according to the -log10(p.adjust). |
| Page: 1 2 3 4 5 6 7 8 9 |
| GO ID | Tissue | Disease Stage | Description | Gene Ratio | Bg Ratio | pvalue | p.adjust | Count |
| GO:00063833 | Esophagus | ESCC | transcription by RNA polymerase III | 41/8552 | 46/18723 | 7.69e-10 | 1.90e-08 | 41 |
| GO:00063602 | Esophagus | ESCC | transcription by RNA polymerase I | 42/8552 | 55/18723 | 3.41e-06 | 3.78e-05 | 42 |
| GO:00063564 | Esophagus | ESCC | regulation of transcription by RNA polymerase I | 27/8552 | 34/18723 | 6.01e-05 | 4.62e-04 | 27 |
| GO:0006359 | Esophagus | ESCC | regulation of transcription by RNA polymerase III | 19/8552 | 22/18723 | 9.52e-05 | 6.78e-04 | 19 |
| GO:0006360 | Liver | HCC | transcription by RNA polymerase I | 36/7958 | 55/18723 | 4.94e-04 | 3.23e-03 | 36 |
| GO:0006383 | Liver | HCC | transcription by RNA polymerase III | 31/7958 | 46/18723 | 5.67e-04 | 3.61e-03 | 31 |
| GO:0006356 | Liver | HCC | regulation of transcription by RNA polymerase I | 24/7958 | 34/18723 | 8.62e-04 | 5.13e-03 | 24 |
| GO:00063832 | Oral cavity | OSCC | transcription by RNA polymerase III | 34/7305 | 46/18723 | 1.61e-06 | 2.11e-05 | 34 |
| GO:00063563 | Oral cavity | OSCC | regulation of transcription by RNA polymerase I | 25/7305 | 34/18723 | 4.63e-05 | 3.90e-04 | 25 |
| GO:00063601 | Oral cavity | OSCC | transcription by RNA polymerase I | 36/7305 | 55/18723 | 6.42e-05 | 5.22e-04 | 36 |
| GO:00063831 | Oral cavity | LP | transcription by RNA polymerase III | 20/4623 | 46/18723 | 4.03e-03 | 2.61e-02 | 20 |
| GO:00063562 | Prostate | BPH | regulation of transcription by RNA polymerase I | 12/3107 | 34/18723 | 6.45e-03 | 2.91e-02 | 12 |
| GO:00063561 | Prostate | Tumor | regulation of transcription by RNA polymerase I | 13/3246 | 34/18723 | 3.09e-03 | 1.63e-02 | 13 |
| GO:00063565 | Skin | cSCC | regulation of transcription by RNA polymerase I | 22/4864 | 34/18723 | 2.33e-06 | 3.77e-05 | 22 |
| GO:00063603 | Skin | cSCC | transcription by RNA polymerase I | 30/4864 | 55/18723 | 6.13e-06 | 8.70e-05 | 30 |
| GO:00063834 | Skin | cSCC | transcription by RNA polymerase III | 20/4864 | 46/18723 | 7.44e-03 | 3.50e-02 | 20 |
| GO:00063566 | Thyroid | PTC | regulation of transcription by RNA polymerase I | 20/5968 | 34/18723 | 1.07e-03 | 6.32e-03 | 20 |
| GO:00063604 | Thyroid | PTC | transcription by RNA polymerase I | 28/5968 | 55/18723 | 2.55e-03 | 1.31e-02 | 28 |
| GO:00063835 | Thyroid | PTC | transcription by RNA polymerase III | 23/5968 | 46/18723 | 7.89e-03 | 3.33e-02 | 23 |
| GO:000635611 | Thyroid | ATC | regulation of transcription by RNA polymerase I | 20/6293 | 34/18723 | 2.22e-03 | 1.04e-02 | 20 |
| Page: 1 2 |
| Pathway ID | Tissue | Disease Stage | Description | Gene Ratio | Bg Ratio | pvalue | p.adjust | qvalue | Count |
| Page: 1 |
Top |
Cell-cell communication analysis |
| Identification of potential cell-cell interactions between two cell types and their ligand-receptor pairs for different disease states |
| Ligand | Receptor | LRpair | Pathway | Tissue | Disease Stage |
| Page: 1 |
Top |
Single-cell gene regulatory network inference analysis |
| Find out the significant the regulons (TFs) and the target genes of each regulon across cell types for different disease states |
| TF | Cell Type | Tissue | Disease Stage | Target Gene | RSS | Regulon Activity |
| ∗The dot plots of a searched regulon are shown for all cell subpopulations in each disease state of each tissue based on the regulon specific score inferred using pySCENIC and by calculating the average expression. |
| Page: 1 |
Top |
Somatic mutation of malignant transformation related genes |
| Annotation of somatic variants for genes involved in malignant transformation |
| Hugo Symbol | Variant Class | Variant Classification | dbSNP RS | HGVSc | HGVSp | HGVSp Short | SWISSPROT | BIOTYPE | SIFT | PolyPhen | Tumor Sample Barcode | Tissue | Histology | Sex | Age | Stage | Therapy Types | Drugs | Outcome |
| MAF1 | SNV | Missense_Mutation | novel | c.36N>G | p.Ile12Met | p.I12M | Q9H063 | protein_coding | tolerated(0.08) | benign(0.114) | TCGA-DS-A1OB-01 | Cervix | cervical & endocervical cancer | Female | <65 | I/II | Chemotherapy | carboplatin | PD |
| MAF1 | SNV | Missense_Mutation | novel | c.361G>A | p.Glu121Lys | p.E121K | Q9H063 | protein_coding | deleterious(0.04) | possibly_damaging(0.511) | TCGA-EA-A97N-01 | Cervix | cervical & endocervical cancer | Female | <65 | I/II | Unknown | Unknown | SD |
| MAF1 | SNV | Missense_Mutation | c.115N>A | p.Asp39Asn | p.D39N | Q9H063 | protein_coding | tolerated(0.58) | benign(0.02) | TCGA-IR-A3LK-01 | Cervix | cervical & endocervical cancer | Female | >=65 | I/II | Chemotherapy | cisplatin | PD | |
| MAF1 | SNV | Missense_Mutation | rs765491765 | c.419N>A | p.Arg140Gln | p.R140Q | Q9H063 | protein_coding | tolerated(0.51) | benign(0.051) | TCGA-F4-6570-01 | Colorectum | colon adenocarcinoma | Female | >=65 | I/II | Unknown | Unknown | SD |
| MAF1 | SNV | Missense_Mutation | novel | c.356G>A | p.Ser119Asn | p.S119N | Q9H063 | protein_coding | deleterious(0) | possibly_damaging(0.88) | TCGA-AP-A1DK-01 | Endometrium | uterine corpus endometrioid carcinoma | Female | <65 | I/II | Unknown | Unknown | SD |
| MAF1 | SNV | Missense_Mutation | novel | c.757G>T | p.Val253Leu | p.V253L | Q9H063 | protein_coding | tolerated_low_confidence(0.09) | benign(0) | TCGA-AP-A1DK-01 | Endometrium | uterine corpus endometrioid carcinoma | Female | <65 | I/II | Unknown | Unknown | SD |
| MAF1 | SNV | Missense_Mutation | novel | c.592A>G | p.Ile198Val | p.I198V | Q9H063 | protein_coding | deleterious(0.02) | possibly_damaging(0.644) | TCGA-AX-A3FT-01 | Endometrium | uterine corpus endometrioid carcinoma | Female | <65 | I/II | Unknown | Unknown | SD |
| MAF1 | SNV | Missense_Mutation | novel | c.105G>C | p.Lys35Asn | p.K35N | Q9H063 | protein_coding | deleterious(0) | probably_damaging(1) | TCGA-44-3919-01 | Lung | lung adenocarcinoma | Female | >=65 | I/II | Unknown | Unknown | PD |
| MAF1 | SNV | Missense_Mutation | novel | c.83N>T | p.Arg28Met | p.R28M | Q9H063 | protein_coding | deleterious(0) | probably_damaging(0.995) | TCGA-44-4112-01 | Lung | lung adenocarcinoma | Female | <65 | I/II | Chemotherapy | cisplatin | PD |
| MAF1 | SNV | Missense_Mutation | c.349N>C | p.Glu117Gln | p.E117Q | Q9H063 | protein_coding | tolerated(0.08) | possibly_damaging(0.88) | TCGA-75-6214-01 | Lung | lung adenocarcinoma | Female | Unknown | III/IV | Unknown | Unknown | PD |
| Page: 1 2 |
Top |
Related drugs of malignant transformation related genes |
| Identification of chemicals and drugs interact with genes involved in malignant transfromation |
| (DGIdb 4.0) |
| Entrez ID | Symbol | Category | Interaction Types | Drug Claim Name | Drug Name | PMIDs |
| Page: 1 |

Copyright 2023-Present -The University of Texas Health Science Center at Houston |