
|
|||||
|
 | |
| |
| |
| |
| |
| |
|
Gene: MAF |
Gene summary for MAF |
| Gene information | Species | Human | Gene symbol | MAF | Gene ID | 4094 |
| Gene name | MAF bZIP transcription factor | |
| Gene Alias | AYGRP | |
| Cytomap | 16q23.2 | |
| Gene Type | protein-coding | GO ID | GO:0000122 | UniProtAcc | O75444 |
Top |
Malignant transformation analysis |
| Identification of the aberrant gene expression in precancerous and cancerous lesions by comparing the gene expression of stem-like cells in diseased tissues with normal stem cells |
| Entrez ID | Symbol | Replicates | Species | Organ | Tissue | Adj P-value | Log2FC | Malignancy |
| 4094 | MAF | LZE4T | Human | Esophagus | ESCC | 6.27e-20 | 6.88e-01 | 0.0811 |
| 4094 | MAF | LZE20T | Human | Esophagus | ESCC | 4.14e-09 | 3.16e-01 | 0.0662 |
| 4094 | MAF | LZE24T | Human | Esophagus | ESCC | 1.70e-09 | 3.83e-01 | 0.0596 |
| 4094 | MAF | P1T-E | Human | Esophagus | ESCC | 4.23e-02 | 1.84e-01 | 0.0875 |
| 4094 | MAF | P2T-E | Human | Esophagus | ESCC | 1.34e-07 | 3.69e-02 | 0.1177 |
| 4094 | MAF | P4T-E | Human | Esophagus | ESCC | 8.80e-10 | 1.68e-01 | 0.1323 |
| 4094 | MAF | P5T-E | Human | Esophagus | ESCC | 3.27e-31 | 5.06e-01 | 0.1327 |
| 4094 | MAF | P8T-E | Human | Esophagus | ESCC | 6.55e-09 | 9.23e-02 | 0.0889 |
| 4094 | MAF | P9T-E | Human | Esophagus | ESCC | 6.99e-06 | 2.09e-01 | 0.1131 |
| 4094 | MAF | P10T-E | Human | Esophagus | ESCC | 9.13e-18 | 3.41e-01 | 0.116 |
| 4094 | MAF | P11T-E | Human | Esophagus | ESCC | 2.29e-09 | 5.97e-01 | 0.1426 |
| 4094 | MAF | P12T-E | Human | Esophagus | ESCC | 1.18e-15 | 2.40e-01 | 0.1122 |
| 4094 | MAF | P15T-E | Human | Esophagus | ESCC | 1.17e-03 | 2.07e-01 | 0.1149 |
| 4094 | MAF | P19T-E | Human | Esophagus | ESCC | 3.72e-02 | 2.16e-01 | 0.1662 |
| 4094 | MAF | P20T-E | Human | Esophagus | ESCC | 5.86e-08 | 2.28e-01 | 0.1124 |
| 4094 | MAF | P21T-E | Human | Esophagus | ESCC | 3.55e-13 | 1.94e-01 | 0.1617 |
| 4094 | MAF | P22T-E | Human | Esophagus | ESCC | 4.19e-47 | 8.28e-01 | 0.1236 |
| 4094 | MAF | P23T-E | Human | Esophagus | ESCC | 5.24e-06 | 2.14e-01 | 0.108 |
| 4094 | MAF | P24T-E | Human | Esophagus | ESCC | 3.30e-04 | 4.94e-02 | 0.1287 |
| 4094 | MAF | P26T-E | Human | Esophagus | ESCC | 3.18e-13 | 4.73e-01 | 0.1276 |
| Page: 1 2 3 4 5 |
| Tissue | Expression Dynamics | Abbreviation |
| Esophagus | 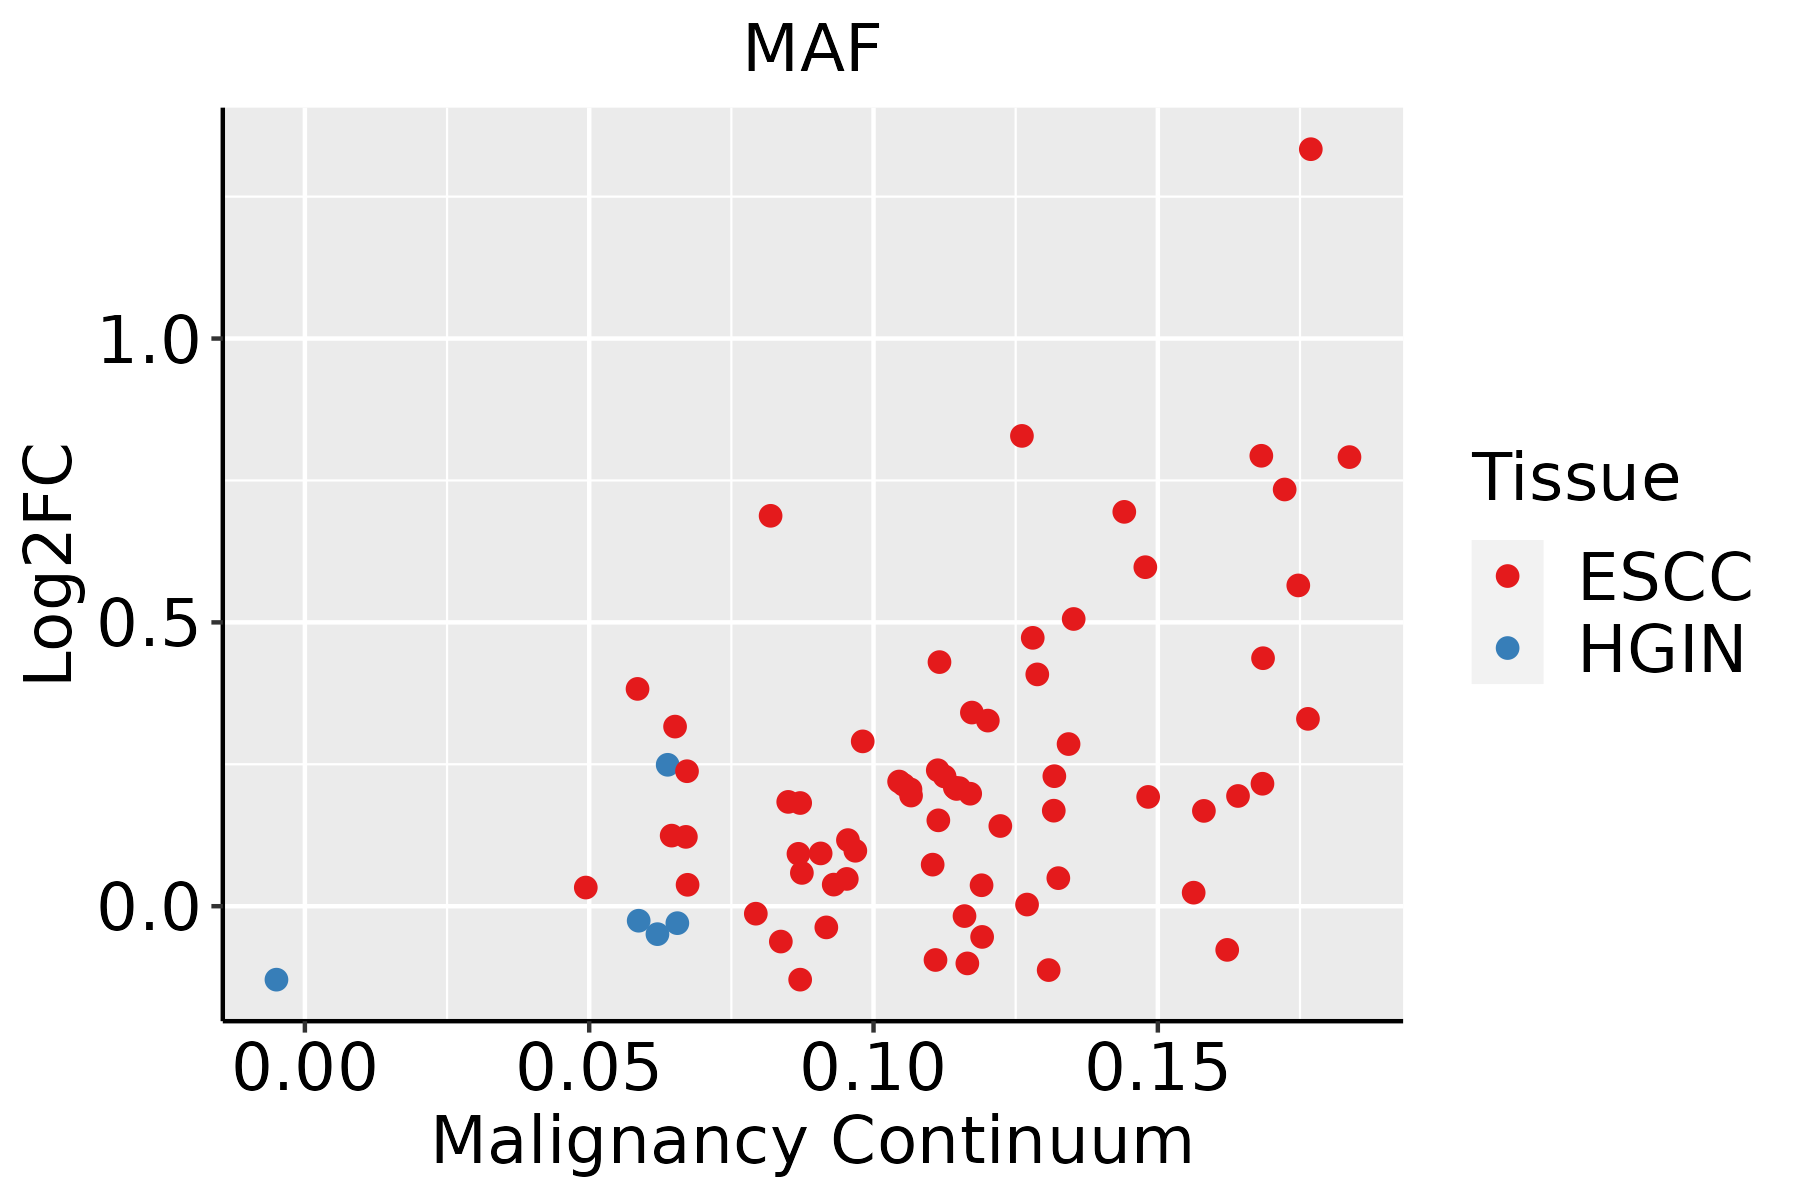 | ESCC: Esophageal squamous cell carcinoma |
| HGIN: High-grade intraepithelial neoplasias | ||
| LGIN: Low-grade intraepithelial neoplasias | ||
| GC | 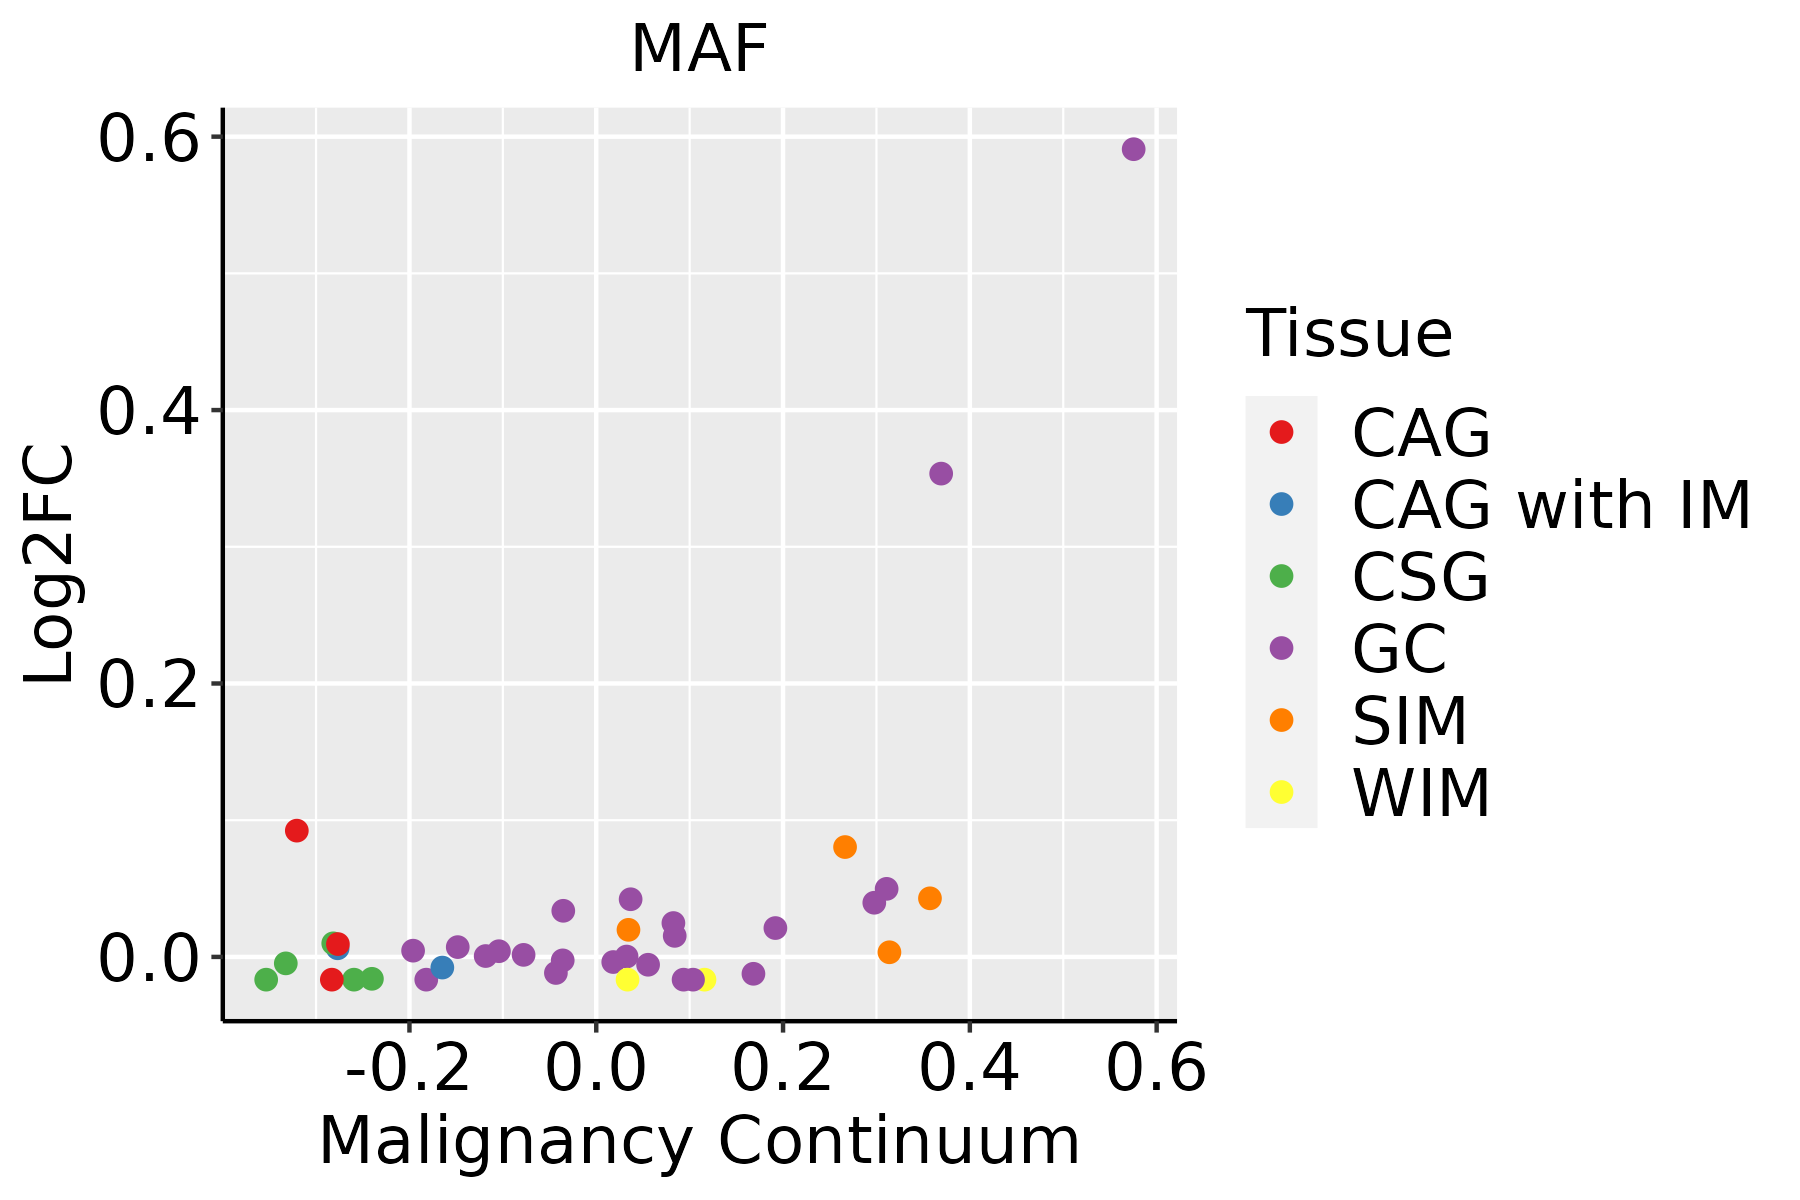 | CAG: Chronic atrophic gastritis |
| CAG with IM: Chronic atrophic gastritis with intestinal metaplasia | ||
| CSG: Chronic superficial gastritis | ||
| GC: Gastric cancer | ||
| SIM: Severe intestinal metaplasia | ||
| WIM: Wild intestinal metaplasia | ||
| Liver |  | HCC: Hepatocellular carcinoma |
| NAFLD: Non-alcoholic fatty liver disease | ||
| Oral Cavity | 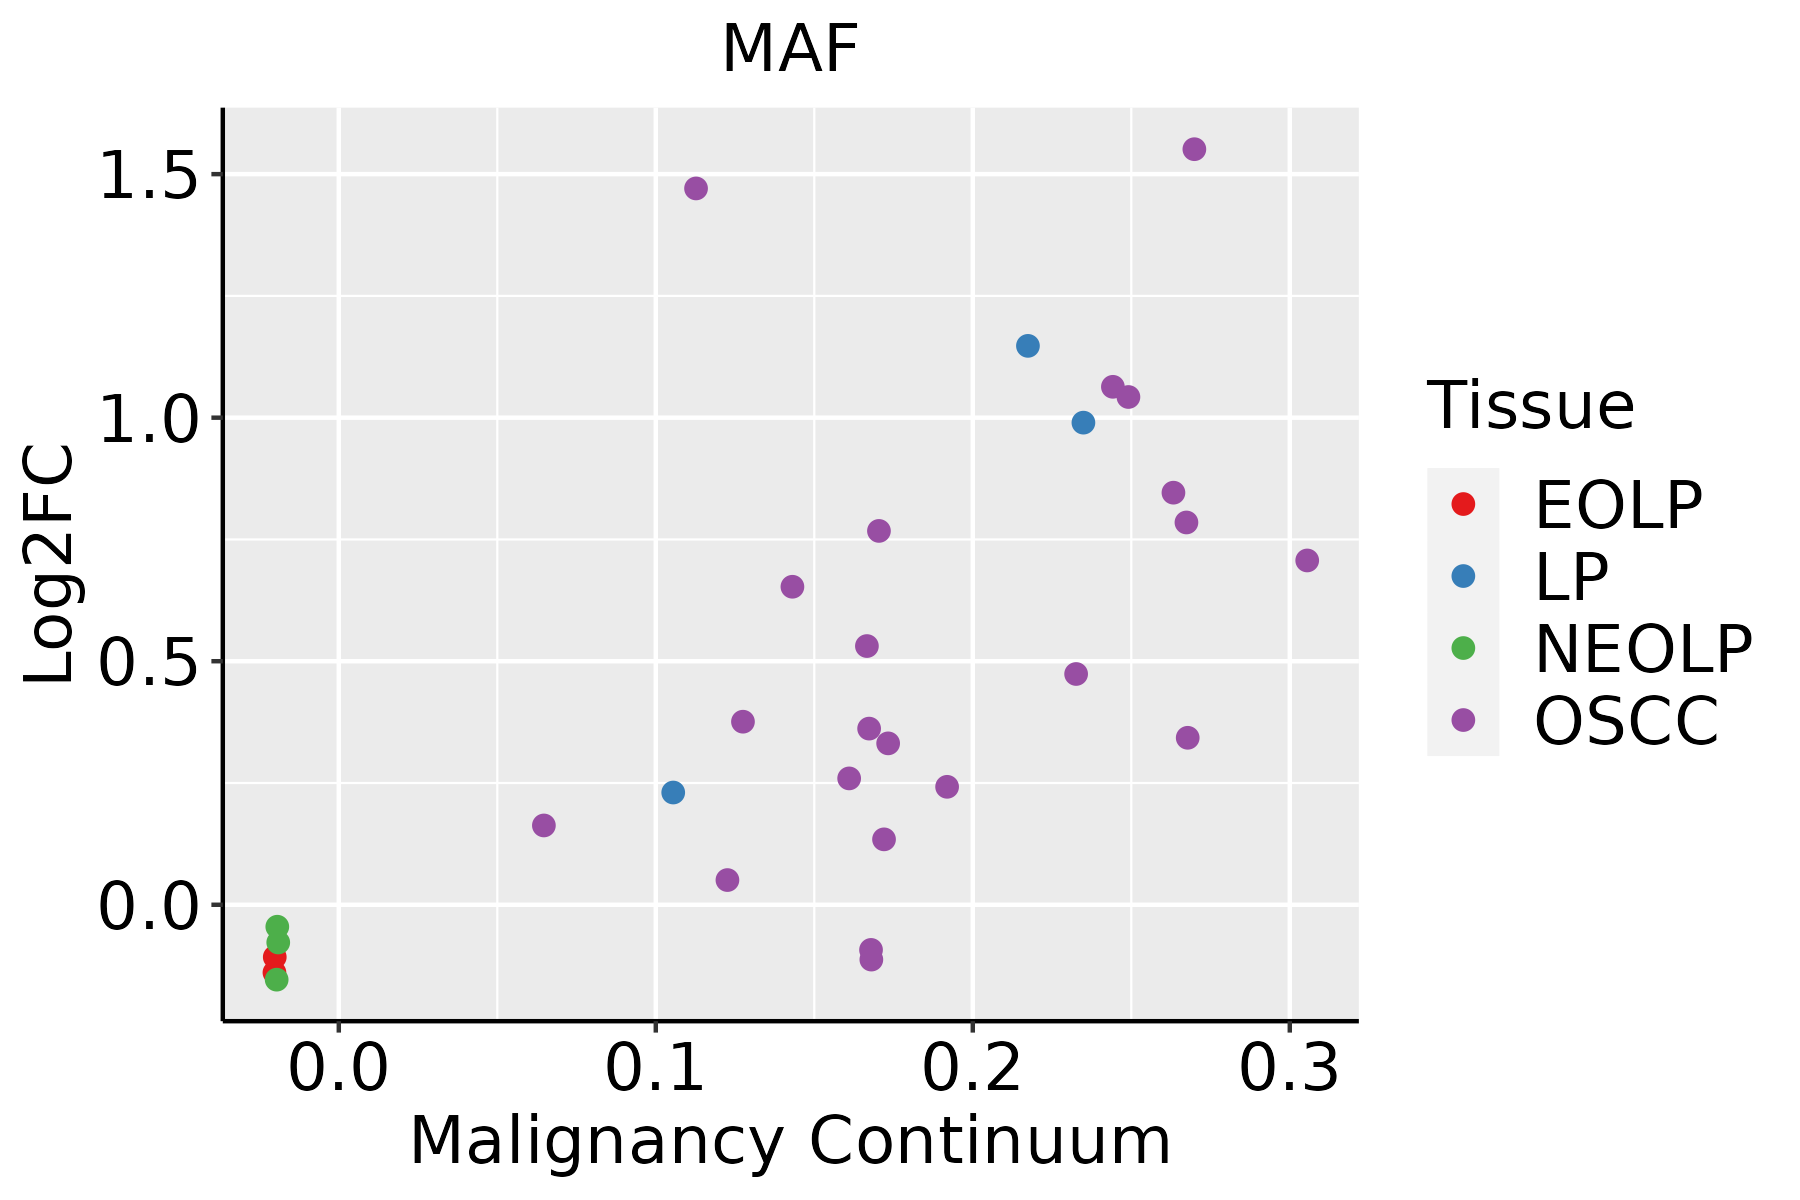 | EOLP: Erosive Oral lichen planus |
| LP: leukoplakia | ||
| NEOLP: Non-erosive oral lichen planus | ||
| OSCC: Oral squamous cell carcinoma | ||
| Skin | 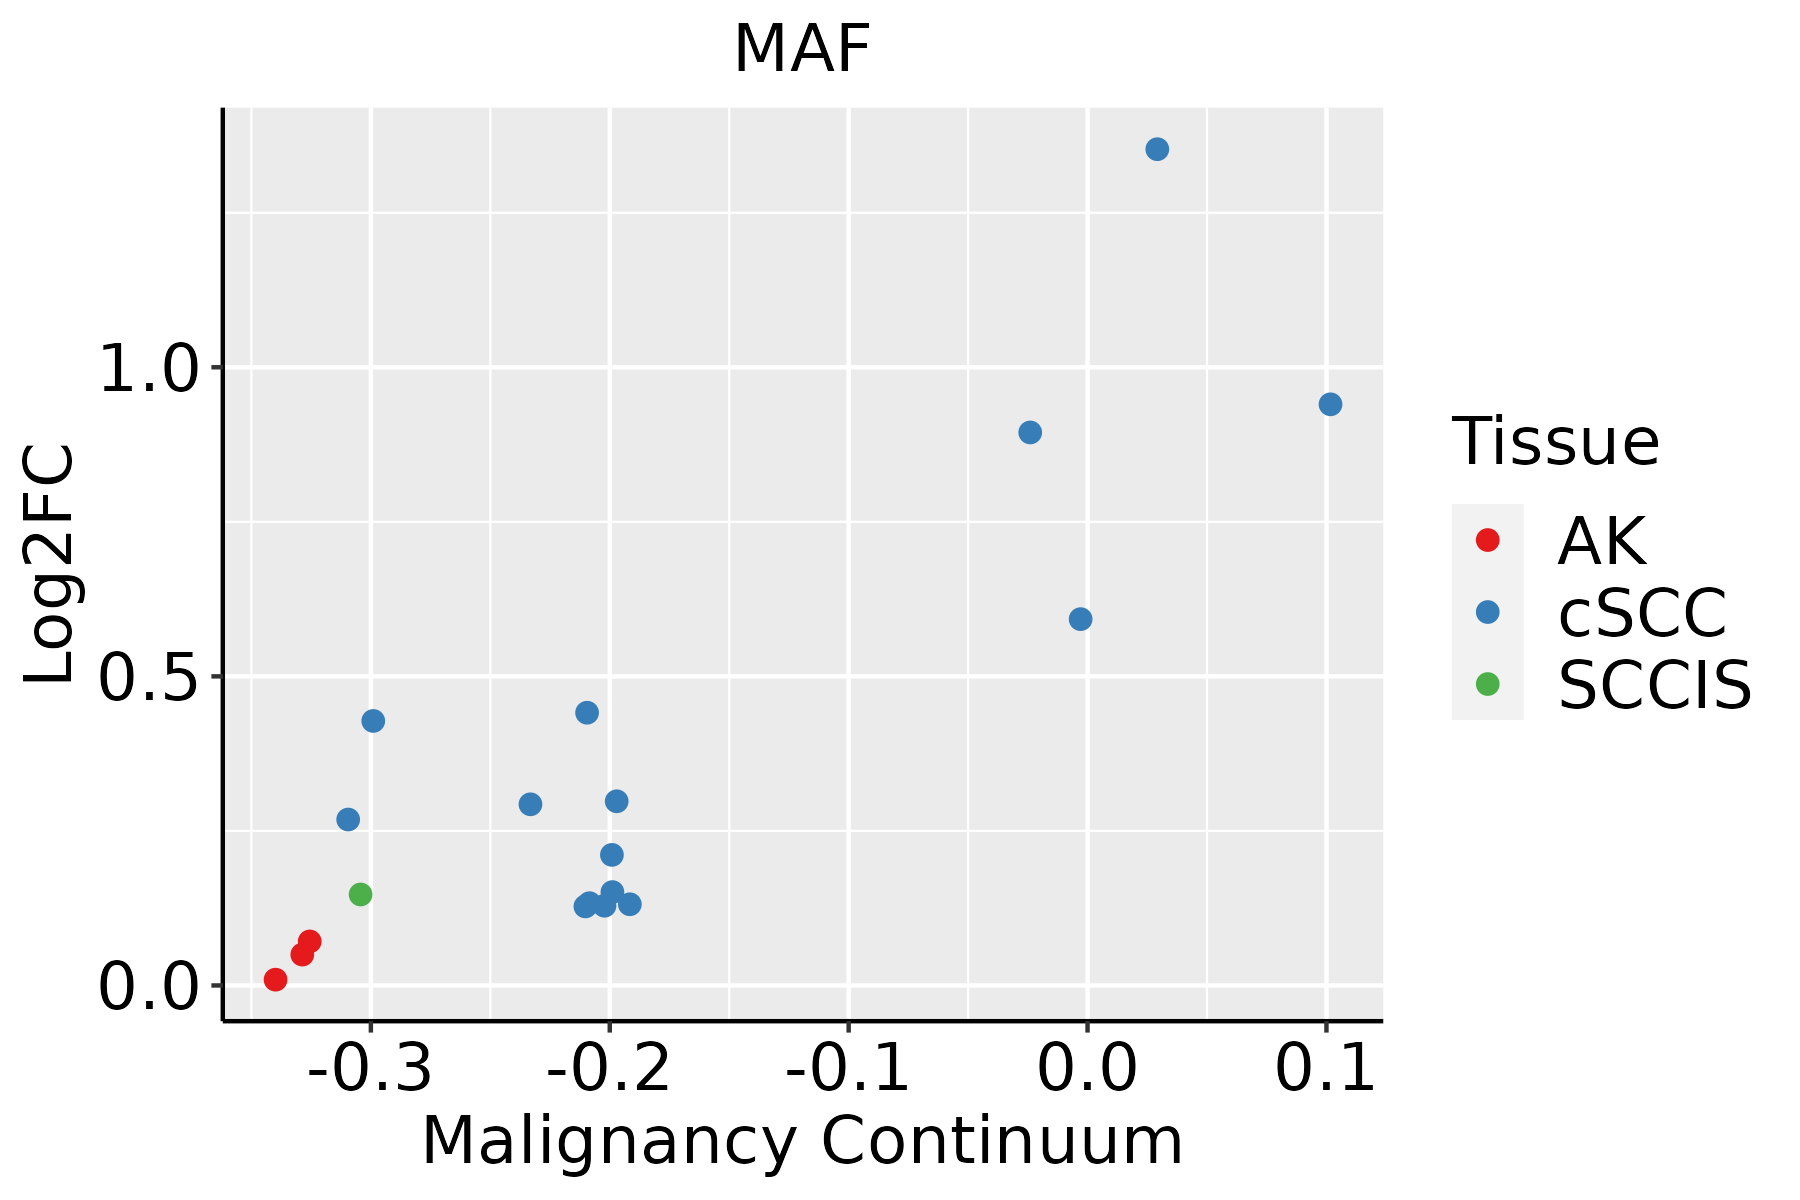 | AK: Actinic keratosis |
| cSCC: Cutaneous squamous cell carcinoma | ||
| SCCIS:squamous cell carcinoma in situ | ||
| Thyroid |  | ATC: Anaplastic thyroid cancer |
| HT: Hashimoto's thyroiditis | ||
| PTC: Papillary thyroid cancer |
| ∗log2FC in expression of this searched gene in stem-like cells from each diseased tissue sample relative to stem-like cells in normal samples in each tissue plotted against the malignancy continuum. Samples are colored based on if they are from different disease stage. |
Top |
Malignant transformation related pathway analysis |
| Find out the enriched GO biological processes and KEGG pathways involved in transition from healthy to precancer to cancer |
| Tissue | Disease Stage | Enriched GO biological Processes |
| Colorectum | AD |  |
| Colorectum | SER |  |
| Colorectum | MSS |  |
| Colorectum | MSI-H |  |
| Colorectum | FAP |  |
| ∗Top 15 enriched GO BP terms are showed in the bar plot of each disease state in each tissue. Each row represents a significant GO biological process which is colored according to the -log10(p.adjust). |
| Page: 1 2 3 4 5 6 7 8 9 |
| GO ID | Tissue | Disease Stage | Description | Gene Ratio | Bg Ratio | pvalue | p.adjust | Count |
| GO:00022629 | Breast | Precancer | myeloid cell homeostasis | 27/1080 | 157/18723 | 3.10e-07 | 1.49e-05 | 27 |
| GO:00341019 | Breast | Precancer | erythrocyte homeostasis | 23/1080 | 129/18723 | 1.20e-06 | 4.60e-05 | 23 |
| GO:00447063 | Breast | Precancer | multi-multicellular organism process | 31/1080 | 220/18723 | 3.73e-06 | 1.19e-04 | 31 |
| GO:00300999 | Breast | Precancer | myeloid cell differentiation | 45/1080 | 381/18723 | 4.00e-06 | 1.25e-04 | 45 |
| GO:00487329 | Breast | Precancer | gland development | 49/1080 | 436/18723 | 6.11e-06 | 1.73e-04 | 49 |
| GO:00421107 | Breast | Precancer | T cell activation | 52/1080 | 487/18723 | 1.37e-05 | 3.42e-04 | 52 |
| GO:00456379 | Breast | Precancer | regulation of myeloid cell differentiation | 28/1080 | 210/18723 | 3.05e-05 | 6.72e-04 | 28 |
| GO:19037069 | Breast | Precancer | regulation of hemopoiesis | 41/1080 | 367/18723 | 3.95e-05 | 8.52e-04 | 41 |
| GO:00025737 | Breast | Precancer | myeloid leukocyte differentiation | 27/1080 | 208/18723 | 6.72e-05 | 1.35e-03 | 27 |
| GO:00488729 | Breast | Precancer | homeostasis of number of cells | 32/1080 | 272/18723 | 1.03e-04 | 1.89e-03 | 32 |
| GO:19021055 | Breast | Precancer | regulation of leukocyte differentiation | 32/1080 | 279/18723 | 1.66e-04 | 2.74e-03 | 32 |
| GO:00302189 | Breast | Precancer | erythrocyte differentiation | 18/1080 | 120/18723 | 1.76e-04 | 2.87e-03 | 18 |
| GO:19031313 | Breast | Precancer | mononuclear cell differentiation | 43/1080 | 426/18723 | 2.61e-04 | 3.84e-03 | 43 |
| GO:00085445 | Breast | Precancer | epidermis development | 35/1080 | 324/18723 | 2.71e-04 | 3.96e-03 | 35 |
| GO:00027613 | Breast | Precancer | regulation of myeloid leukocyte differentiation | 17/1080 | 120/18723 | 5.23e-04 | 6.74e-03 | 17 |
| GO:19021063 | Breast | Precancer | negative regulation of leukocyte differentiation | 15/1080 | 102/18723 | 7.34e-04 | 8.80e-03 | 15 |
| GO:00454444 | Breast | Precancer | fat cell differentiation | 26/1080 | 229/18723 | 7.60e-04 | 9.04e-03 | 26 |
| GO:0048538 | Breast | Precancer | thymus development | 9/1080 | 45/18723 | 9.22e-04 | 1.05e-02 | 9 |
| GO:19037073 | Breast | Precancer | negative regulation of hemopoiesis | 15/1080 | 106/18723 | 1.10e-03 | 1.22e-02 | 15 |
| GO:00456467 | Breast | Precancer | regulation of erythrocyte differentiation | 9/1080 | 47/18723 | 1.28e-03 | 1.36e-02 | 9 |
| Page: 1 2 3 4 5 6 7 8 9 10 11 12 13 14 15 16 17 18 19 20 21 22 23 |
| Pathway ID | Tissue | Disease Stage | Description | Gene Ratio | Bg Ratio | pvalue | p.adjust | qvalue | Count |
| hsa052028 | Esophagus | ESCC | Transcriptional misregulation in cancer | 116/4205 | 193/8465 | 2.08e-03 | 5.95e-03 | 3.05e-03 | 116 |
| hsa046585 | Esophagus | ESCC | Th1 and Th2 cell differentiation | 58/4205 | 92/8465 | 6.49e-03 | 1.60e-02 | 8.19e-03 | 58 |
| hsa0520213 | Esophagus | ESCC | Transcriptional misregulation in cancer | 116/4205 | 193/8465 | 2.08e-03 | 5.95e-03 | 3.05e-03 | 116 |
| hsa0465812 | Esophagus | ESCC | Th1 and Th2 cell differentiation | 58/4205 | 92/8465 | 6.49e-03 | 1.60e-02 | 8.19e-03 | 58 |
| hsa046584 | Oral cavity | OSCC | Th1 and Th2 cell differentiation | 53/3704 | 92/8465 | 5.00e-03 | 1.20e-02 | 6.13e-03 | 53 |
| hsa0465811 | Oral cavity | OSCC | Th1 and Th2 cell differentiation | 53/3704 | 92/8465 | 5.00e-03 | 1.20e-02 | 6.13e-03 | 53 |
| Page: 1 |
Top |
Cell-cell communication analysis |
| Identification of potential cell-cell interactions between two cell types and their ligand-receptor pairs for different disease states |
| Ligand | Receptor | LRpair | Pathway | Tissue | Disease Stage |
| Page: 1 |
Top |
Single-cell gene regulatory network inference analysis |
| Find out the significant the regulons (TFs) and the target genes of each regulon across cell types for different disease states |
| TF | Cell Type | Tissue | Disease Stage | Target Gene | RSS | Regulon Activity |
| MAF | TREG | Breast | DCIS | SELENOP,ITM2A,CORO1B, etc. | 2.39e-01 |  |
| MAF | TREG | Breast | Healthy | SELENOP,ITM2A,CORO1B, etc. | 6.16e-02 |  |
| MAF | TREG | Breast | IDC | SELENOP,ITM2A,CORO1B, etc. | 1.97e-01 |  |
| MAF | IMENT | Colorectum | AD | FABP2,SLC28A1,ALPI, etc. | 1.44e-01 |  |
| MAF | SSC | Colorectum | Healthy | LGMN,MGAM,SOX13, etc. | 1.03e-01 |  |
| MAF | IMENT | Colorectum | SER | FABP2,SLC28A1,ALPI, etc. | 1.82e-01 |  |
| MAF | LYMEND | Colorectum | ADJ | GSN,CFD,LUM, etc. | 1.54e-01 |  |
| MAF | LYMEND | Colorectum | FAP | GSN,CFD,LUM, etc. | 8.28e-02 |  |
| MAF | LYMEND | Colorectum | Healthy | GSN,CFD,LUM, etc. | 1.10e-01 | |
| MAF | TREG | Endometrium | EEC | CD4,SPOCK2,CD40LG, etc. | 1.35e-01 |  |
| ∗The dot plots of a searched regulon are shown for all cell subpopulations in each disease state of each tissue based on the regulon specific score inferred using pySCENIC and by calculating the average expression. |
| Page: 1 2 3 4 5 6 |
Top |
Somatic mutation of malignant transformation related genes |
| Annotation of somatic variants for genes involved in malignant transformation |
| Hugo Symbol | Variant Class | Variant Classification | dbSNP RS | HGVSc | HGVSp | HGVSp Short | SWISSPROT | BIOTYPE | SIFT | PolyPhen | Tumor Sample Barcode | Tissue | Histology | Sex | Age | Stage | Therapy Types | Drugs | Outcome |
| MAF | SNV | Missense_Mutation | novel | c.1082C>T | p.Ser361Leu | p.S361L | O75444 | protein_coding | deleterious(0) | possibly_damaging(0.902) | TCGA-VS-A8EI-01 | Cervix | cervical & endocervical cancer | Female | <65 | I/II | Chemotherapy | cisplatin | CR |
| MAF | SNV | Missense_Mutation | rs377735141 | c.1159N>A | p.Ala387Thr | p.A387T | O75444 | protein_coding | tolerated_low_confidence(0.16) | benign(0) | TCGA-AA-3492-01 | Colorectum | colon adenocarcinoma | Female | >=65 | I/II | Unknown | Unknown | SD |
| MAF | SNV | Missense_Mutation | rs759815012 | c.314N>T | p.Ala105Val | p.A105V | O75444 | protein_coding | tolerated(0.08) | probably_damaging(0.92) | TCGA-AA-3713-01 | Colorectum | colon adenocarcinoma | Male | >=65 | III/IV | Chemotherapy | 5-fluorouracil | PR |
| MAF | SNV | Missense_Mutation | c.1015N>T | p.Arg339Cys | p.R339C | O75444 | protein_coding | deleterious(0) | probably_damaging(0.998) | TCGA-AA-3715-01 | Colorectum | colon adenocarcinoma | Male | >=65 | I/II | Unknown | Unknown | PD | |
| MAF | SNV | Missense_Mutation | novel | c.842N>G | p.Val281Gly | p.V281G | O75444 | protein_coding | deleterious(0.01) | probably_damaging(0.92) | TCGA-AA-A022-01 | Colorectum | colon adenocarcinoma | Female | >=65 | I/II | Unknown | Unknown | SD |
| MAF | SNV | Missense_Mutation | c.227C>T | p.Pro76Leu | p.P76L | O75444 | protein_coding | deleterious(0) | benign(0.203) | TCGA-AD-6895-01 | Colorectum | colon adenocarcinoma | Male | >=65 | III/IV | Unknown | Unknown | SD | |
| MAF | SNV | Missense_Mutation | c.58G>A | p.Glu20Lys | p.E20K | O75444 | protein_coding | deleterious(0) | possibly_damaging(0.807) | TCGA-AZ-6598-01 | Colorectum | colon adenocarcinoma | Female | >=65 | I/II | Unknown | Unknown | SD | |
| MAF | SNV | Missense_Mutation | c.1097N>T | p.Pro366Leu | p.P366L | O75444 | protein_coding | deleterious(0) | probably_damaging(0.978) | TCGA-D5-6928-01 | Colorectum | colon adenocarcinoma | Male | >=65 | I/II | Unknown | Unknown | SD | |
| MAF | SNV | Missense_Mutation | novel | c.929T>C | p.Val310Ala | p.V310A | O75444 | protein_coding | deleterious(0) | probably_damaging(0.967) | TCGA-WS-AB45-01 | Colorectum | colon adenocarcinoma | Female | <65 | I/II | Unknown | Unknown | SD |
| MAF | deletion | Frame_Shift_Del | novel | c.206delC | p.Pro69LeufsTer26 | p.P69Lfs*26 | O75444 | protein_coding | TCGA-AA-3947-01 | Colorectum | colon adenocarcinoma | Female | <65 | I/II | Unknown | Unknown | SD |
| Page: 1 2 3 4 |
Top |
Related drugs of malignant transformation related genes |
| Identification of chemicals and drugs interact with genes involved in malignant transfromation |
| (DGIdb 4.0) |
| Entrez ID | Symbol | Category | Interaction Types | Drug Claim Name | Drug Name | PMIDs |
| Page: 1 |

Copyright 2023-Present -The University of Texas Health Science Center at Houston |