Schematic overview of the cellular and molecular mechanisms involved in the cancer progression, including the proposed cellular and molecular mechanisms in cancer cells trajectory. AT1: alveolar type 1 cells; AT2: alveolar type 2 cells; AAH: atypical adenomatous hyperplasia; AIS: adenocarcinoma in situ; MIA: minimally invasive adenocarcinoma; IA: invasive adenocarcinoma; EMT: epithelial-mesenchymal transition

Home

Download

Statistics

Help

Contact

Center for Computational Systems Medicine
leaf

Gene summary

leaf

Malignant transformation analysis

leaf

Malignant transformation related pathway analysis

leaf

Cell-cell communication analysis

leaf

Single-cell gene regulatory network inference analysis

leaf

Somatic mutation of malignant transformation related genes

leaf

Related drugs of malignant transformation related genes

Gene: MAEA

Gene summary for MAEA

check button Gene summary.

Gene informationSpeciesHuman
Gene symbol

MAEA

Gene ID

10296

Gene namemacrophage erythroblast attacher, E3 ubiquitin ligase
Gene AliasEMLP
Cytomap4p16.3
Gene Typeprotein-coding
GO ID

GO:0000278

UniProtAcc

B3KRN7


Top

Malignant transformation analysis

check button Identification of the aberrant gene expression in precancerous and cancerous lesions by comparing the gene expression of stem-like cells in diseased tissues with normal stem cells
check button Malignant transformation involving gene list.
Entrez IDSymbolReplicatesSpeciesOrganTissueAdj P-valueLog2FCMalignancy
10296MAEALZE2THumanEsophagusESCC4.97e-021.80e-010.082
10296MAEALZE4THumanEsophagusESCC2.12e-02-3.95e-020.0811
10296MAEALZE7THumanEsophagusESCC3.80e-023.48e-010.0667
10296MAEALZE8THumanEsophagusESCC1.52e-053.43e-010.067
10296MAEALZE20THumanEsophagusESCC1.82e-092.71e-010.0662
10296MAEALZE22D1HumanEsophagusHGIN4.85e-059.10e-020.0595
10296MAEALZE22THumanEsophagusESCC5.37e-032.07e-010.068
10296MAEALZE24THumanEsophagusESCC1.09e-131.24e-010.0596
10296MAEAP1T-EHumanEsophagusESCC9.56e-102.70e-010.0875
10296MAEAP2T-EHumanEsophagusESCC2.34e-376.43e-010.1177
10296MAEAP4T-EHumanEsophagusESCC9.78e-143.04e-010.1323
10296MAEAP5T-EHumanEsophagusESCC9.90e-111.24e-010.1327
10296MAEAP8T-EHumanEsophagusESCC4.67e-244.39e-010.0889
10296MAEAP9T-EHumanEsophagusESCC2.37e-171.86e-010.1131
10296MAEAP10T-EHumanEsophagusESCC3.19e-244.26e-010.116
10296MAEAP11T-EHumanEsophagusESCC7.86e-144.68e-010.1426
10296MAEAP12T-EHumanEsophagusESCC2.69e-193.65e-010.1122
10296MAEAP15T-EHumanEsophagusESCC1.82e-152.92e-010.1149
10296MAEAP16T-EHumanEsophagusESCC6.04e-276.09e-010.1153
10296MAEAP17T-EHumanEsophagusESCC2.24e-126.74e-010.1278
Page: 1 2 3 4 5 6 

check button Transcriptomic changes along malignancy continuum.
TissueExpression DynamicsAbbreviation
EsophagusThe image shows the transcriptomic changes along malignancy continuum.log2FC in expression of this searched gene in stem-like cells from each diseased tissue sample relative to stem-like cells in normal samples in each tissue plotted against the malignancy continuum. Samples are colored based on if they are from different disease stage.ESCC: Esophageal squamous cell carcinoma
HGIN: High-grade intraepithelial neoplasias
LGIN: Low-grade intraepithelial neoplasias
LiverThe image shows the transcriptomic changes along malignancy continuum.log2FC in expression of this searched gene in stem-like cells from each diseased tissue sample relative to stem-like cells in normal samples in each tissue plotted against the malignancy continuum. Samples are colored based on if they are from different disease stage.
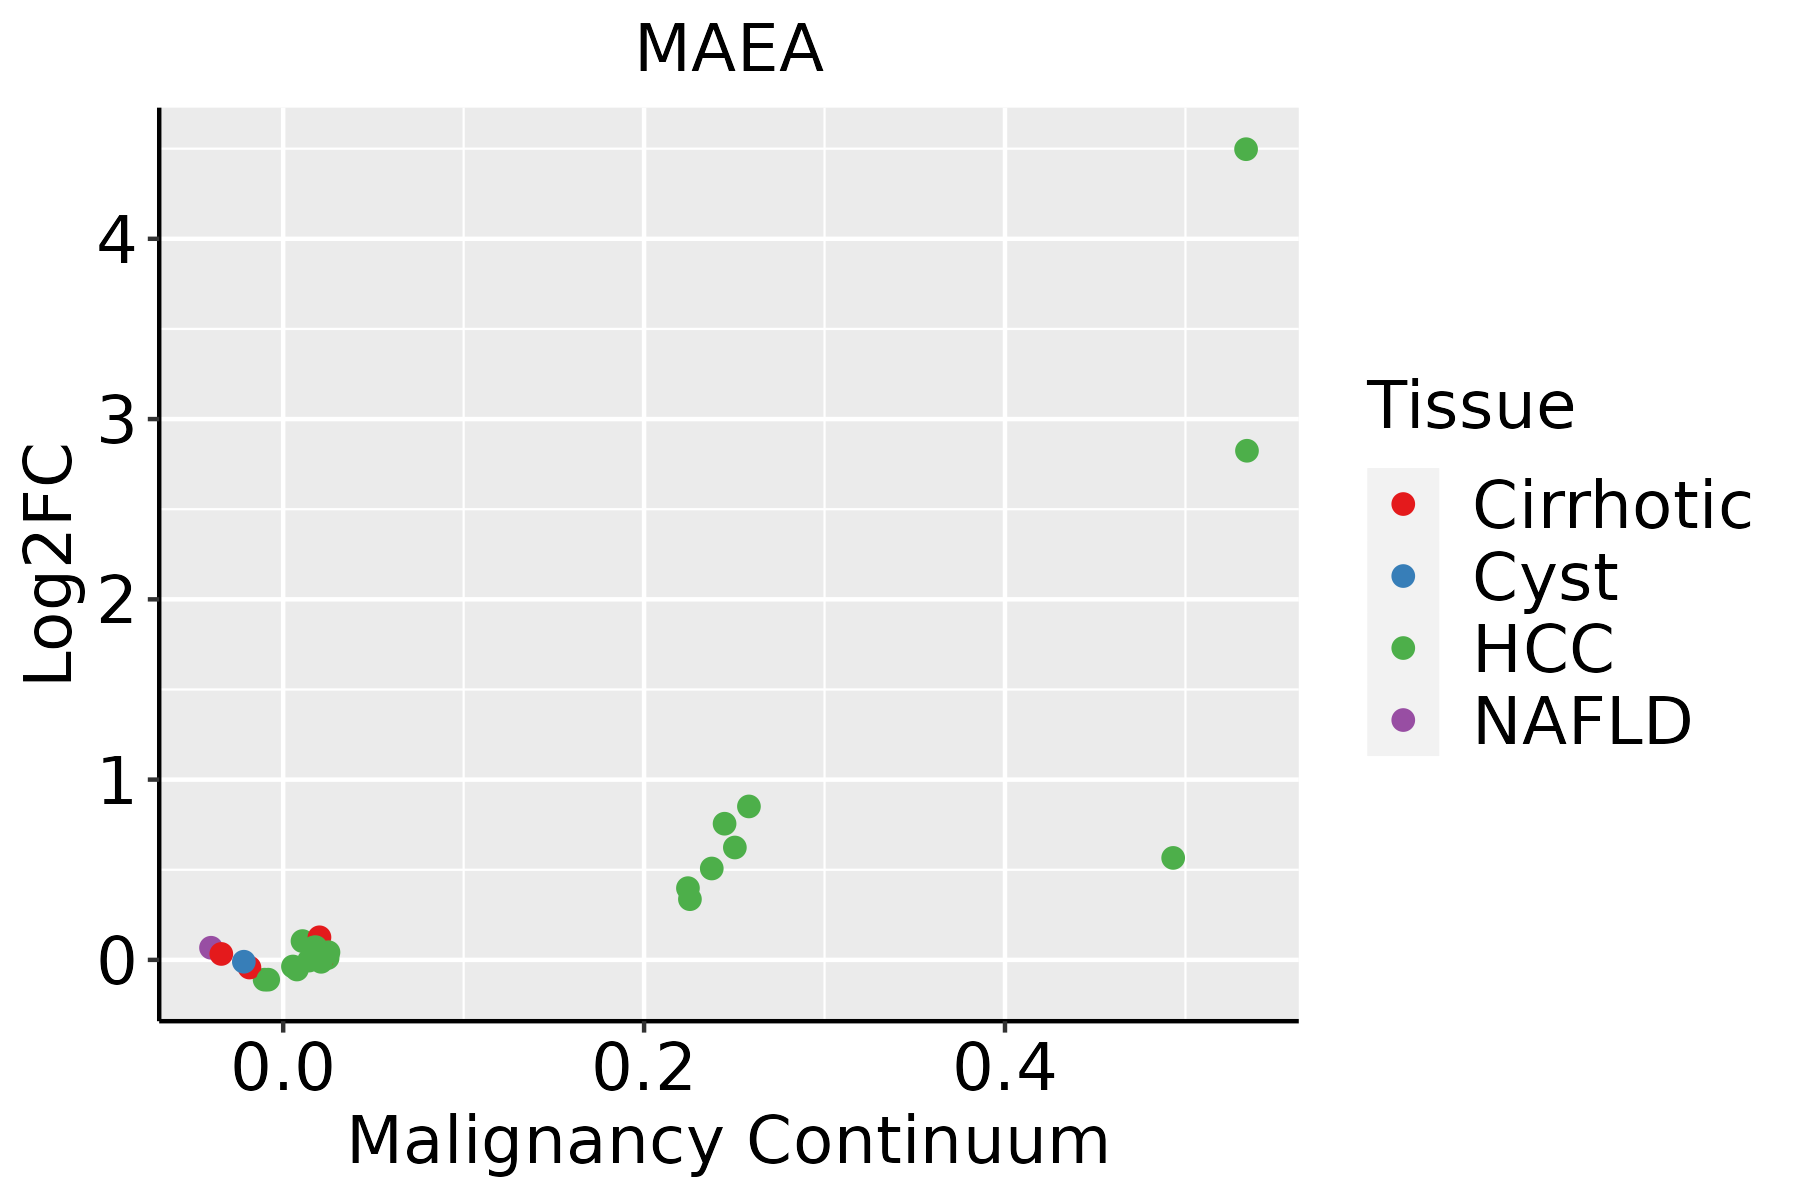
HCC: Hepatocellular carcinoma
NAFLD: Non-alcoholic fatty liver disease
Oral CavityThe image shows the transcriptomic changes along malignancy continuum.log2FC in expression of this searched gene in stem-like cells from each diseased tissue sample relative to stem-like cells in normal samples in each tissue plotted against the malignancy continuum. Samples are colored based on if they are from different disease stage.
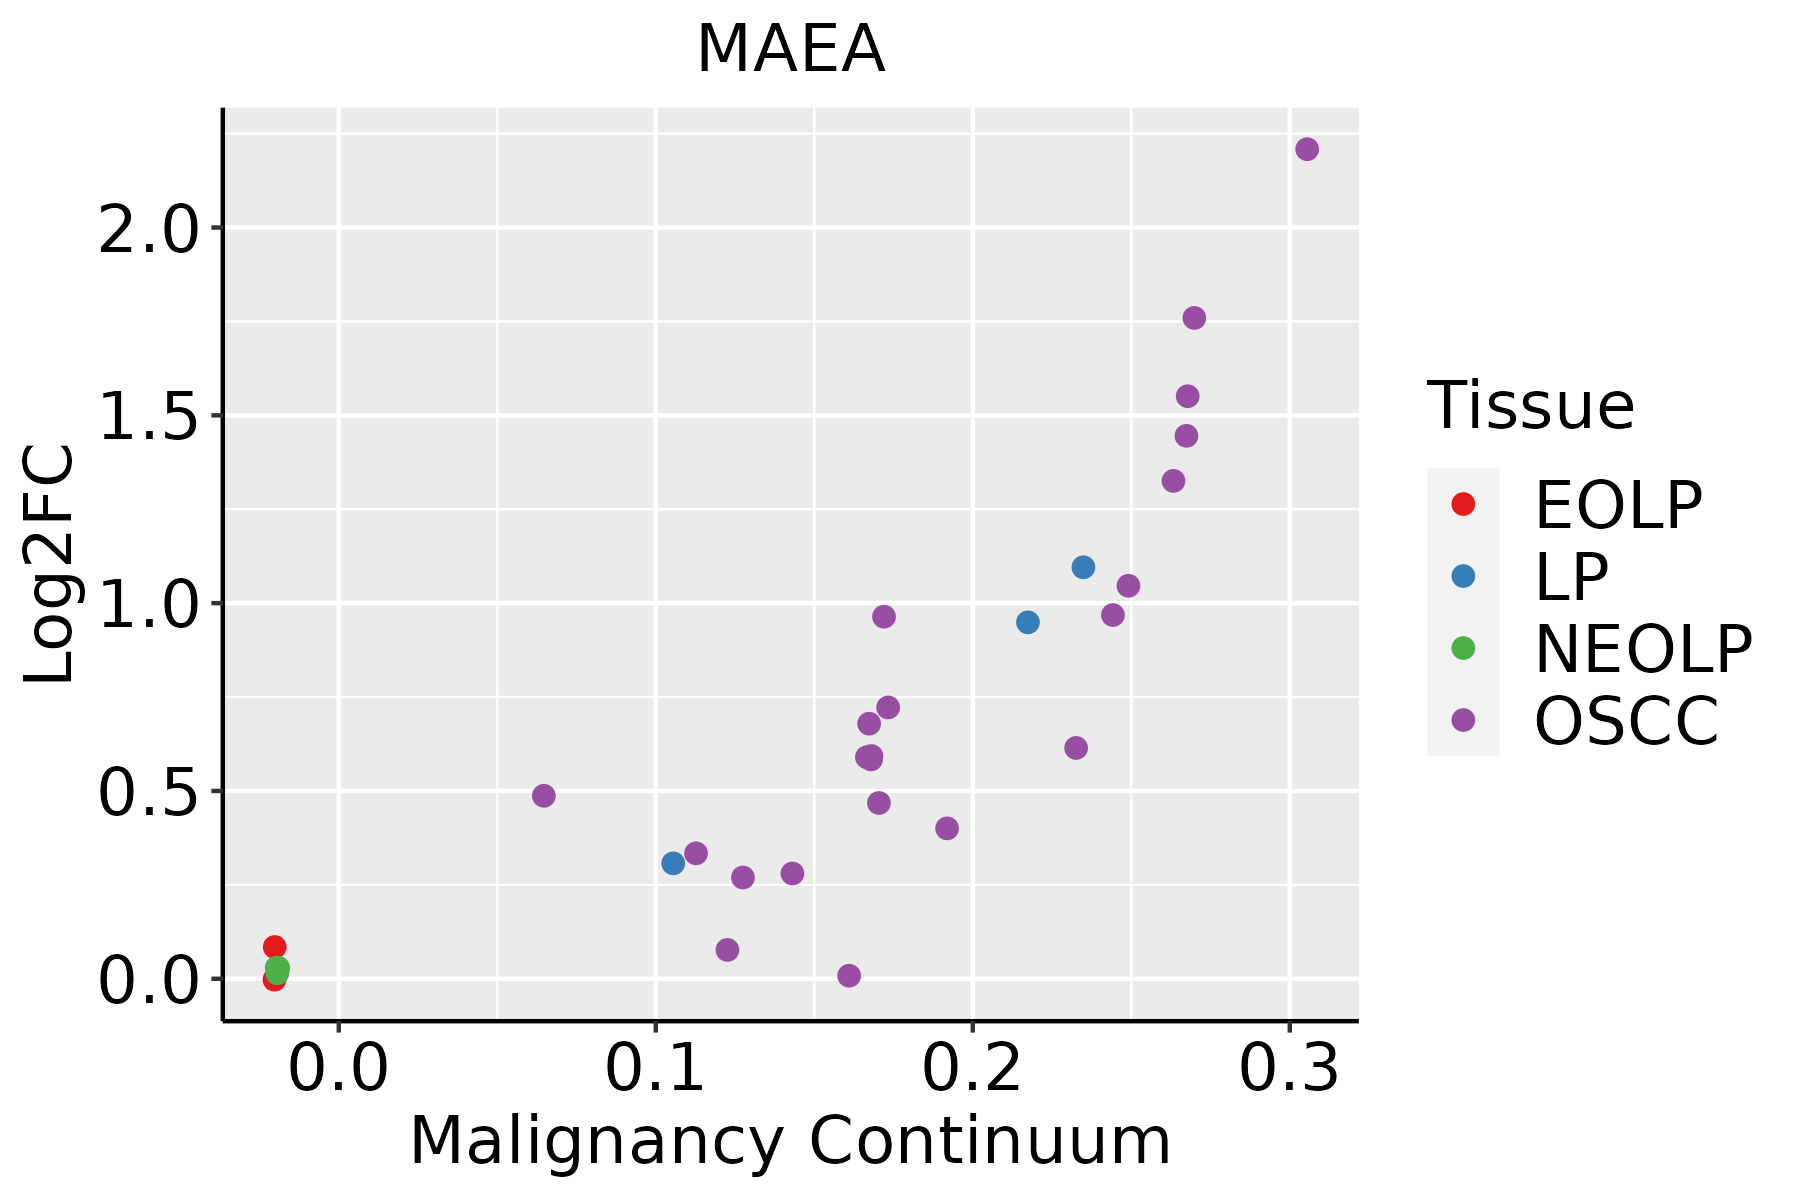
EOLP: Erosive Oral lichen planus
LP: leukoplakia
NEOLP: Non-erosive oral lichen planus
OSCC: Oral squamous cell carcinoma
SkinThe image shows the transcriptomic changes along malignancy continuum.log2FC in expression of this searched gene in stem-like cells from each diseased tissue sample relative to stem-like cells in normal samples in each tissue plotted against the malignancy continuum. Samples are colored based on if they are from different disease stage.
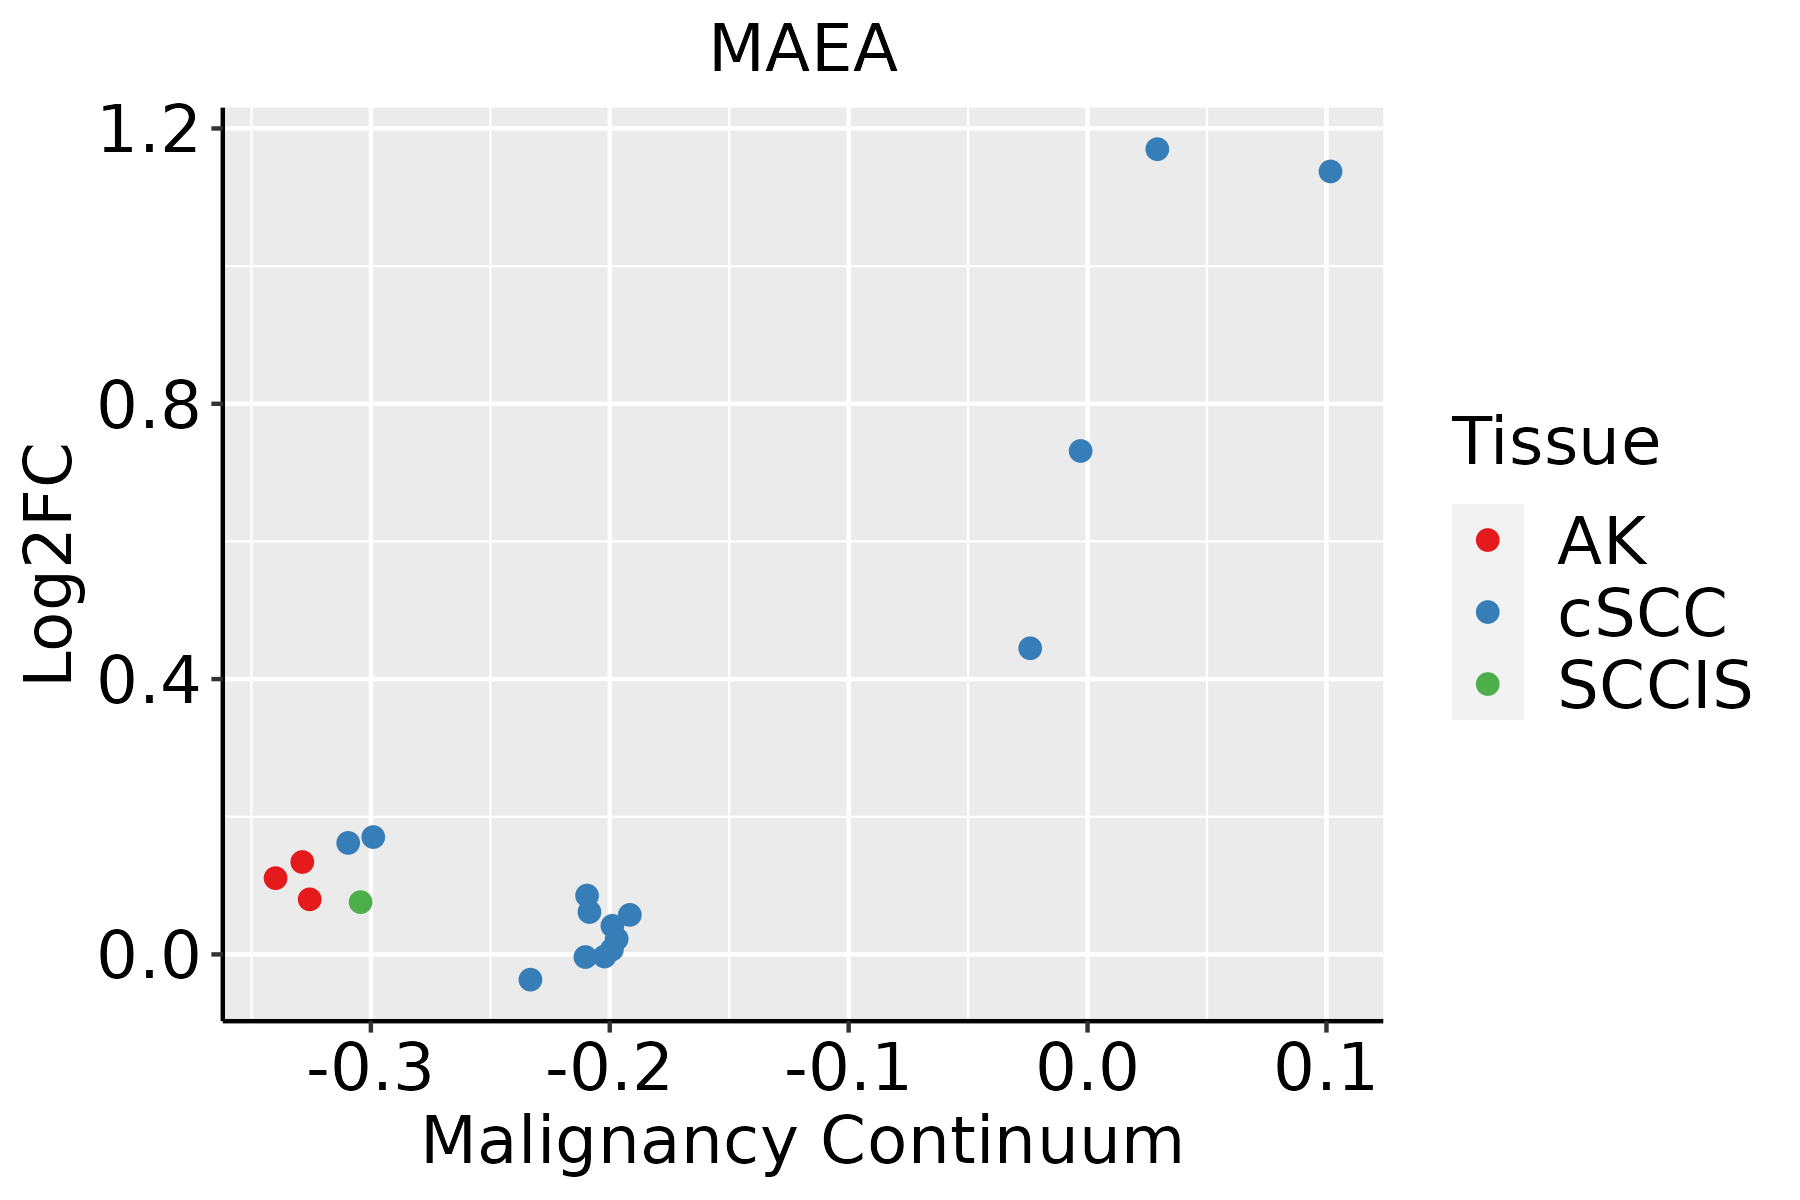
AK: Actinic keratosis
cSCC: Cutaneous squamous cell carcinoma
SCCIS:squamous cell carcinoma in situ
ThyroidThe image shows the transcriptomic changes along malignancy continuum.log2FC in expression of this searched gene in stem-like cells from each diseased tissue sample relative to stem-like cells in normal samples in each tissue plotted against the malignancy continuum. Samples are colored based on if they are from different disease stage.ATC: Anaplastic thyroid cancer
HT: Hashimoto's thyroiditis
PTC: Papillary thyroid cancer
∗log2FC in expression of this searched gene in stem-like cells from each diseased tissue sample relative to stem-like cells in normal samples in each tissue plotted against the malignancy continuum. Samples are colored based on if they are from different disease stage.

Top

Malignant transformation related pathway analysis

check buttonFind out the enriched GO biological processes and KEGG pathways involved in transition from healthy to precancer to cancer
check button Figure of enriched GO biological processes.
TissueDisease StageEnriched GO biological Processes
ColorectumADGO analysis - Figure of enriched GO biological processes: Top 15 enriched GO BP terms are showed in the bar plot of each disease state in each tissue. Each row represents a significant GO biological process which is colored according to the -log10(p.adjust).
ColorectumSERGO analysis - Figure of enriched GO biological processes: Top 15 enriched GO BP terms are showed in the bar plot of each disease state in each tissue. Each row represents a significant GO biological process which is colored according to the -log10(p.adjust).
ColorectumMSSGO analysis - Figure of enriched GO biological processes: Top 15 enriched GO BP terms are showed in the bar plot of each disease state in each tissue. Each row represents a significant GO biological process which is colored according to the -log10(p.adjust).
ColorectumMSI-HGO analysis - Figure of enriched GO biological processes: Top 15 enriched GO BP terms are showed in the bar plot of each disease state in each tissue. Each row represents a significant GO biological process which is colored according to the -log10(p.adjust).
ColorectumFAPGO analysis - Figure of enriched GO biological processes: Top 15 enriched GO BP terms are showed in the bar plot of each disease state in each tissue. Each row represents a significant GO biological process which is colored according to the -log10(p.adjust).
∗Top 15 enriched GO BP terms are showed in the bar plot of each disease state in each tissue. Each row represents a significant GO biological process which is colored according to the -log10(p.adjust).
Page: 1 2 3 4 5 6 7 8 9 

check button Enriched GO biological processes.
GO IDTissueDisease StageDescriptionGene RatioBg Ratiopvaluep.adjustCount
GO:001049826EsophagusHGINproteasomal protein catabolic process139/2587490/187231.20e-173.41e-15139
GO:004316126EsophagusHGINproteasome-mediated ubiquitin-dependent protein catabolic process114/2587412/187237.00e-141.20e-11114
GO:000734610EsophagusHGINregulation of mitotic cell cycle98/2587457/187234.39e-061.42e-0498
GO:003009927EsophagusHGINmyeloid cell differentiation83/2587381/187231.26e-053.52e-0483
GO:003410127EsophagusHGINerythrocyte homeostasis34/2587129/187231.16e-042.43e-0334
GO:003021826EsophagusHGINerythrocyte differentiation31/2587120/187233.35e-045.50e-0331
GO:000226227EsophagusHGINmyeloid cell homeostasis37/2587157/187236.63e-049.04e-0337
GO:004887227EsophagusHGINhomeostasis of number of cells54/2587272/187233.50e-033.23e-0254
GO:0010498111EsophagusESCCproteasomal protein catabolic process369/8552490/187231.13e-411.80e-38369
GO:0043161111EsophagusESCCproteasome-mediated ubiquitin-dependent protein catabolic process312/8552412/187233.53e-364.48e-33312
GO:000734615EsophagusESCCregulation of mitotic cell cycle293/8552457/187238.00e-165.64e-14293
GO:0030099111EsophagusESCCmyeloid cell differentiation232/8552381/187231.22e-092.90e-08232
GO:0002262111EsophagusESCCmyeloid cell homeostasis104/8552157/187231.49e-072.36e-06104
GO:0034101111EsophagusESCCerythrocyte homeostasis88/8552129/187231.81e-072.84e-0688
GO:0048872111EsophagusESCChomeostasis of number of cells163/8552272/187231.40e-061.69e-05163
GO:0030218111EsophagusESCCerythrocyte differentiation80/8552120/187232.69e-063.08e-0580
GO:001049822LiverHCCproteasomal protein catabolic process351/7958490/187236.92e-401.46e-36351
GO:004316122LiverHCCproteasome-mediated ubiquitin-dependent protein catabolic process299/7958412/187237.82e-368.27e-33299
GO:000734611LiverHCCregulation of mitotic cell cycle255/7958457/187234.96e-091.30e-07255
GO:003410122LiverHCCerythrocyte homeostasis79/7958129/187231.32e-051.47e-0479
Page: 1 2 3 4 

check button Enriched KEGG pathways.
Pathway IDTissueDisease StageDescriptionGene RatioBg Ratiopvaluep.adjustqvalueCount
Page: 1 

Top

Cell-cell communication analysis

check buttonIdentification of potential cell-cell interactions between two cell types and their ligand-receptor pairs for different disease states
LigandReceptorLRpairPathwayTissueDisease Stage
Page: 1 

Top

Single-cell gene regulatory network inference analysis

check buttonFind out the significant the regulons (TFs) and the target genes of each regulon across cell types for different disease states
TFCell TypeTissueDisease StageTarget GeneRSSRegulon Activity
∗The dot plots of a searched regulon are shown for all cell subpopulations in each disease state of each tissue based on the regulon specific score inferred using pySCENIC and by calculating the average expression.
Page: 1 

Top

Somatic mutation of malignant transformation related genes

check buttonAnnotation of somatic variants for genes involved in malignant transformation
Hugo SymbolVariant ClassVariant ClassificationdbSNP RSHGVScHGVSpHGVSp ShortSWISSPROTBIOTYPESIFTPolyPhenTumor Sample BarcodeTissueHistologySexAgeStageTherapy TypesDrugsOutcome
MAEASNVMissense_Mutationnovelc.287N>Gp.Ala96Glyp.A96GQ7L5Y9protein_codingtolerated(0.31)benign(0.009)TCGA-BH-A0EE-01Breastbreast invasive carcinomaFemale>=65I/IIChemotherapydocetaxelSD
MAEAinsertionIn_Frame_Insnovelc.272_273insAGCACAGGCCTGGAAp.Ala91_Glu92insAlaGlnAlaTrpAsnp.A91_E92insAQAWNQ7L5Y9protein_codingTCGA-AN-A0FF-01Breastbreast invasive carcinomaFemale<65I/IIUnknownUnknownSD
MAEAinsertionNonsense_Mutationnovelc.274_275insTTTCTATCTAGCCCGATTCATTTTTp.Glu92ValfsTer4p.E92Vfs*4Q7L5Y9protein_codingTCGA-AN-A0FF-01Breastbreast invasive carcinomaFemale<65I/IIUnknownUnknownSD
MAEAinsertionFrame_Shift_Insnovelc.285_286insACTTCCAAAGGp.Ala96ThrfsTer37p.A96Tfs*37Q7L5Y9protein_codingTCGA-BH-A0EE-01Breastbreast invasive carcinomaFemale>=65I/IIChemotherapydocetaxelSD
MAEASNVMissense_Mutationnovelc.973G>Ap.Ala325Thrp.A325TQ7L5Y9protein_codingdeleterious(0.02)benign(0.366)TCGA-2W-A8YY-01Cervixcervical & endocervical cancerFemale<65I/IIChemotherapycisplatinCR
MAEASNVMissense_Mutationc.520N>Ap.Glu174Lysp.E174KQ7L5Y9protein_codingtolerated(0.13)possibly_damaging(0.688)TCGA-IR-A3LA-01Cervixcervical & endocervical cancerFemale<65I/IIChemotherapycisplatinCR
MAEASNVMissense_Mutationrs765652453c.371N>Ap.Arg124Hisp.R124HQ7L5Y9protein_codingdeleterious(0.03)probably_damaging(0.972)TCGA-AA-3715-01Colorectumcolon adenocarcinomaMale>=65I/IIUnknownUnknownPD
MAEASNVMissense_Mutationrs765652453c.371N>Ap.Arg124Hisp.R124HQ7L5Y9protein_codingdeleterious(0.03)probably_damaging(0.972)TCGA-AA-A01R-01Colorectumcolon adenocarcinomaMale<65III/IVChemotherapy5-fluorouracilPD
MAEASNVMissense_Mutationc.135N>Gp.Ser45Argp.S45RQ7L5Y9protein_codingtolerated(0.11)possibly_damaging(0.449)TCGA-AD-6895-01Colorectumcolon adenocarcinomaMale>=65III/IVUnknownUnknownSD
MAEASNVMissense_Mutationc.746N>Tp.Thr249Metp.T249MQ7L5Y9protein_codingdeleterious(0.01)possibly_damaging(0.838)TCGA-CM-6171-01Colorectumcolon adenocarcinomaFemale>=65I/IIUnknownUnknownSD
Page: 1 2 3 4 5 

Top

Related drugs of malignant transformation related genes

check buttonIdentification of chemicals and drugs interact with genes involved in malignant transfromation
(DGIdb 4.0)
Entrez IDSymbolCategoryInteraction TypesDrug Claim NameDrug NamePMIDs
Page: 1