
|
|||||
|
 | |
| |
| |
| |
| |
| |
|
Gene: MAD2L2 |
Gene summary for MAD2L2 |
| Gene information | Species | Human | Gene symbol | MAD2L2 | Gene ID | 10459 |
| Gene name | mitotic arrest deficient 2 like 2 | |
| Gene Alias | FANCV | |
| Cytomap | 1p36.22 | |
| Gene Type | protein-coding | GO ID | GO:0000018 | UniProtAcc | A0A024R4I4 |
Top |
Malignant transformation analysis |
| Identification of the aberrant gene expression in precancerous and cancerous lesions by comparing the gene expression of stem-like cells in diseased tissues with normal stem cells |
| Entrez ID | Symbol | Replicates | Species | Organ | Tissue | Adj P-value | Log2FC | Malignancy |
| 10459 | MAD2L2 | LZE2T | Human | Esophagus | ESCC | 3.89e-02 | 4.39e-01 | 0.082 |
| 10459 | MAD2L2 | LZE4T | Human | Esophagus | ESCC | 7.29e-04 | 2.04e-01 | 0.0811 |
| 10459 | MAD2L2 | LZE5T | Human | Esophagus | ESCC | 3.52e-03 | 3.90e-01 | 0.0514 |
| 10459 | MAD2L2 | LZE7T | Human | Esophagus | ESCC | 2.93e-18 | 9.03e-01 | 0.0667 |
| 10459 | MAD2L2 | LZE8T | Human | Esophagus | ESCC | 1.18e-08 | 4.04e-01 | 0.067 |
| 10459 | MAD2L2 | LZE20T | Human | Esophagus | ESCC | 4.75e-07 | 3.14e-01 | 0.0662 |
| 10459 | MAD2L2 | LZE22T | Human | Esophagus | ESCC | 2.93e-05 | 6.19e-01 | 0.068 |
| 10459 | MAD2L2 | LZE24T | Human | Esophagus | ESCC | 1.73e-16 | 5.73e-01 | 0.0596 |
| 10459 | MAD2L2 | LZE6T | Human | Esophagus | ESCC | 2.98e-14 | 8.40e-01 | 0.0845 |
| 10459 | MAD2L2 | P1T-E | Human | Esophagus | ESCC | 8.08e-12 | 6.21e-01 | 0.0875 |
| 10459 | MAD2L2 | P2T-E | Human | Esophagus | ESCC | 3.89e-76 | 1.46e+00 | 0.1177 |
| 10459 | MAD2L2 | P4T-E | Human | Esophagus | ESCC | 5.37e-37 | 9.02e-01 | 0.1323 |
| 10459 | MAD2L2 | P5T-E | Human | Esophagus | ESCC | 2.86e-45 | 8.62e-01 | 0.1327 |
| 10459 | MAD2L2 | P8T-E | Human | Esophagus | ESCC | 4.59e-25 | 4.91e-01 | 0.0889 |
| 10459 | MAD2L2 | P9T-E | Human | Esophagus | ESCC | 3.40e-22 | 5.32e-01 | 0.1131 |
| 10459 | MAD2L2 | P10T-E | Human | Esophagus | ESCC | 5.24e-52 | 9.87e-01 | 0.116 |
| 10459 | MAD2L2 | P11T-E | Human | Esophagus | ESCC | 2.60e-22 | 8.81e-01 | 0.1426 |
| 10459 | MAD2L2 | P12T-E | Human | Esophagus | ESCC | 2.75e-21 | 4.98e-01 | 0.1122 |
| 10459 | MAD2L2 | P15T-E | Human | Esophagus | ESCC | 8.01e-26 | 6.22e-01 | 0.1149 |
| 10459 | MAD2L2 | P16T-E | Human | Esophagus | ESCC | 2.89e-56 | 9.19e-01 | 0.1153 |
| Page: 1 2 3 4 5 6 |
| Tissue | Expression Dynamics | Abbreviation |
| Esophagus | 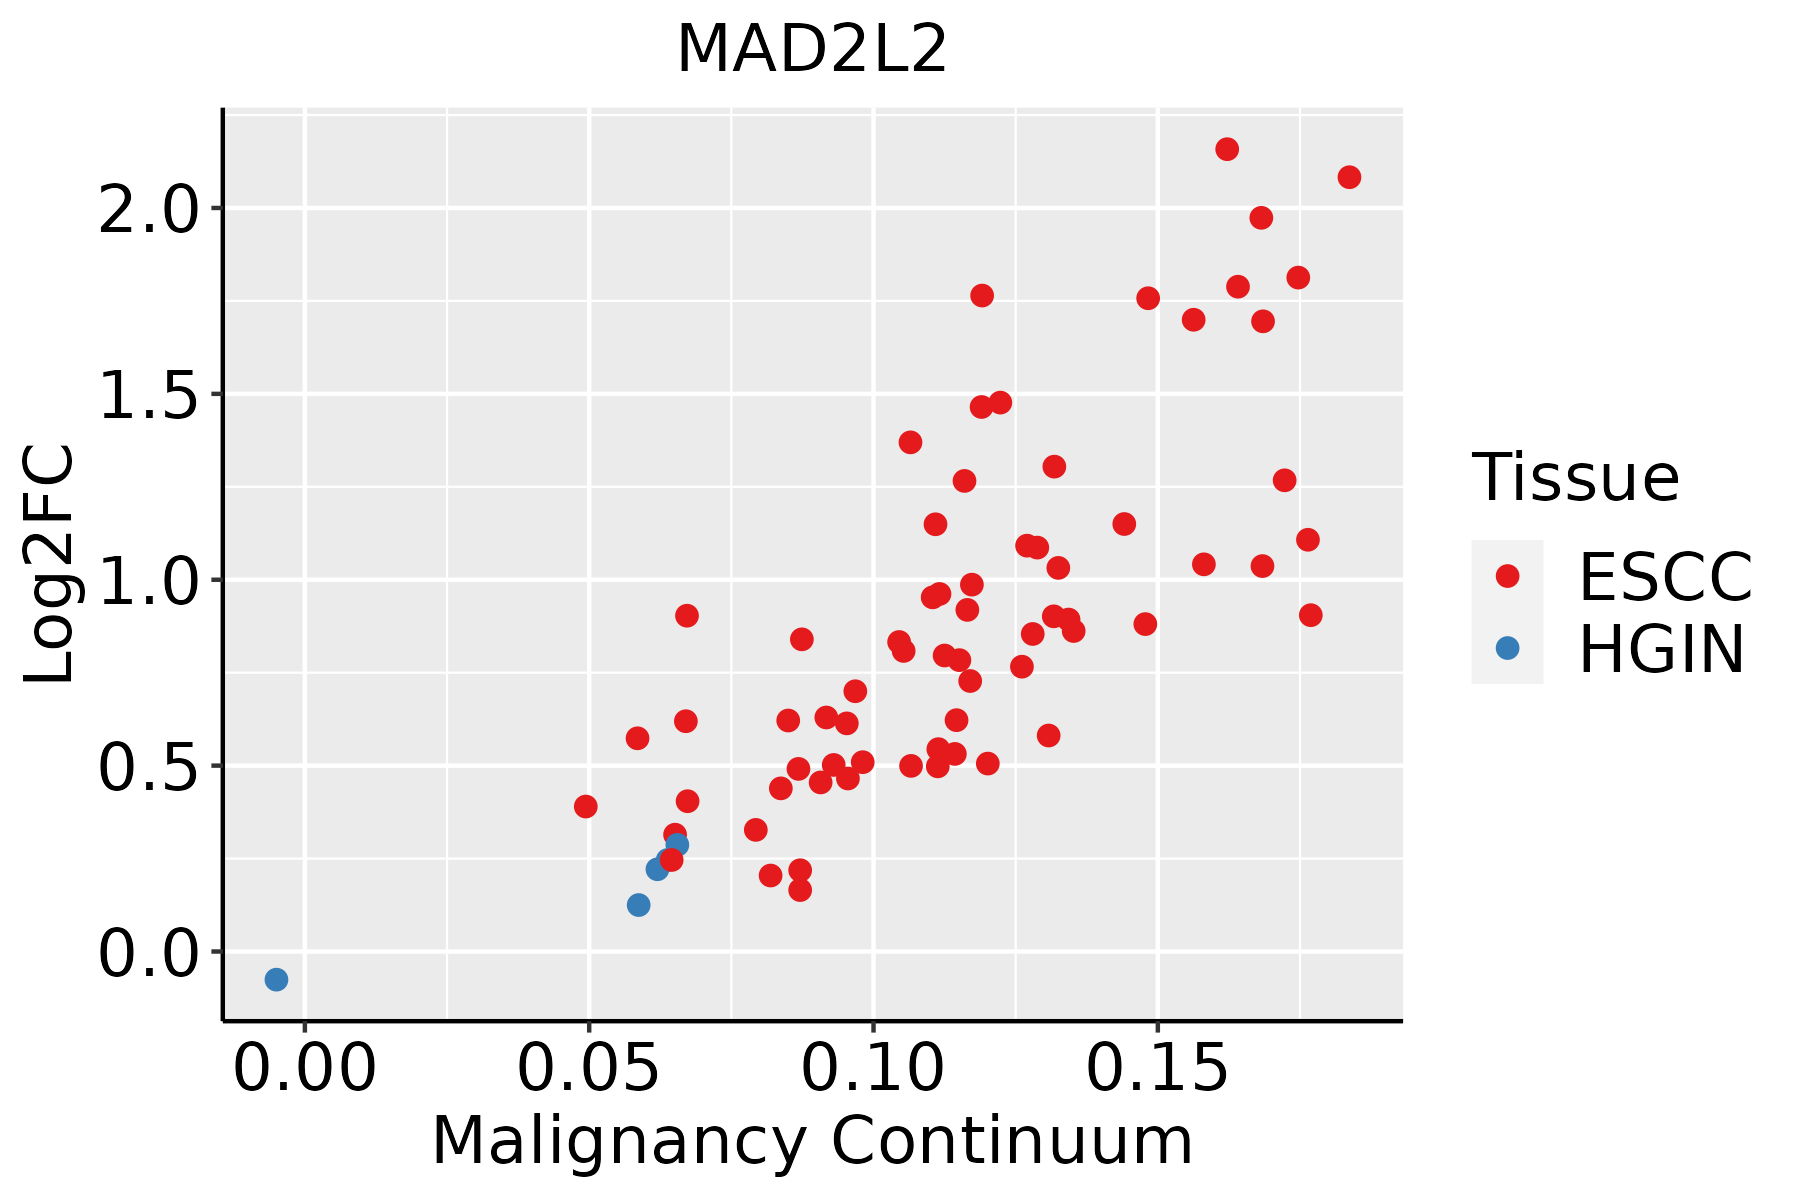 | ESCC: Esophageal squamous cell carcinoma |
| HGIN: High-grade intraepithelial neoplasias | ||
| LGIN: Low-grade intraepithelial neoplasias | ||
| Liver |  | HCC: Hepatocellular carcinoma |
| NAFLD: Non-alcoholic fatty liver disease | ||
| Oral Cavity | 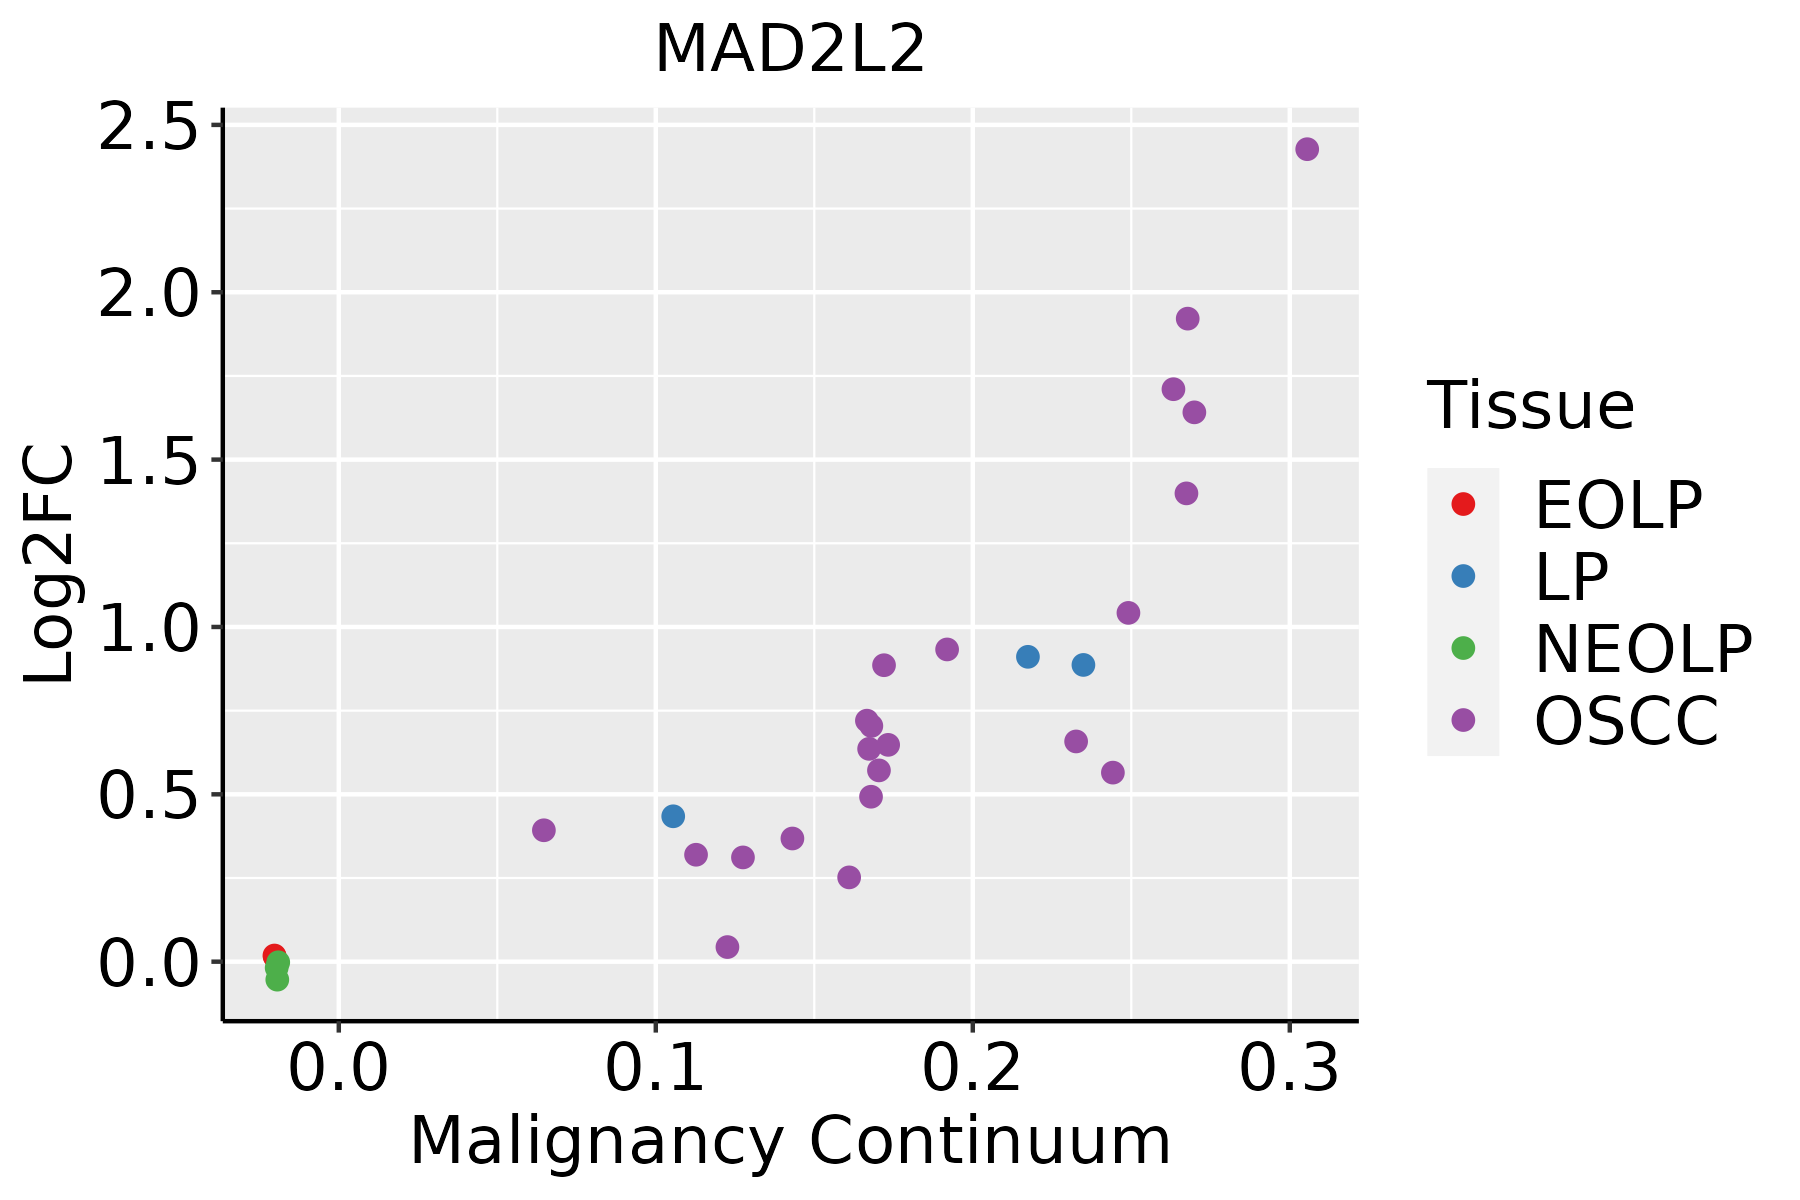 | EOLP: Erosive Oral lichen planus |
| LP: leukoplakia | ||
| NEOLP: Non-erosive oral lichen planus | ||
| OSCC: Oral squamous cell carcinoma | ||
| Skin | 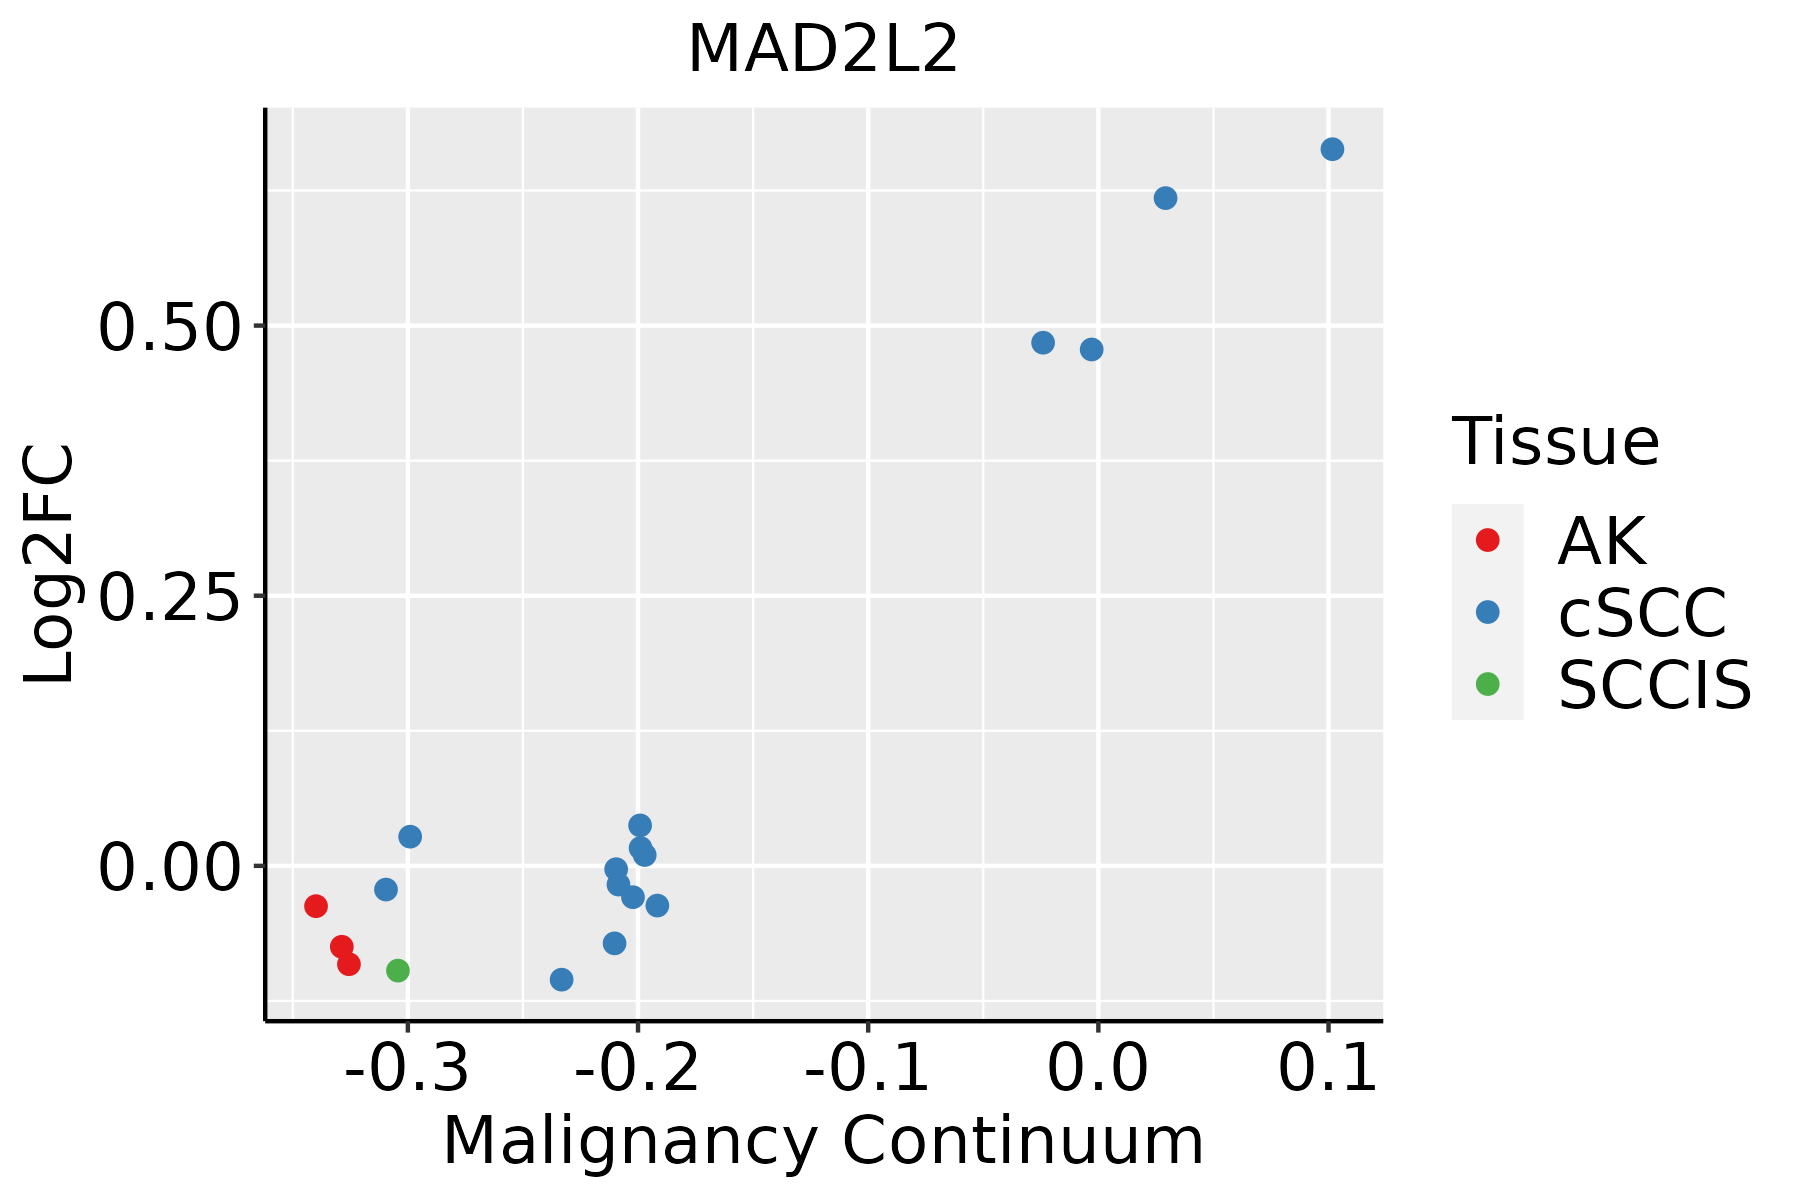 | AK: Actinic keratosis |
| cSCC: Cutaneous squamous cell carcinoma | ||
| SCCIS:squamous cell carcinoma in situ | ||
| Thyroid | 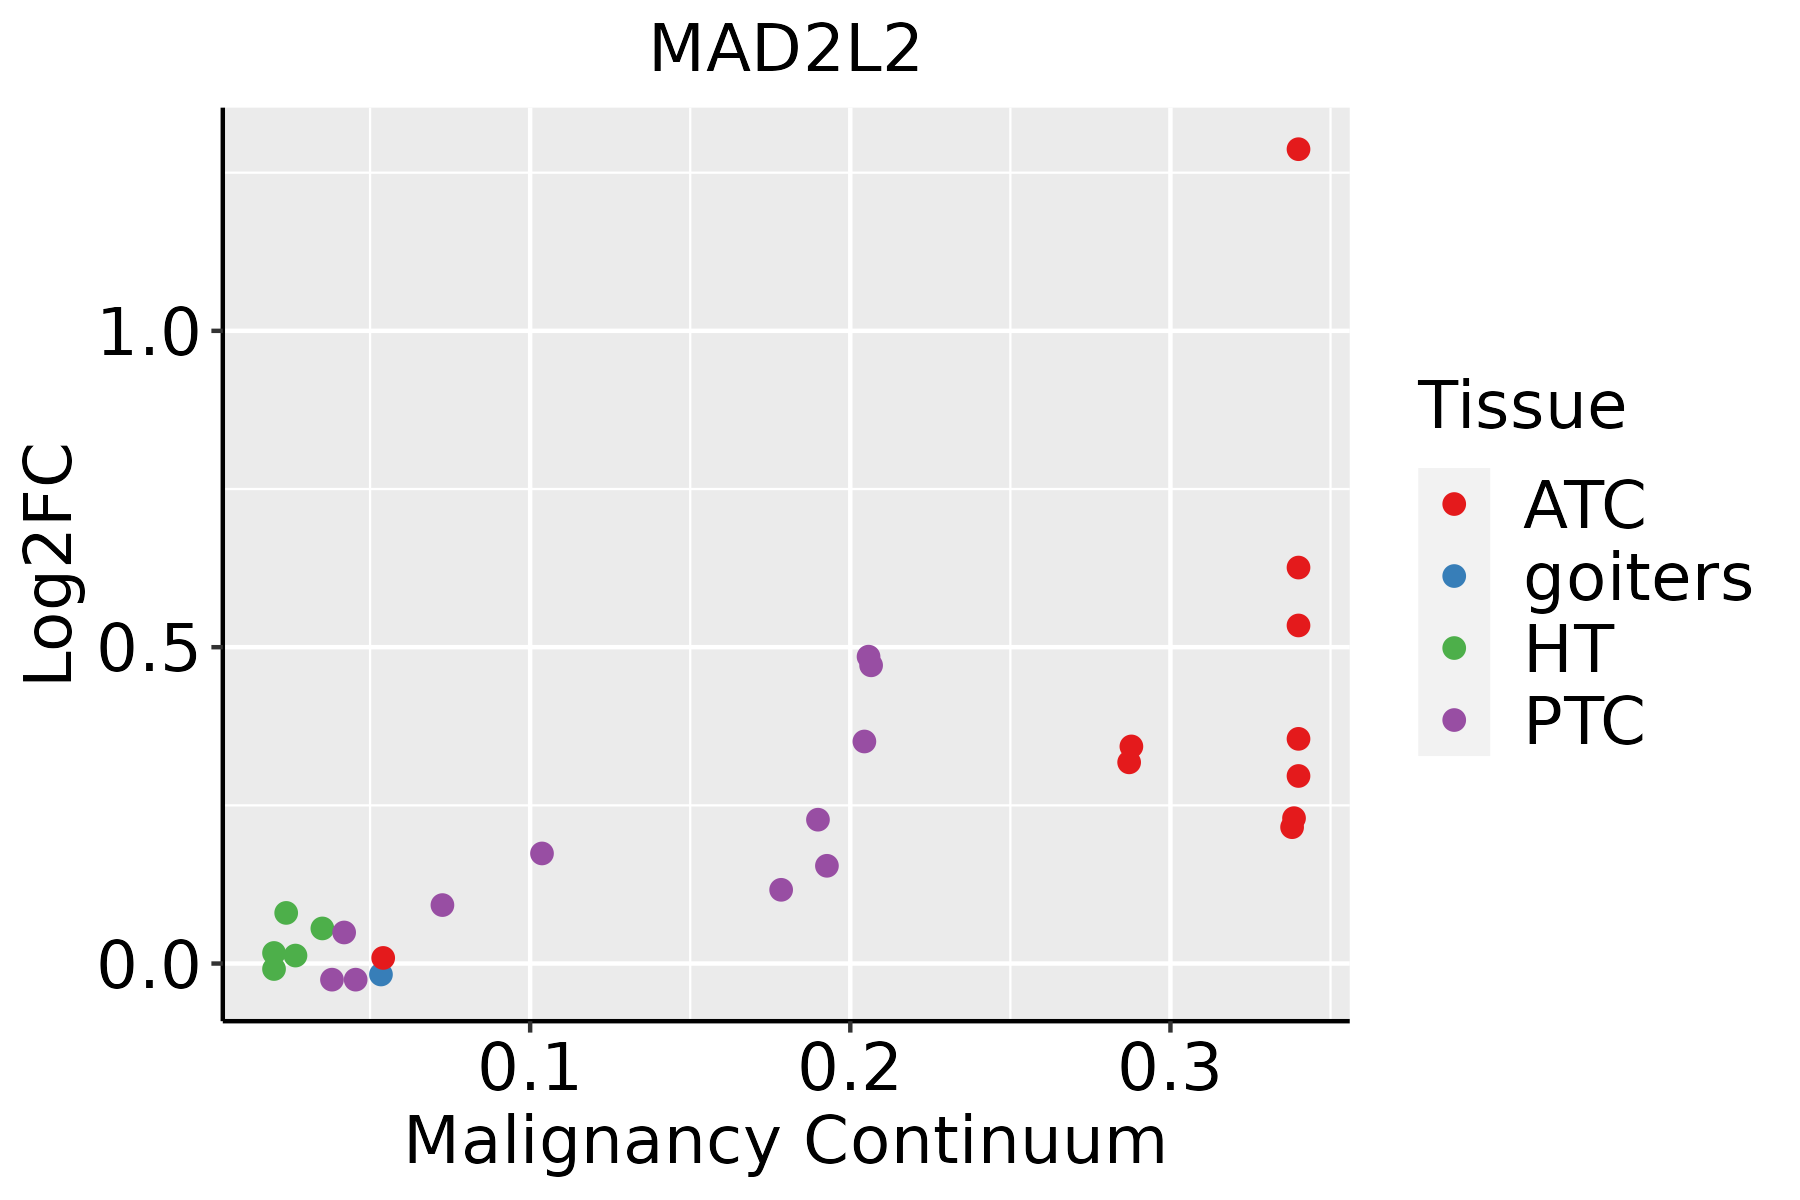 | ATC: Anaplastic thyroid cancer |
| HT: Hashimoto's thyroiditis | ||
| PTC: Papillary thyroid cancer |
| ∗log2FC in expression of this searched gene in stem-like cells from each diseased tissue sample relative to stem-like cells in normal samples in each tissue plotted against the malignancy continuum. Samples are colored based on if they are from different disease stage. |
Top |
Malignant transformation related pathway analysis |
| Find out the enriched GO biological processes and KEGG pathways involved in transition from healthy to precancer to cancer |
| Tissue | Disease Stage | Enriched GO biological Processes |
| Colorectum | AD |  |
| Colorectum | SER |  |
| Colorectum | MSS |  |
| Colorectum | MSI-H |  |
| Colorectum | FAP |  |
| ∗Top 15 enriched GO BP terms are showed in the bar plot of each disease state in each tissue. Each row represents a significant GO biological process which is colored according to the -log10(p.adjust). |
| Page: 1 2 3 4 5 6 7 8 9 |
| GO ID | Tissue | Disease Stage | Description | Gene Ratio | Bg Ratio | pvalue | p.adjust | Count |
| GO:014001414 | Esophagus | ESCC | mitotic nuclear division | 218/8552 | 287/18723 | 6.17e-26 | 1.78e-23 | 218 |
| GO:0042176111 | Esophagus | ESCC | regulation of protein catabolic process | 280/8552 | 391/18723 | 8.65e-26 | 2.39e-23 | 280 |
| GO:000007011 | Esophagus | ESCC | mitotic sister chromatid segregation | 138/8552 | 168/18723 | 1.37e-22 | 2.63e-20 | 138 |
| GO:00008194 | Esophagus | ESCC | sister chromatid segregation | 157/8552 | 202/18723 | 8.41e-21 | 1.33e-18 | 157 |
| GO:1903320111 | Esophagus | ESCC | regulation of protein modification by small protein conjugation or removal | 181/8552 | 242/18723 | 1.80e-20 | 2.60e-18 | 181 |
| GO:0051098111 | Esophagus | ESCC | regulation of binding | 251/8552 | 363/18723 | 6.73e-20 | 8.46e-18 | 251 |
| GO:003304416 | Esophagus | ESCC | regulation of chromosome organization | 145/8552 | 187/18723 | 3.80e-19 | 4.31e-17 | 145 |
| GO:000705911 | Esophagus | ESCC | chromosome segregation | 238/8552 | 346/18723 | 1.72e-18 | 1.82e-16 | 238 |
| GO:004477216 | Esophagus | ESCC | mitotic cell cycle phase transition | 281/8552 | 424/18723 | 4.63e-18 | 4.45e-16 | 281 |
| GO:0031396111 | Esophagus | ESCC | regulation of protein ubiquitination | 154/8552 | 210/18723 | 2.70e-16 | 2.04e-14 | 154 |
| GO:000734615 | Esophagus | ESCC | regulation of mitotic cell cycle | 293/8552 | 457/18723 | 8.00e-16 | 5.64e-14 | 293 |
| GO:005105215 | Esophagus | ESCC | regulation of DNA metabolic process | 232/8552 | 359/18723 | 2.40e-13 | 1.13e-11 | 232 |
| GO:00482853 | Esophagus | ESCC | organelle fission | 301/8552 | 488/18723 | 4.64e-13 | 2.12e-11 | 301 |
| GO:00988133 | Esophagus | ESCC | nuclear chromosome segregation | 187/8552 | 281/18723 | 1.00e-12 | 4.36e-11 | 187 |
| GO:0051348111 | Esophagus | ESCC | negative regulation of transferase activity | 177/8552 | 268/18723 | 1.08e-11 | 4.00e-10 | 177 |
| GO:00002802 | Esophagus | ESCC | nuclear division | 270/8552 | 439/18723 | 1.17e-11 | 4.24e-10 | 270 |
| GO:005105417 | Esophagus | ESCC | positive regulation of DNA metabolic process | 139/8552 | 201/18723 | 1.20e-11 | 4.33e-10 | 139 |
| GO:190198713 | Esophagus | ESCC | regulation of cell cycle phase transition | 242/8552 | 390/18723 | 3.86e-11 | 1.26e-09 | 242 |
| GO:0016049110 | Esophagus | ESCC | cell growth | 289/8552 | 482/18723 | 1.29e-10 | 3.77e-09 | 289 |
| GO:190199013 | Esophagus | ESCC | regulation of mitotic cell cycle phase transition | 191/8552 | 299/18723 | 1.35e-10 | 3.94e-09 | 191 |
| Page: 1 2 3 4 5 6 7 8 9 10 11 12 13 14 15 16 17 18 19 20 21 22 23 24 25 26 27 28 29 30 31 32 33 |
| Pathway ID | Tissue | Disease Stage | Description | Gene Ratio | Bg Ratio | pvalue | p.adjust | qvalue | Count |
| hsa0411023 | Esophagus | ESCC | Cell cycle | 126/4205 | 157/8465 | 1.34e-15 | 5.60e-14 | 2.87e-14 | 126 |
| hsa05100211 | Esophagus | ESCC | Bacterial invasion of epithelial cells | 59/4205 | 77/8465 | 1.05e-06 | 6.76e-06 | 3.46e-06 | 59 |
| hsa041146 | Esophagus | ESCC | Oocyte meiosis | 77/4205 | 131/8465 | 2.19e-02 | 4.80e-02 | 2.46e-02 | 77 |
| hsa0411033 | Esophagus | ESCC | Cell cycle | 126/4205 | 157/8465 | 1.34e-15 | 5.60e-14 | 2.87e-14 | 126 |
| hsa05100310 | Esophagus | ESCC | Bacterial invasion of epithelial cells | 59/4205 | 77/8465 | 1.05e-06 | 6.76e-06 | 3.46e-06 | 59 |
| hsa0411411 | Esophagus | ESCC | Oocyte meiosis | 77/4205 | 131/8465 | 2.19e-02 | 4.80e-02 | 2.46e-02 | 77 |
| hsa0510014 | Liver | Cirrhotic | Bacterial invasion of epithelial cells | 40/2530 | 77/8465 | 3.92e-05 | 2.84e-04 | 1.75e-04 | 40 |
| hsa041104 | Liver | Cirrhotic | Cell cycle | 61/2530 | 157/8465 | 9.53e-03 | 3.21e-02 | 1.98e-02 | 61 |
| hsa0510015 | Liver | Cirrhotic | Bacterial invasion of epithelial cells | 40/2530 | 77/8465 | 3.92e-05 | 2.84e-04 | 1.75e-04 | 40 |
| hsa0411011 | Liver | Cirrhotic | Cell cycle | 61/2530 | 157/8465 | 9.53e-03 | 3.21e-02 | 1.98e-02 | 61 |
| hsa041102 | Liver | HCC | Cell cycle | 106/4020 | 157/8465 | 2.54e-07 | 3.04e-06 | 1.69e-06 | 106 |
| hsa0510022 | Liver | HCC | Bacterial invasion of epithelial cells | 51/4020 | 77/8465 | 6.67e-04 | 2.72e-03 | 1.52e-03 | 51 |
| hsa041103 | Liver | HCC | Cell cycle | 106/4020 | 157/8465 | 2.54e-07 | 3.04e-06 | 1.69e-06 | 106 |
| hsa0510032 | Liver | HCC | Bacterial invasion of epithelial cells | 51/4020 | 77/8465 | 6.67e-04 | 2.72e-03 | 1.52e-03 | 51 |
| hsa041108 | Oral cavity | OSCC | Cell cycle | 118/3704 | 157/8465 | 7.15e-16 | 2.66e-14 | 1.35e-14 | 118 |
| hsa0510030 | Oral cavity | OSCC | Bacterial invasion of epithelial cells | 48/3704 | 77/8465 | 7.51e-04 | 2.19e-03 | 1.11e-03 | 48 |
| hsa04114 | Oral cavity | OSCC | Oocyte meiosis | 74/3704 | 131/8465 | 2.13e-03 | 5.75e-03 | 2.92e-03 | 74 |
| hsa0411015 | Oral cavity | OSCC | Cell cycle | 118/3704 | 157/8465 | 7.15e-16 | 2.66e-14 | 1.35e-14 | 118 |
| hsa05100113 | Oral cavity | OSCC | Bacterial invasion of epithelial cells | 48/3704 | 77/8465 | 7.51e-04 | 2.19e-03 | 1.11e-03 | 48 |
| hsa041141 | Oral cavity | OSCC | Oocyte meiosis | 74/3704 | 131/8465 | 2.13e-03 | 5.75e-03 | 2.92e-03 | 74 |
| Page: 1 2 |
Top |
Cell-cell communication analysis |
| Identification of potential cell-cell interactions between two cell types and their ligand-receptor pairs for different disease states |
| Ligand | Receptor | LRpair | Pathway | Tissue | Disease Stage |
| Page: 1 |
Top |
Single-cell gene regulatory network inference analysis |
| Find out the significant the regulons (TFs) and the target genes of each regulon across cell types for different disease states |
| TF | Cell Type | Tissue | Disease Stage | Target Gene | RSS | Regulon Activity |
| ∗The dot plots of a searched regulon are shown for all cell subpopulations in each disease state of each tissue based on the regulon specific score inferred using pySCENIC and by calculating the average expression. |
| Page: 1 |
Top |
Somatic mutation of malignant transformation related genes |
| Annotation of somatic variants for genes involved in malignant transformation |
| Hugo Symbol | Variant Class | Variant Classification | dbSNP RS | HGVSc | HGVSp | HGVSp Short | SWISSPROT | BIOTYPE | SIFT | PolyPhen | Tumor Sample Barcode | Tissue | Histology | Sex | Age | Stage | Therapy Types | Drugs | Outcome |
| MAD2L2 | SNV | Missense_Mutation | rs142776270 | c.616N>T | p.Arg206Cys | p.R206C | Q9UI95 | protein_coding | tolerated(0.11) | benign(0) | TCGA-AA-3947-01 | Colorectum | colon adenocarcinoma | Female | <65 | I/II | Unknown | Unknown | SD |
| MAD2L2 | SNV | Missense_Mutation | c.513G>T | p.Trp171Cys | p.W171C | Q9UI95 | protein_coding | deleterious(0) | probably_damaging(1) | TCGA-F4-6856-01 | Colorectum | colon adenocarcinoma | Male | <65 | I/II | Ancillary | leucovorin | CR | |
| MAD2L2 | SNV | Missense_Mutation | novel | c.288G>T | p.Glu96Asp | p.E96D | Q9UI95 | protein_coding | deleterious(0.01) | possibly_damaging(0.85) | TCGA-AG-A002-01 | Colorectum | rectum adenocarcinoma | Male | <65 | I/II | Unknown | Unknown | SD |
| MAD2L2 | SNV | Missense_Mutation | rs759967644 | c.619N>A | p.Ala207Thr | p.A207T | Q9UI95 | protein_coding | tolerated(0.35) | benign(0) | TCGA-A5-A0G1-01 | Endometrium | uterine corpus endometrioid carcinoma | Female | >=65 | I/II | Unknown | Unknown | SD |
| MAD2L2 | SNV | Missense_Mutation | novel | c.486N>T | p.Lys162Asn | p.K162N | Q9UI95 | protein_coding | tolerated(0.19) | benign(0.021) | TCGA-A5-A0G1-01 | Endometrium | uterine corpus endometrioid carcinoma | Female | >=65 | I/II | Unknown | Unknown | SD |
| MAD2L2 | SNV | Missense_Mutation | c.355N>A | p.Val119Met | p.V119M | Q9UI95 | protein_coding | tolerated(0.24) | probably_damaging(0.964) | TCGA-AP-A059-01 | Endometrium | uterine corpus endometrioid carcinoma | Female | >=65 | I/II | Unknown | Unknown | SD | |
| MAD2L2 | SNV | Missense_Mutation | novel | c.74T>C | p.Val25Ala | p.V25A | Q9UI95 | protein_coding | tolerated(0.06) | possibly_damaging(0.88) | TCGA-AX-A05W-01 | Endometrium | uterine corpus endometrioid carcinoma | Female | <65 | I/II | Unknown | Unknown | SD |
| MAD2L2 | SNV | Missense_Mutation | novel | c.288N>T | p.Glu96Asp | p.E96D | Q9UI95 | protein_coding | deleterious(0.01) | possibly_damaging(0.85) | TCGA-BK-A6W3-01 | Endometrium | uterine corpus endometrioid carcinoma | Female | <65 | I/II | Unknown | Unknown | SD |
| MAD2L2 | SNV | Missense_Mutation | c.235N>A | p.Asp79Asn | p.D79N | Q9UI95 | protein_coding | tolerated(0.08) | benign(0.005) | TCGA-D1-A103-01 | Endometrium | uterine corpus endometrioid carcinoma | Female | >=65 | I/II | Unknown | Unknown | SD | |
| MAD2L2 | SNV | Missense_Mutation | rs779016176 | c.553C>T | p.Arg185Trp | p.R185W | Q9UI95 | protein_coding | deleterious(0.02) | possibly_damaging(0.649) | TCGA-FI-A2D0-01 | Endometrium | uterine corpus endometrioid carcinoma | Female | <65 | I/II | Unknown | Unknown | SD |
| Page: 1 2 |
Top |
Related drugs of malignant transformation related genes |
| Identification of chemicals and drugs interact with genes involved in malignant transfromation |
| (DGIdb 4.0) |
| Entrez ID | Symbol | Category | Interaction Types | Drug Claim Name | Drug Name | PMIDs |
| Page: 1 |

Copyright 2023-Present -The University of Texas Health Science Center at Houston |