
|
|||||
|
 | |
| |
| |
| |
| |
| |
|
Gene: MAD2L1 |
Gene summary for MAD2L1 |
| Gene information | Species | Human | Gene symbol | MAD2L1 | Gene ID | 4085 |
| Gene name | mitotic arrest deficient 2 like 1 | |
| Gene Alias | HSMAD2 | |
| Cytomap | 4q27 | |
| Gene Type | protein-coding | GO ID | GO:0000070 | UniProtAcc | Q13257 |
Top |
Malignant transformation analysis |
| Identification of the aberrant gene expression in precancerous and cancerous lesions by comparing the gene expression of stem-like cells in diseased tissues with normal stem cells |
| Entrez ID | Symbol | Replicates | Species | Organ | Tissue | Adj P-value | Log2FC | Malignancy |
| 4085 | MAD2L1 | LZE2T | Human | Esophagus | ESCC | 3.47e-05 | 8.34e-01 | 0.082 |
| 4085 | MAD2L1 | LZE7T | Human | Esophagus | ESCC | 3.96e-02 | 2.62e-01 | 0.0667 |
| 4085 | MAD2L1 | LZE24T | Human | Esophagus | ESCC | 2.21e-02 | 1.42e-01 | 0.0596 |
| 4085 | MAD2L1 | LZE6T | Human | Esophagus | ESCC | 9.23e-10 | 4.30e-01 | 0.0845 |
| 4085 | MAD2L1 | P1T-E | Human | Esophagus | ESCC | 3.71e-02 | 1.24e-01 | 0.0875 |
| 4085 | MAD2L1 | P2T-E | Human | Esophagus | ESCC | 4.65e-27 | 1.05e+00 | 0.1177 |
| 4085 | MAD2L1 | P4T-E | Human | Esophagus | ESCC | 6.69e-27 | 9.25e-01 | 0.1323 |
| 4085 | MAD2L1 | P5T-E | Human | Esophagus | ESCC | 2.14e-21 | 5.55e-01 | 0.1327 |
| 4085 | MAD2L1 | P8T-E | Human | Esophagus | ESCC | 1.95e-05 | 2.23e-01 | 0.0889 |
| 4085 | MAD2L1 | P9T-E | Human | Esophagus | ESCC | 3.83e-08 | 3.11e-01 | 0.1131 |
| 4085 | MAD2L1 | P10T-E | Human | Esophagus | ESCC | 8.07e-19 | 5.44e-01 | 0.116 |
| 4085 | MAD2L1 | P11T-E | Human | Esophagus | ESCC | 3.66e-02 | 2.01e-01 | 0.1426 |
| 4085 | MAD2L1 | P12T-E | Human | Esophagus | ESCC | 6.74e-08 | 2.66e-01 | 0.1122 |
| 4085 | MAD2L1 | P15T-E | Human | Esophagus | ESCC | 3.19e-08 | 3.84e-01 | 0.1149 |
| 4085 | MAD2L1 | P16T-E | Human | Esophagus | ESCC | 5.48e-16 | 5.64e-01 | 0.1153 |
| 4085 | MAD2L1 | P17T-E | Human | Esophagus | ESCC | 1.11e-08 | 4.88e-01 | 0.1278 |
| 4085 | MAD2L1 | P19T-E | Human | Esophagus | ESCC | 4.67e-03 | 5.76e-01 | 0.1662 |
| 4085 | MAD2L1 | P20T-E | Human | Esophagus | ESCC | 3.20e-07 | 2.58e-01 | 0.1124 |
| 4085 | MAD2L1 | P21T-E | Human | Esophagus | ESCC | 1.08e-16 | 7.22e-01 | 0.1617 |
| 4085 | MAD2L1 | P22T-E | Human | Esophagus | ESCC | 2.93e-34 | 1.04e+00 | 0.1236 |
| Page: 1 2 3 4 5 |
| Tissue | Expression Dynamics | Abbreviation |
| Esophagus | 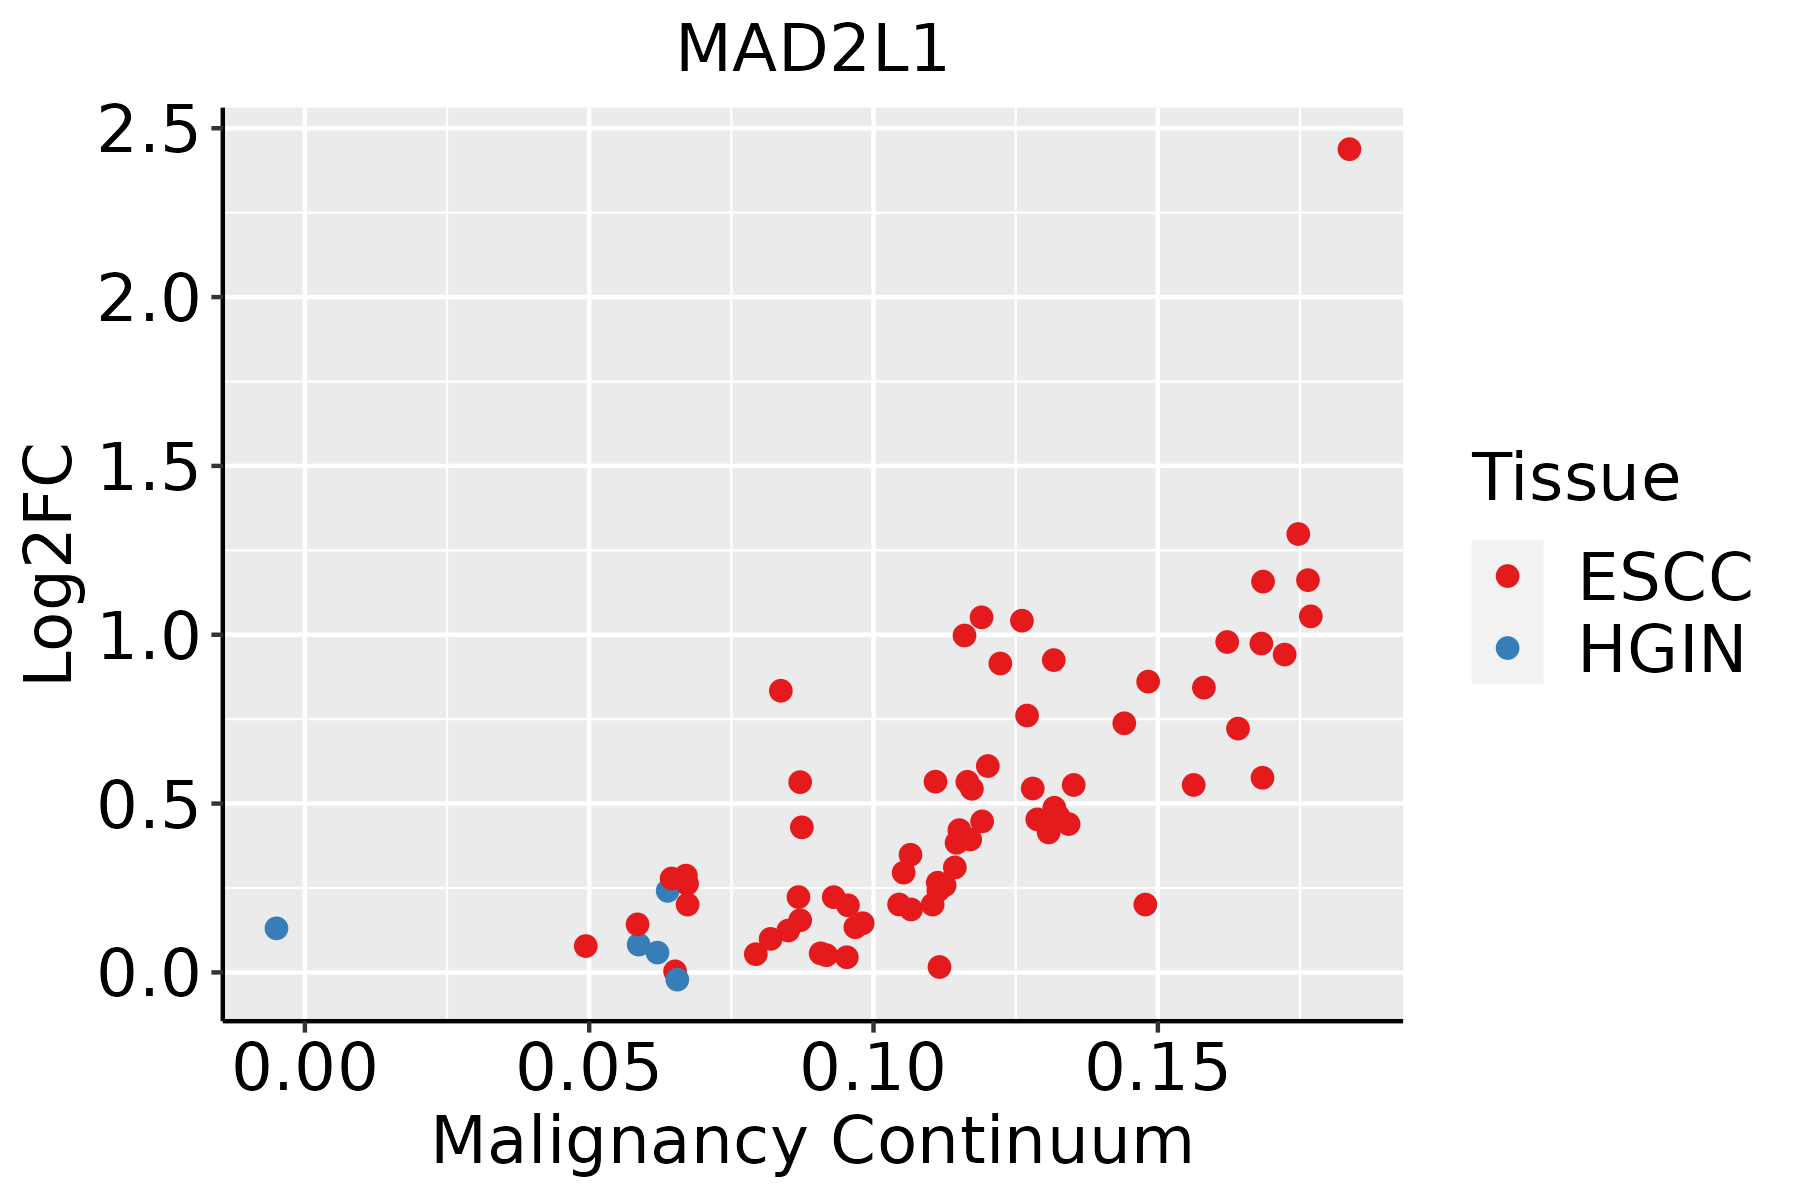 | ESCC: Esophageal squamous cell carcinoma |
| HGIN: High-grade intraepithelial neoplasias | ||
| LGIN: Low-grade intraepithelial neoplasias | ||
| Liver |  | HCC: Hepatocellular carcinoma |
| NAFLD: Non-alcoholic fatty liver disease | ||
| Oral Cavity | 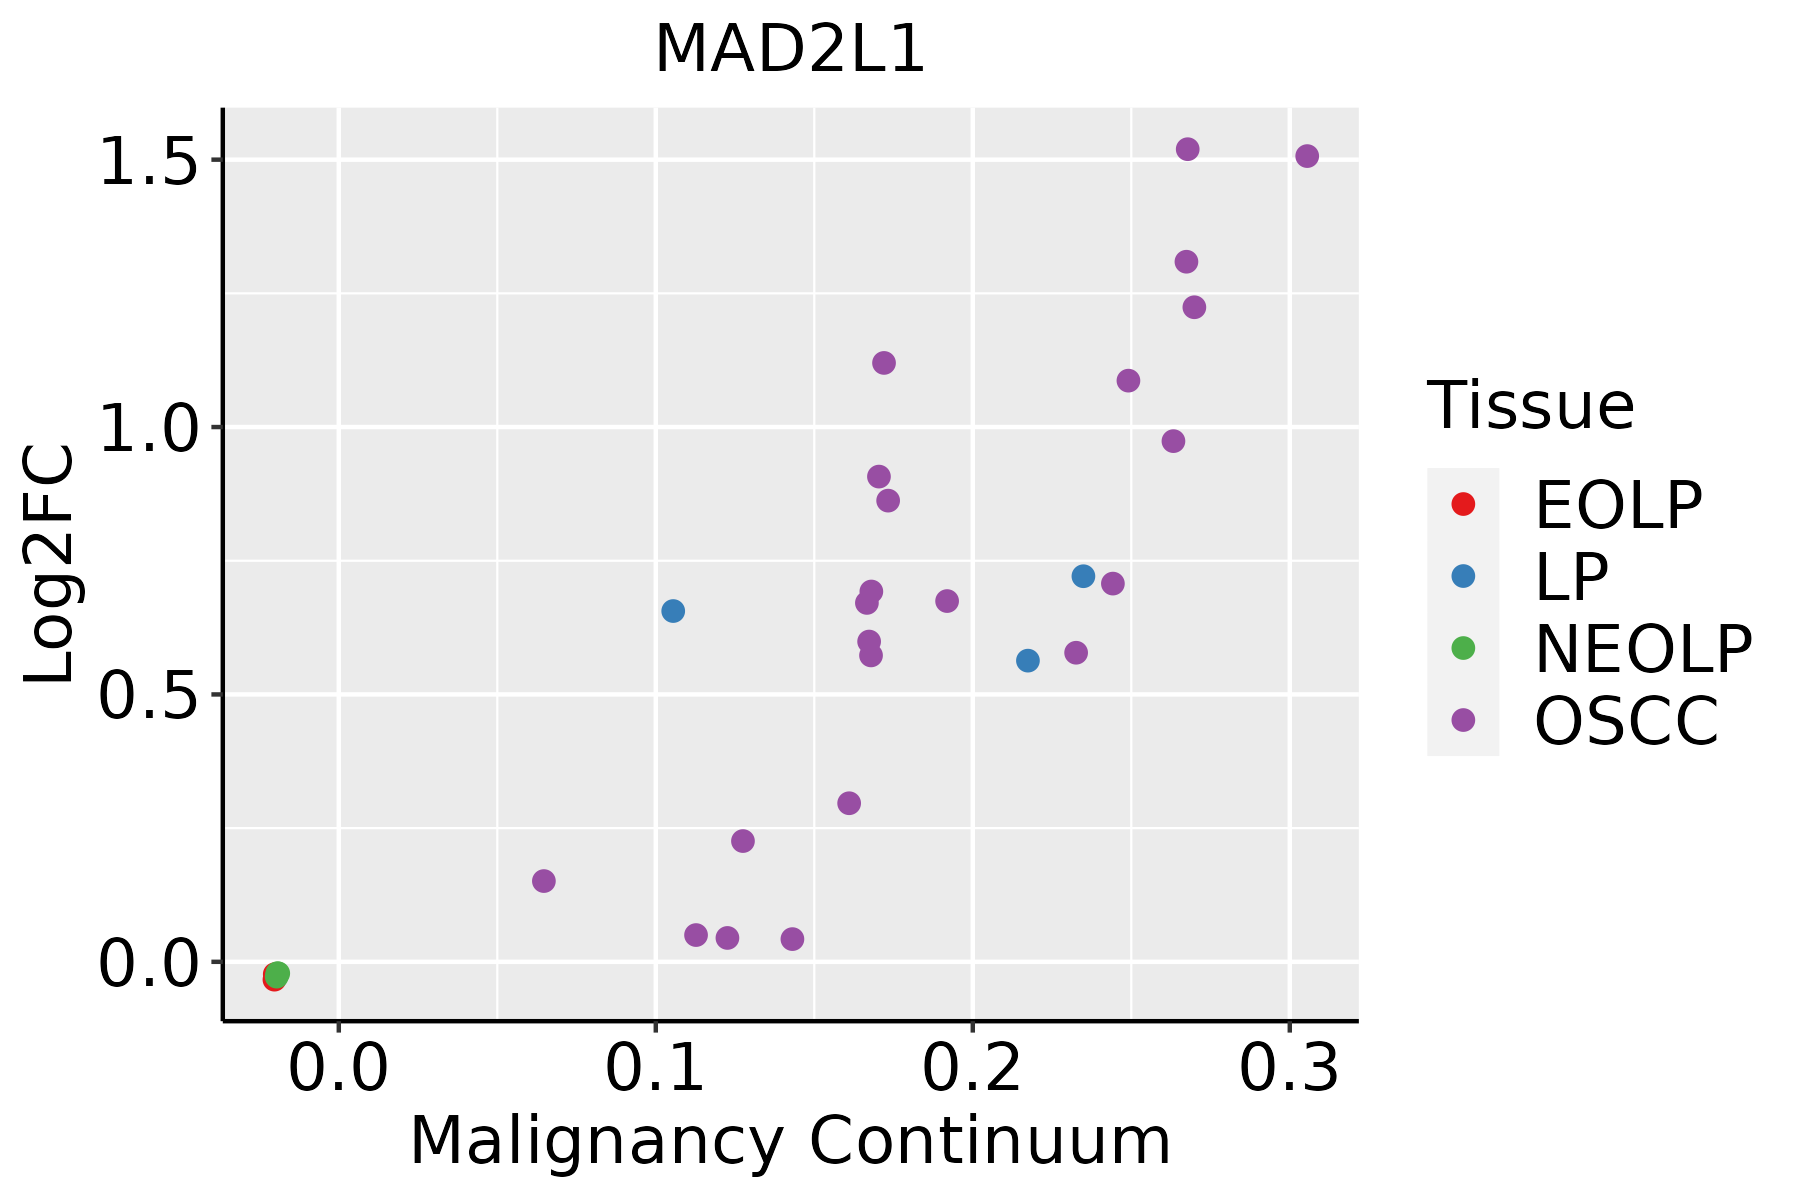 | EOLP: Erosive Oral lichen planus |
| LP: leukoplakia | ||
| NEOLP: Non-erosive oral lichen planus | ||
| OSCC: Oral squamous cell carcinoma | ||
| Skin |  | AK: Actinic keratosis |
| cSCC: Cutaneous squamous cell carcinoma | ||
| SCCIS:squamous cell carcinoma in situ | ||
| Thyroid | 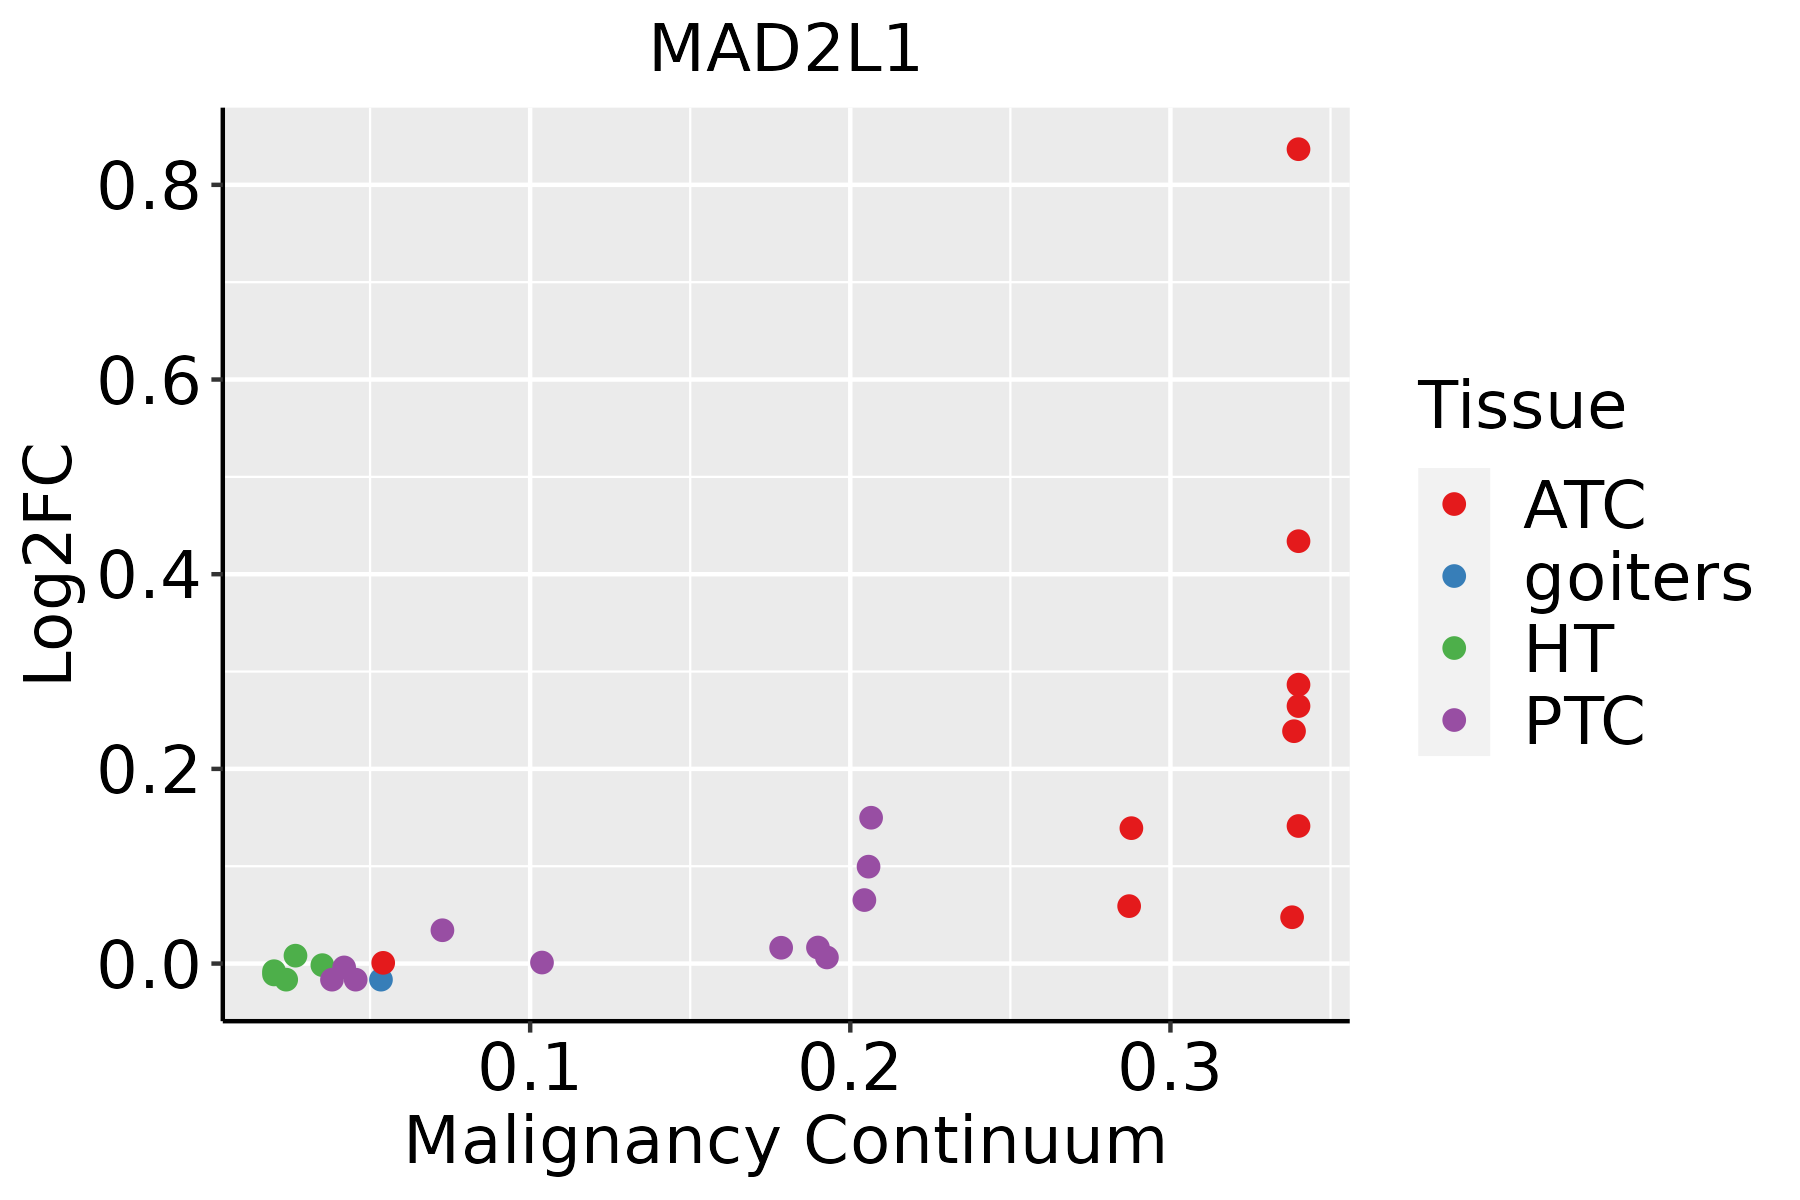 | ATC: Anaplastic thyroid cancer |
| HT: Hashimoto's thyroiditis | ||
| PTC: Papillary thyroid cancer |
| ∗log2FC in expression of this searched gene in stem-like cells from each diseased tissue sample relative to stem-like cells in normal samples in each tissue plotted against the malignancy continuum. Samples are colored based on if they are from different disease stage. |
Top |
Malignant transformation related pathway analysis |
| Find out the enriched GO biological processes and KEGG pathways involved in transition from healthy to precancer to cancer |
| Tissue | Disease Stage | Enriched GO biological Processes |
| Colorectum | AD |  |
| Colorectum | SER |  |
| Colorectum | MSS |  |
| Colorectum | MSI-H |  |
| Colorectum | FAP |  |
| ∗Top 15 enriched GO BP terms are showed in the bar plot of each disease state in each tissue. Each row represents a significant GO biological process which is colored according to the -log10(p.adjust). |
| Page: 1 2 3 4 5 6 7 8 9 |
| GO ID | Tissue | Disease Stage | Description | Gene Ratio | Bg Ratio | pvalue | p.adjust | Count |
| GO:0010639 | Colorectum | AD | negative regulation of organelle organization | 114/3918 | 348/18723 | 1.41e-07 | 6.49e-06 | 114 |
| GO:2001252 | Colorectum | AD | positive regulation of chromosome organization | 35/3918 | 82/18723 | 6.90e-06 | 1.72e-04 | 35 |
| GO:0033044 | Colorectum | AD | regulation of chromosome organization | 60/3918 | 187/18723 | 2.25e-04 | 2.94e-03 | 60 |
| GO:0007346 | Colorectum | AD | regulation of mitotic cell cycle | 119/3918 | 457/18723 | 4.60e-03 | 3.14e-02 | 119 |
| GO:0045787 | Colorectum | AD | positive regulation of cell cycle | 85/3918 | 313/18723 | 4.76e-03 | 3.22e-02 | 85 |
| GO:0045842 | Colorectum | AD | positive regulation of mitotic metaphase/anaphase transition | 8/3918 | 15/18723 | 5.67e-03 | 3.64e-02 | 8 |
| GO:1901970 | Colorectum | AD | positive regulation of mitotic sister chromatid separation | 8/3918 | 15/18723 | 5.67e-03 | 3.64e-02 | 8 |
| GO:1905820 | Colorectum | AD | positive regulation of chromosome separation | 9/3918 | 18/18723 | 5.82e-03 | 3.67e-02 | 9 |
| GO:0140014 | Colorectum | AD | mitotic nuclear division | 78/3918 | 287/18723 | 6.48e-03 | 4.05e-02 | 78 |
| GO:0045931 | Colorectum | AD | positive regulation of mitotic cell cycle | 37/3918 | 121/18723 | 7.88e-03 | 4.73e-02 | 37 |
| GO:00106391 | Colorectum | SER | negative regulation of organelle organization | 90/2897 | 348/18723 | 3.14e-07 | 1.69e-05 | 90 |
| GO:20012521 | Colorectum | SER | positive regulation of chromosome organization | 27/2897 | 82/18723 | 6.44e-05 | 1.49e-03 | 27 |
| GO:00106392 | Colorectum | MSS | negative regulation of organelle organization | 102/3467 | 348/18723 | 5.36e-07 | 2.05e-05 | 102 |
| GO:20012522 | Colorectum | MSS | positive regulation of chromosome organization | 33/3467 | 82/18723 | 3.72e-06 | 1.07e-04 | 33 |
| GO:00330441 | Colorectum | MSS | regulation of chromosome organization | 55/3467 | 187/18723 | 1.86e-04 | 2.63e-03 | 55 |
| GO:00457871 | Colorectum | MSS | positive regulation of cell cycle | 80/3467 | 313/18723 | 1.15e-03 | 1.12e-02 | 80 |
| GO:00073461 | Colorectum | MSS | regulation of mitotic cell cycle | 108/3467 | 457/18723 | 3.30e-03 | 2.50e-02 | 108 |
| GO:0090068 | Colorectum | MSS | positive regulation of cell cycle process | 60/3467 | 236/18723 | 5.01e-03 | 3.46e-02 | 60 |
| GO:01400141 | Colorectum | MSS | mitotic nuclear division | 70/3467 | 287/18723 | 7.48e-03 | 4.72e-02 | 70 |
| GO:014001414 | Esophagus | ESCC | mitotic nuclear division | 218/8552 | 287/18723 | 6.17e-26 | 1.78e-23 | 218 |
| Page: 1 2 3 4 5 6 7 8 9 10 11 12 13 14 15 16 17 18 19 20 21 22 23 24 25 26 27 |
| Pathway ID | Tissue | Disease Stage | Description | Gene Ratio | Bg Ratio | pvalue | p.adjust | qvalue | Count |
| hsa0411023 | Esophagus | ESCC | Cell cycle | 126/4205 | 157/8465 | 1.34e-15 | 5.60e-14 | 2.87e-14 | 126 |
| hsa05166211 | Esophagus | ESCC | Human T-cell leukemia virus 1 infection | 164/4205 | 222/8465 | 8.13e-14 | 2.09e-12 | 1.07e-12 | 164 |
| hsa041146 | Esophagus | ESCC | Oocyte meiosis | 77/4205 | 131/8465 | 2.19e-02 | 4.80e-02 | 2.46e-02 | 77 |
| hsa0411033 | Esophagus | ESCC | Cell cycle | 126/4205 | 157/8465 | 1.34e-15 | 5.60e-14 | 2.87e-14 | 126 |
| hsa05166310 | Esophagus | ESCC | Human T-cell leukemia virus 1 infection | 164/4205 | 222/8465 | 8.13e-14 | 2.09e-12 | 1.07e-12 | 164 |
| hsa0411411 | Esophagus | ESCC | Oocyte meiosis | 77/4205 | 131/8465 | 2.19e-02 | 4.80e-02 | 2.46e-02 | 77 |
| hsa041102 | Liver | HCC | Cell cycle | 106/4020 | 157/8465 | 2.54e-07 | 3.04e-06 | 1.69e-06 | 106 |
| hsa0516622 | Liver | HCC | Human T-cell leukemia virus 1 infection | 139/4020 | 222/8465 | 3.17e-06 | 2.79e-05 | 1.55e-05 | 139 |
| hsa041103 | Liver | HCC | Cell cycle | 106/4020 | 157/8465 | 2.54e-07 | 3.04e-06 | 1.69e-06 | 106 |
| hsa0516632 | Liver | HCC | Human T-cell leukemia virus 1 infection | 139/4020 | 222/8465 | 3.17e-06 | 2.79e-05 | 1.55e-05 | 139 |
| hsa041108 | Oral cavity | OSCC | Cell cycle | 118/3704 | 157/8465 | 7.15e-16 | 2.66e-14 | 1.35e-14 | 118 |
| hsa0516630 | Oral cavity | OSCC | Human T-cell leukemia virus 1 infection | 150/3704 | 222/8465 | 3.68e-13 | 7.26e-12 | 3.70e-12 | 150 |
| hsa04114 | Oral cavity | OSCC | Oocyte meiosis | 74/3704 | 131/8465 | 2.13e-03 | 5.75e-03 | 2.92e-03 | 74 |
| hsa0411015 | Oral cavity | OSCC | Cell cycle | 118/3704 | 157/8465 | 7.15e-16 | 2.66e-14 | 1.35e-14 | 118 |
| hsa05166113 | Oral cavity | OSCC | Human T-cell leukemia virus 1 infection | 150/3704 | 222/8465 | 3.68e-13 | 7.26e-12 | 3.70e-12 | 150 |
| hsa041141 | Oral cavity | OSCC | Oocyte meiosis | 74/3704 | 131/8465 | 2.13e-03 | 5.75e-03 | 2.92e-03 | 74 |
| hsa05166210 | Oral cavity | LP | Human T-cell leukemia virus 1 infection | 100/2418 | 222/8465 | 8.94e-08 | 1.29e-06 | 8.35e-07 | 100 |
| hsa0411022 | Oral cavity | LP | Cell cycle | 70/2418 | 157/8465 | 1.17e-05 | 8.27e-05 | 5.33e-05 | 70 |
| hsa0516638 | Oral cavity | LP | Human T-cell leukemia virus 1 infection | 100/2418 | 222/8465 | 8.94e-08 | 1.29e-06 | 8.35e-07 | 100 |
| hsa0411032 | Oral cavity | LP | Cell cycle | 70/2418 | 157/8465 | 1.17e-05 | 8.27e-05 | 5.33e-05 | 70 |
| Page: 1 |
Top |
Cell-cell communication analysis |
| Identification of potential cell-cell interactions between two cell types and their ligand-receptor pairs for different disease states |
| Ligand | Receptor | LRpair | Pathway | Tissue | Disease Stage |
| Page: 1 |
Top |
Single-cell gene regulatory network inference analysis |
| Find out the significant the regulons (TFs) and the target genes of each regulon across cell types for different disease states |
| TF | Cell Type | Tissue | Disease Stage | Target Gene | RSS | Regulon Activity |
| ∗The dot plots of a searched regulon are shown for all cell subpopulations in each disease state of each tissue based on the regulon specific score inferred using pySCENIC and by calculating the average expression. |
| Page: 1 |
Top |
Somatic mutation of malignant transformation related genes |
| Annotation of somatic variants for genes involved in malignant transformation |
| Hugo Symbol | Variant Class | Variant Classification | dbSNP RS | HGVSc | HGVSp | HGVSp Short | SWISSPROT | BIOTYPE | SIFT | PolyPhen | Tumor Sample Barcode | Tissue | Histology | Sex | Age | Stage | Therapy Types | Drugs | Outcome |
| MAD2L1 | SNV | Missense_Mutation | c.230N>T | p.Tyr77Phe | p.Y77F | Q13257 | protein_coding | tolerated(0.62) | benign(0.005) | TCGA-A8-A09Q-01 | Breast | breast invasive carcinoma | Female | >=65 | III/IV | Hormone Therapy | anastrozole | SD | |
| MAD2L1 | SNV | Missense_Mutation | c.208N>A | p.Glu70Lys | p.E70K | Q13257 | protein_coding | tolerated(0.58) | benign(0.003) | TCGA-AC-A23H-01 | Breast | breast invasive carcinoma | Female | >=65 | I/II | Unknown | Unknown | PD | |
| MAD2L1 | SNV | Missense_Mutation | c.272N>A | p.Ile91Asn | p.I91N | Q13257 | protein_coding | tolerated(0.13) | benign(0.005) | TCGA-D8-A1XK-01 | Breast | breast invasive carcinoma | Female | <65 | I/II | Chemotherapy | doxorubicine+cyclophosphamide | SD | |
| MAD2L1 | SNV | Missense_Mutation | novel | c.199N>G | p.Asn67Asp | p.N67D | Q13257 | protein_coding | tolerated(0.07) | benign(0.017) | TCGA-AG-3726-01 | Colorectum | rectum adenocarcinoma | Female | <65 | I/II | Unknown | Unknown | SD |
| MAD2L1 | insertion | Nonsense_Mutation | novel | c.88_89insTTATTTAG | p.Ser30IlefsTer3 | p.S30Ifs*3 | Q13257 | protein_coding | TCGA-AM-5820-01 | Colorectum | colon adenocarcinoma | Female | <65 | I/II | Unknown | Unknown | SD | ||
| MAD2L1 | SNV | Missense_Mutation | rs750970089 | c.550C>T | p.Arg184Cys | p.R184C | Q13257 | protein_coding | deleterious(0.02) | probably_damaging(0.977) | TCGA-A5-A0G2-01 | Endometrium | uterine corpus endometrioid carcinoma | Female | <65 | III/IV | Unknown | Unknown | SD |
| MAD2L1 | SNV | Missense_Mutation | novel | c.256G>A | p.Val86Ile | p.V86I | Q13257 | protein_coding | tolerated(0.34) | benign(0.266) | TCGA-A5-A0G2-01 | Endometrium | uterine corpus endometrioid carcinoma | Female | <65 | III/IV | Unknown | Unknown | SD |
| MAD2L1 | SNV | Missense_Mutation | novel | c.107G>A | p.Gly36Asp | p.G36D | Q13257 | protein_coding | deleterious(0) | possibly_damaging(0.687) | TCGA-A5-A0G2-01 | Endometrium | uterine corpus endometrioid carcinoma | Female | <65 | III/IV | Unknown | Unknown | SD |
| MAD2L1 | SNV | Missense_Mutation | novel | c.413C>T | p.Thr138Met | p.T138M | Q13257 | protein_coding | deleterious(0) | probably_damaging(0.984) | TCGA-AJ-A2QO-01 | Endometrium | uterine corpus endometrioid carcinoma | Female | >=65 | I/II | Unknown | Unknown | SD |
| MAD2L1 | SNV | Missense_Mutation | c.572N>G | p.His191Arg | p.H191R | Q13257 | protein_coding | deleterious(0) | probably_damaging(1) | TCGA-AX-A1CE-01 | Endometrium | uterine corpus endometrioid carcinoma | Female | <65 | I/II | Unspecific | Paclitaxel | SD |
| Page: 1 2 3 |
Top |
Related drugs of malignant transformation related genes |
| Identification of chemicals and drugs interact with genes involved in malignant transfromation |
| (DGIdb 4.0) |
| Entrez ID | Symbol | Category | Interaction Types | Drug Claim Name | Drug Name | PMIDs |
| Page: 1 |

Copyright 2023-Present -The University of Texas Health Science Center at Houston |