
|
|||||
|
 | |
| |
| |
| |
| |
| |
|
Gene: MACROH2A1 |
Gene summary for MACROH2A1 |
| Gene information | Species | Human | Gene symbol | MACROH2A1 | Gene ID | 9555 |
| Gene name | macroH2A.1 histone | |
| Gene Alias | H2A.y | |
| Cytomap | 5q31.1 | |
| Gene Type | protein-coding | GO ID | GO:0000070 | UniProtAcc | O75367 |
Top |
Malignant transformation analysis |
| Identification of the aberrant gene expression in precancerous and cancerous lesions by comparing the gene expression of stem-like cells in diseased tissues with normal stem cells |
| Entrez ID | Symbol | Replicates | Species | Organ | Tissue | Adj P-value | Log2FC | Malignancy |
| 9555 | MACROH2A1 | CA_HPV_1 | Human | Cervix | CC | 2.45e-05 | 1.45e-01 | 0.0264 |
| 9555 | MACROH2A1 | CA_HPV_3 | Human | Cervix | CC | 3.87e-03 | 5.01e-02 | 0.0414 |
| 9555 | MACROH2A1 | CCI_1 | Human | Cervix | CC | 1.11e-08 | -6.18e-01 | 0.528 |
| 9555 | MACROH2A1 | CCI_2 | Human | Cervix | CC | 6.44e-08 | -6.18e-01 | 0.5249 |
| 9555 | MACROH2A1 | CCI_3 | Human | Cervix | CC | 9.21e-12 | -6.18e-01 | 0.516 |
| 9555 | MACROH2A1 | CCII_1 | Human | Cervix | CC | 1.79e-16 | -6.18e-01 | 0.3249 |
| 9555 | MACROH2A1 | Tumor | Human | Cervix | CC | 3.92e-37 | -6.18e-01 | 0.1241 |
| 9555 | MACROH2A1 | sample1 | Human | Cervix | CC | 1.05e-13 | -6.18e-01 | 0.0959 |
| 9555 | MACROH2A1 | sample3 | Human | Cervix | CC | 5.67e-38 | -6.18e-01 | 0.1387 |
| 9555 | MACROH2A1 | H2 | Human | Cervix | HSIL_HPV | 4.25e-40 | -6.18e-01 | 0.0632 |
| 9555 | MACROH2A1 | L1 | Human | Cervix | CC | 4.17e-18 | -6.18e-01 | 0.0802 |
| 9555 | MACROH2A1 | T1 | Human | Cervix | CC | 5.15e-30 | -6.18e-01 | 0.0918 |
| 9555 | MACROH2A1 | T2 | Human | Cervix | CC | 1.88e-07 | -6.18e-01 | 0.0709 |
| 9555 | MACROH2A1 | T3 | Human | Cervix | CC | 1.49e-37 | -6.18e-01 | 0.1389 |
| 9555 | MACROH2A1 | HTA11_3410_2000001011 | Human | Colorectum | AD | 1.87e-37 | 6.89e-01 | 0.0155 |
| 9555 | MACROH2A1 | HTA11_2487_2000001011 | Human | Colorectum | SER | 3.00e-39 | 8.85e-01 | -0.1808 |
| 9555 | MACROH2A1 | HTA11_2951_2000001011 | Human | Colorectum | AD | 6.82e-15 | 6.74e-01 | 0.0216 |
| 9555 | MACROH2A1 | HTA11_1938_2000001011 | Human | Colorectum | AD | 4.25e-40 | 1.19e+00 | -0.0811 |
| 9555 | MACROH2A1 | HTA11_78_2000001011 | Human | Colorectum | AD | 3.36e-68 | 1.50e+00 | -0.1088 |
| 9555 | MACROH2A1 | HTA11_347_2000001011 | Human | Colorectum | AD | 7.09e-82 | 1.32e+00 | -0.1954 |
| Page: 1 2 3 |
| Tissue | Expression Dynamics | Abbreviation |
| Cervix | 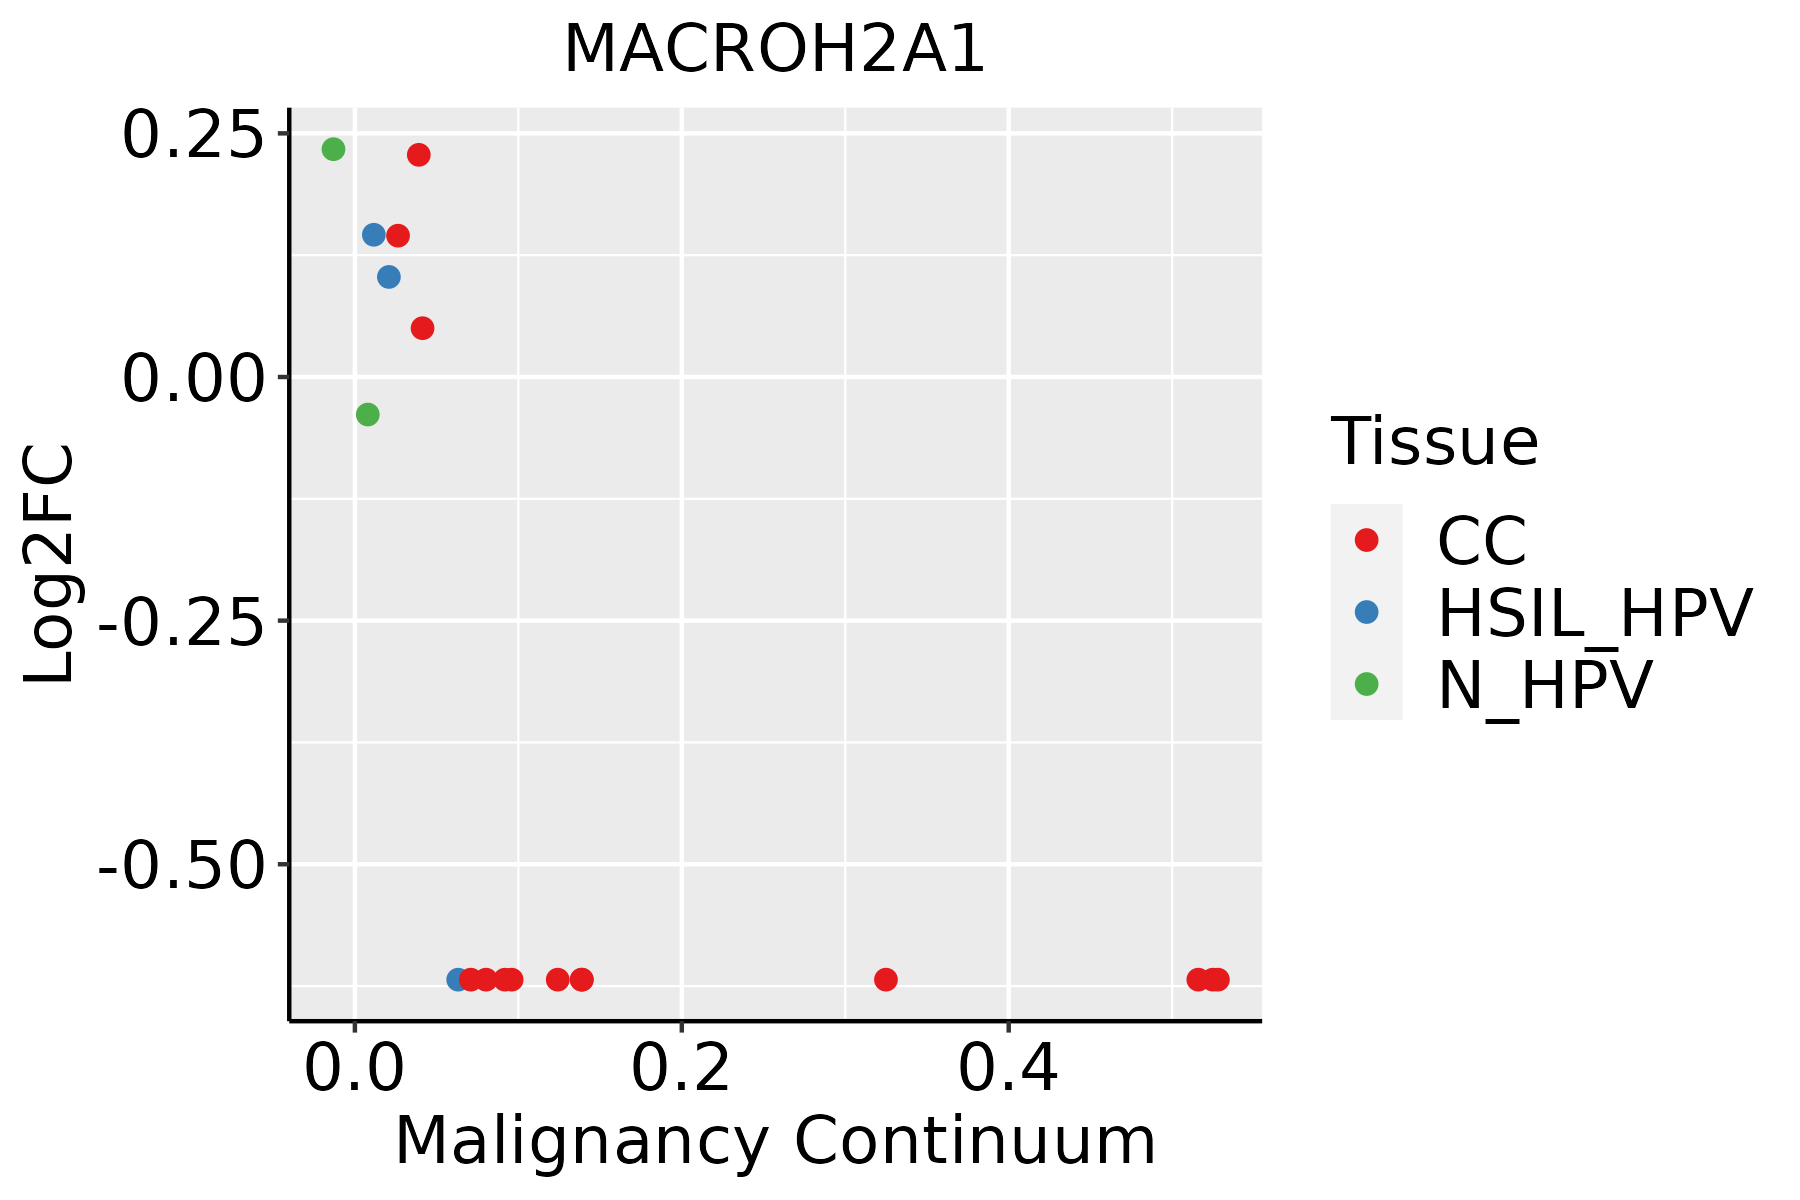 | CC: Cervix cancer |
| HSIL_HPV: HPV-infected high-grade squamous intraepithelial lesions | ||
| N_HPV: HPV-infected normal cervix | ||
| Colorectum (GSE201348) |  | FAP: Familial adenomatous polyposis |
| CRC: Colorectal cancer | ||
| Colorectum (HTA11) |  | AD: Adenomas |
| SER: Sessile serrated lesions | ||
| MSI-H: Microsatellite-high colorectal cancer | ||
| MSS: Microsatellite stable colorectal cancer |
| ∗log2FC in expression of this searched gene in stem-like cells from each diseased tissue sample relative to stem-like cells in normal samples in each tissue plotted against the malignancy continuum. Samples are colored based on if they are from different disease stage. |
Top |
Malignant transformation related pathway analysis |
| Find out the enriched GO biological processes and KEGG pathways involved in transition from healthy to precancer to cancer |
| Tissue | Disease Stage | Enriched GO biological Processes |
| Colorectum | AD |  |
| Colorectum | SER |  |
| Colorectum | MSS |  |
| Colorectum | MSI-H |  |
| Colorectum | FAP |  |
| ∗Top 15 enriched GO BP terms are showed in the bar plot of each disease state in each tissue. Each row represents a significant GO biological process which is colored according to the -log10(p.adjust). |
| Page: 1 2 3 4 5 6 7 8 9 |
| GO ID | Tissue | Disease Stage | Description | Gene Ratio | Bg Ratio | pvalue | p.adjust | Count |
| GO:00085446 | Cervix | CC | epidermis development | 83/2311 | 324/18723 | 3.91e-11 | 8.54e-09 | 83 |
| GO:00435884 | Cervix | CC | skin development | 71/2311 | 263/18723 | 8.04e-11 | 1.46e-08 | 71 |
| GO:00725949 | Cervix | CC | establishment of protein localization to organelle | 99/2311 | 422/18723 | 1.23e-10 | 2.11e-08 | 99 |
| GO:000697910 | Cervix | CC | response to oxidative stress | 102/2311 | 446/18723 | 2.99e-10 | 4.36e-08 | 102 |
| GO:00302164 | Cervix | CC | keratinocyte differentiation | 42/2311 | 139/18723 | 1.74e-08 | 1.28e-06 | 42 |
| GO:00099137 | Cervix | CC | epidermal cell differentiation | 53/2311 | 202/18723 | 5.48e-08 | 3.25e-06 | 53 |
| GO:00719007 | Cervix | CC | regulation of protein serine/threonine kinase activity | 75/2311 | 359/18723 | 2.76e-06 | 8.02e-05 | 75 |
| GO:005134810 | Cervix | CC | negative regulation of transferase activity | 60/2311 | 268/18723 | 2.77e-06 | 8.02e-05 | 60 |
| GO:004593610 | Cervix | CC | negative regulation of phosphate metabolic process | 88/2311 | 441/18723 | 2.92e-06 | 8.27e-05 | 88 |
| GO:001056310 | Cervix | CC | negative regulation of phosphorus metabolic process | 88/2311 | 442/18723 | 3.21e-06 | 8.77e-05 | 88 |
| GO:00456822 | Cervix | CC | regulation of epidermis development | 22/2311 | 65/18723 | 5.56e-06 | 1.38e-04 | 22 |
| GO:00457876 | Cervix | CC | positive regulation of cell cycle | 66/2311 | 313/18723 | 7.78e-06 | 1.81e-04 | 66 |
| GO:00456042 | Cervix | CC | regulation of epidermal cell differentiation | 20/2311 | 58/18723 | 1.07e-05 | 2.33e-04 | 20 |
| GO:004232610 | Cervix | CC | negative regulation of phosphorylation | 77/2311 | 385/18723 | 1.09e-05 | 2.38e-04 | 77 |
| GO:000193310 | Cervix | CC | negative regulation of protein phosphorylation | 69/2311 | 342/18723 | 2.29e-05 | 4.01e-04 | 69 |
| GO:000646910 | Cervix | CC | negative regulation of protein kinase activity | 47/2311 | 212/18723 | 4.13e-05 | 6.36e-04 | 47 |
| GO:00063257 | Cervix | CC | chromatin organization | 78/2311 | 409/18723 | 5.40e-05 | 8.02e-04 | 78 |
| GO:00070646 | Cervix | CC | mitotic sister chromatid cohesion | 12/2311 | 28/18723 | 5.47e-05 | 8.06e-04 | 12 |
| GO:00073695 | Cervix | CC | gastrulation | 42/2311 | 185/18723 | 5.83e-05 | 8.46e-04 | 42 |
| GO:00456163 | Cervix | CC | regulation of keratinocyte differentiation | 14/2311 | 37/18723 | 6.97e-05 | 9.81e-04 | 14 |
| Page: 1 2 3 4 5 6 |
| Pathway ID | Tissue | Disease Stage | Description | Gene Ratio | Bg Ratio | pvalue | p.adjust | qvalue | Count |
| hsa04217 | Colorectum | SER | Necroptosis | 47/1580 | 159/8465 | 5.21e-04 | 4.44e-03 | 3.22e-03 | 47 |
| hsa042171 | Colorectum | SER | Necroptosis | 47/1580 | 159/8465 | 5.21e-04 | 4.44e-03 | 3.22e-03 | 47 |
| Page: 1 |
Top |
Cell-cell communication analysis |
| Identification of potential cell-cell interactions between two cell types and their ligand-receptor pairs for different disease states |
| Ligand | Receptor | LRpair | Pathway | Tissue | Disease Stage |
| Page: 1 |
Top |
Single-cell gene regulatory network inference analysis |
| Find out the significant the regulons (TFs) and the target genes of each regulon across cell types for different disease states |
| TF | Cell Type | Tissue | Disease Stage | Target Gene | RSS | Regulon Activity |
| ∗The dot plots of a searched regulon are shown for all cell subpopulations in each disease state of each tissue based on the regulon specific score inferred using pySCENIC and by calculating the average expression. |
| Page: 1 |
Top |
Somatic mutation of malignant transformation related genes |
| Annotation of somatic variants for genes involved in malignant transformation |
| Hugo Symbol | Variant Class | Variant Classification | dbSNP RS | HGVSc | HGVSp | HGVSp Short | SWISSPROT | BIOTYPE | SIFT | PolyPhen | Tumor Sample Barcode | Tissue | Histology | Sex | Age | Stage | Therapy Types | Drugs | Outcome |
| Page: 1 |
Top |
Related drugs of malignant transformation related genes |
| Identification of chemicals and drugs interact with genes involved in malignant transfromation |
| (DGIdb 4.0) |
| Entrez ID | Symbol | Category | Interaction Types | Drug Claim Name | Drug Name | PMIDs |
| Page: 1 |

Copyright 2023-Present -The University of Texas Health Science Center at Houston |