| Tissue | Expression Dynamics | Abbreviation |
| Cervix | 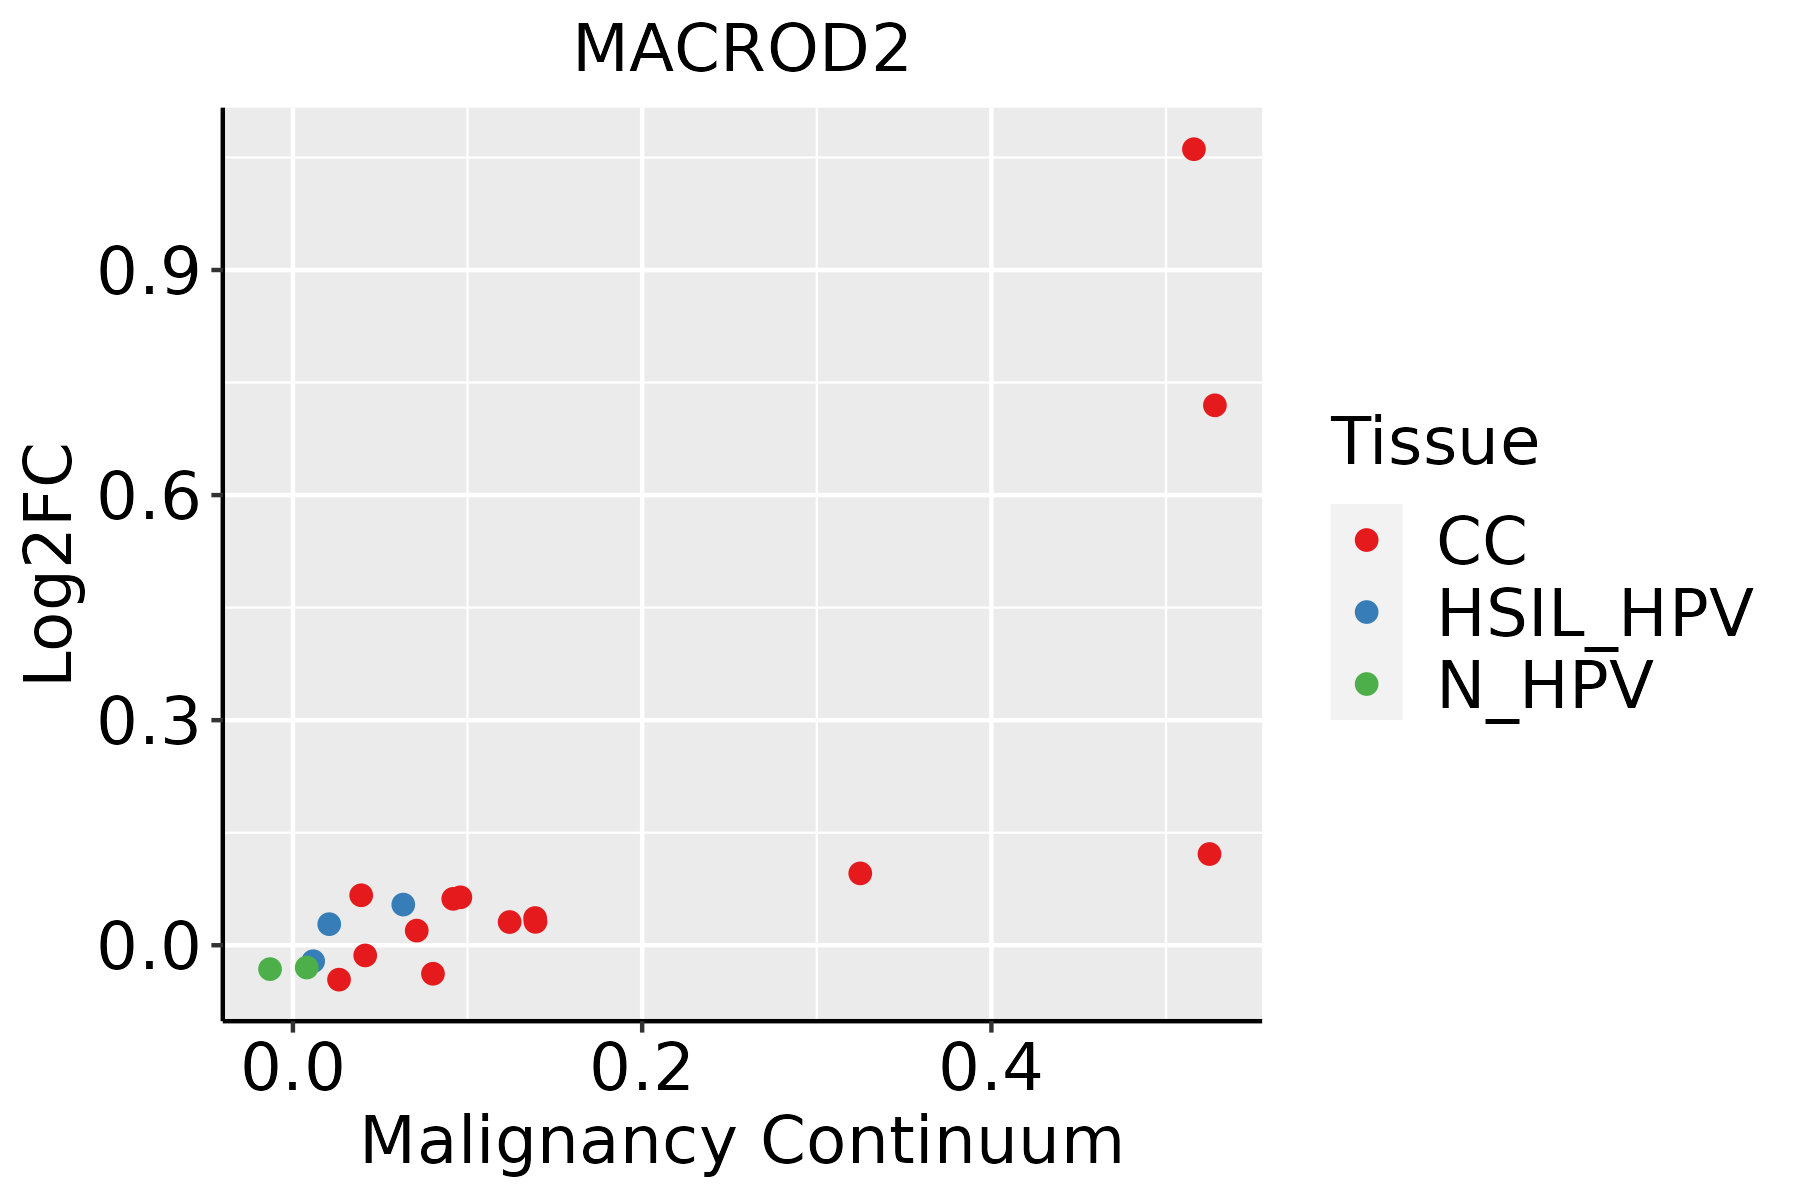 | CC: Cervix cancer |
| HSIL_HPV: HPV-infected high-grade squamous intraepithelial lesions |
| N_HPV: HPV-infected normal cervix |
| Colorectum (GSE201348) |  | FAP: Familial adenomatous polyposis |
| CRC: Colorectal cancer |
| Colorectum (HTA11) | 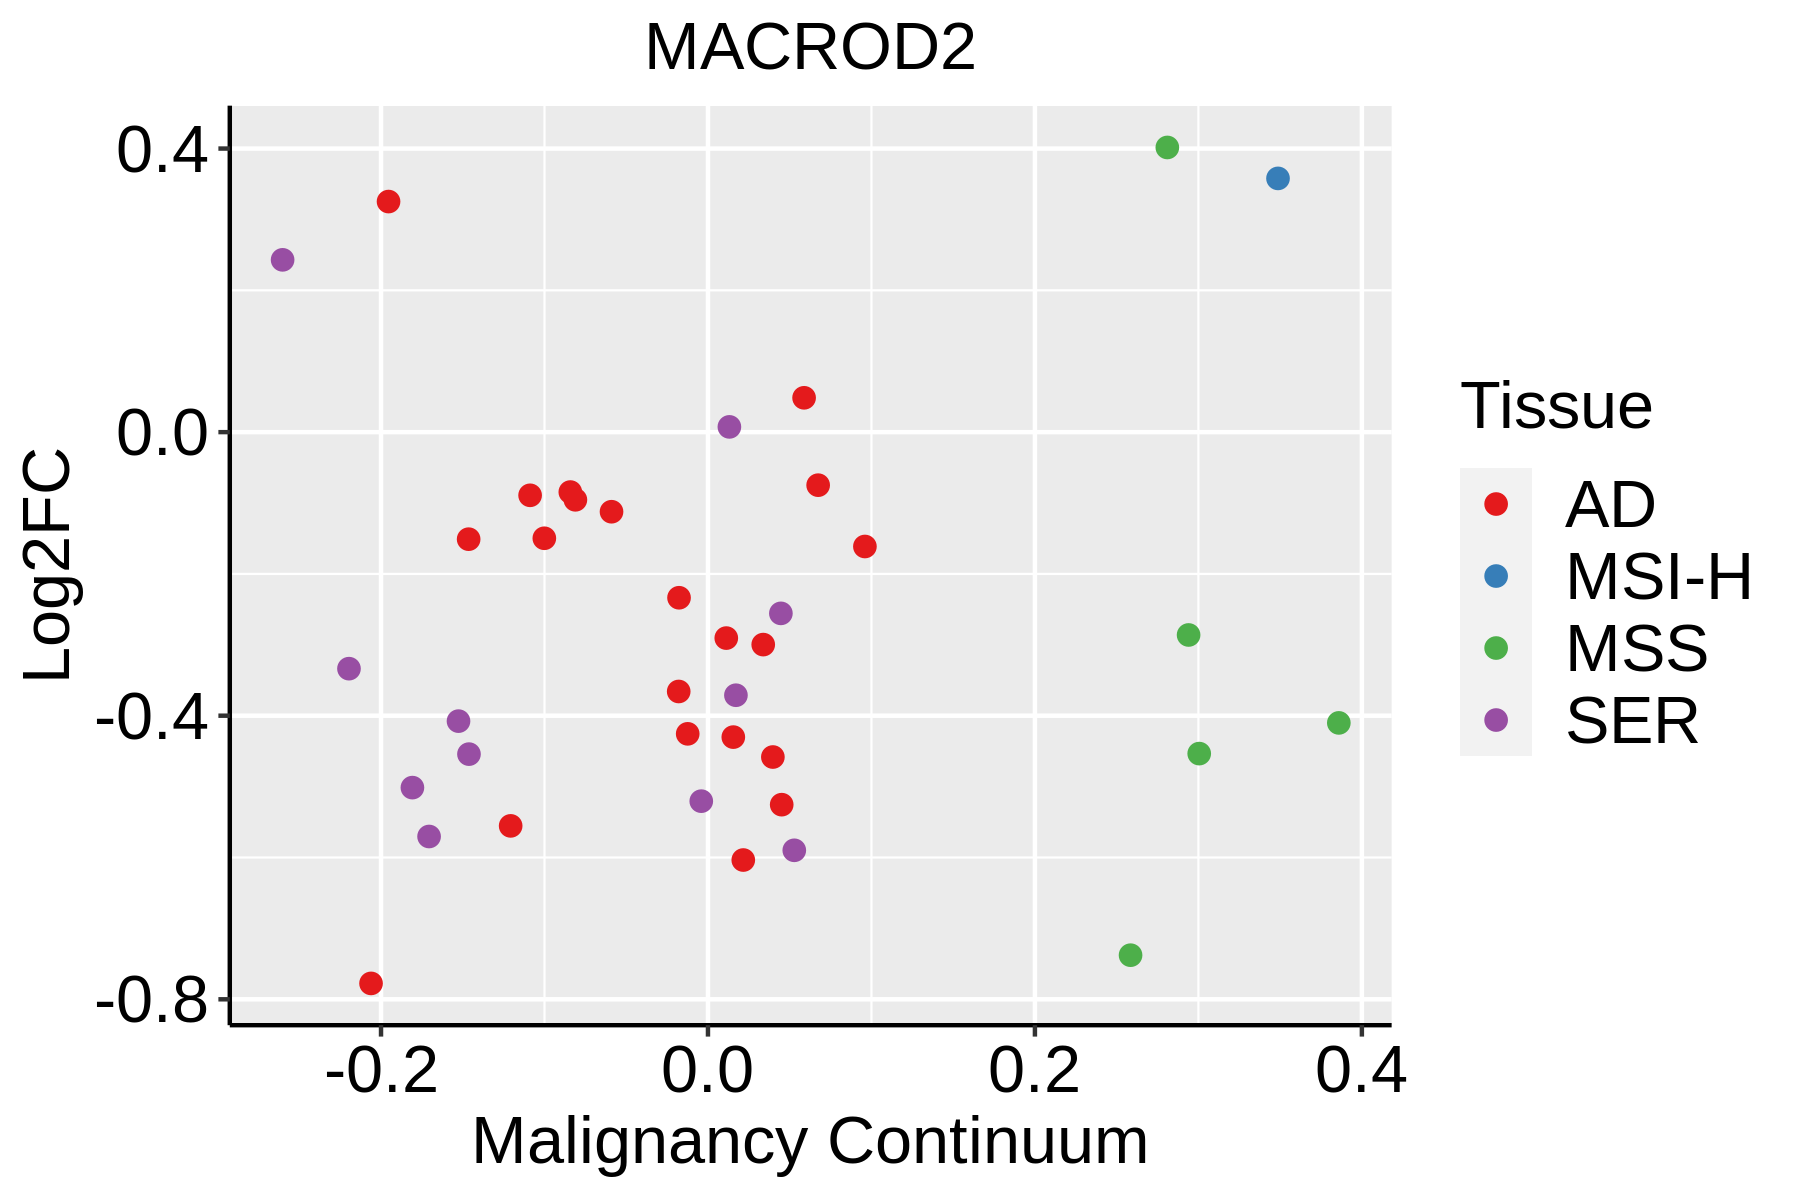 | AD: Adenomas |
| SER: Sessile serrated lesions |
| MSI-H: Microsatellite-high colorectal cancer |
| MSS: Microsatellite stable colorectal cancer |
| Endometrium | 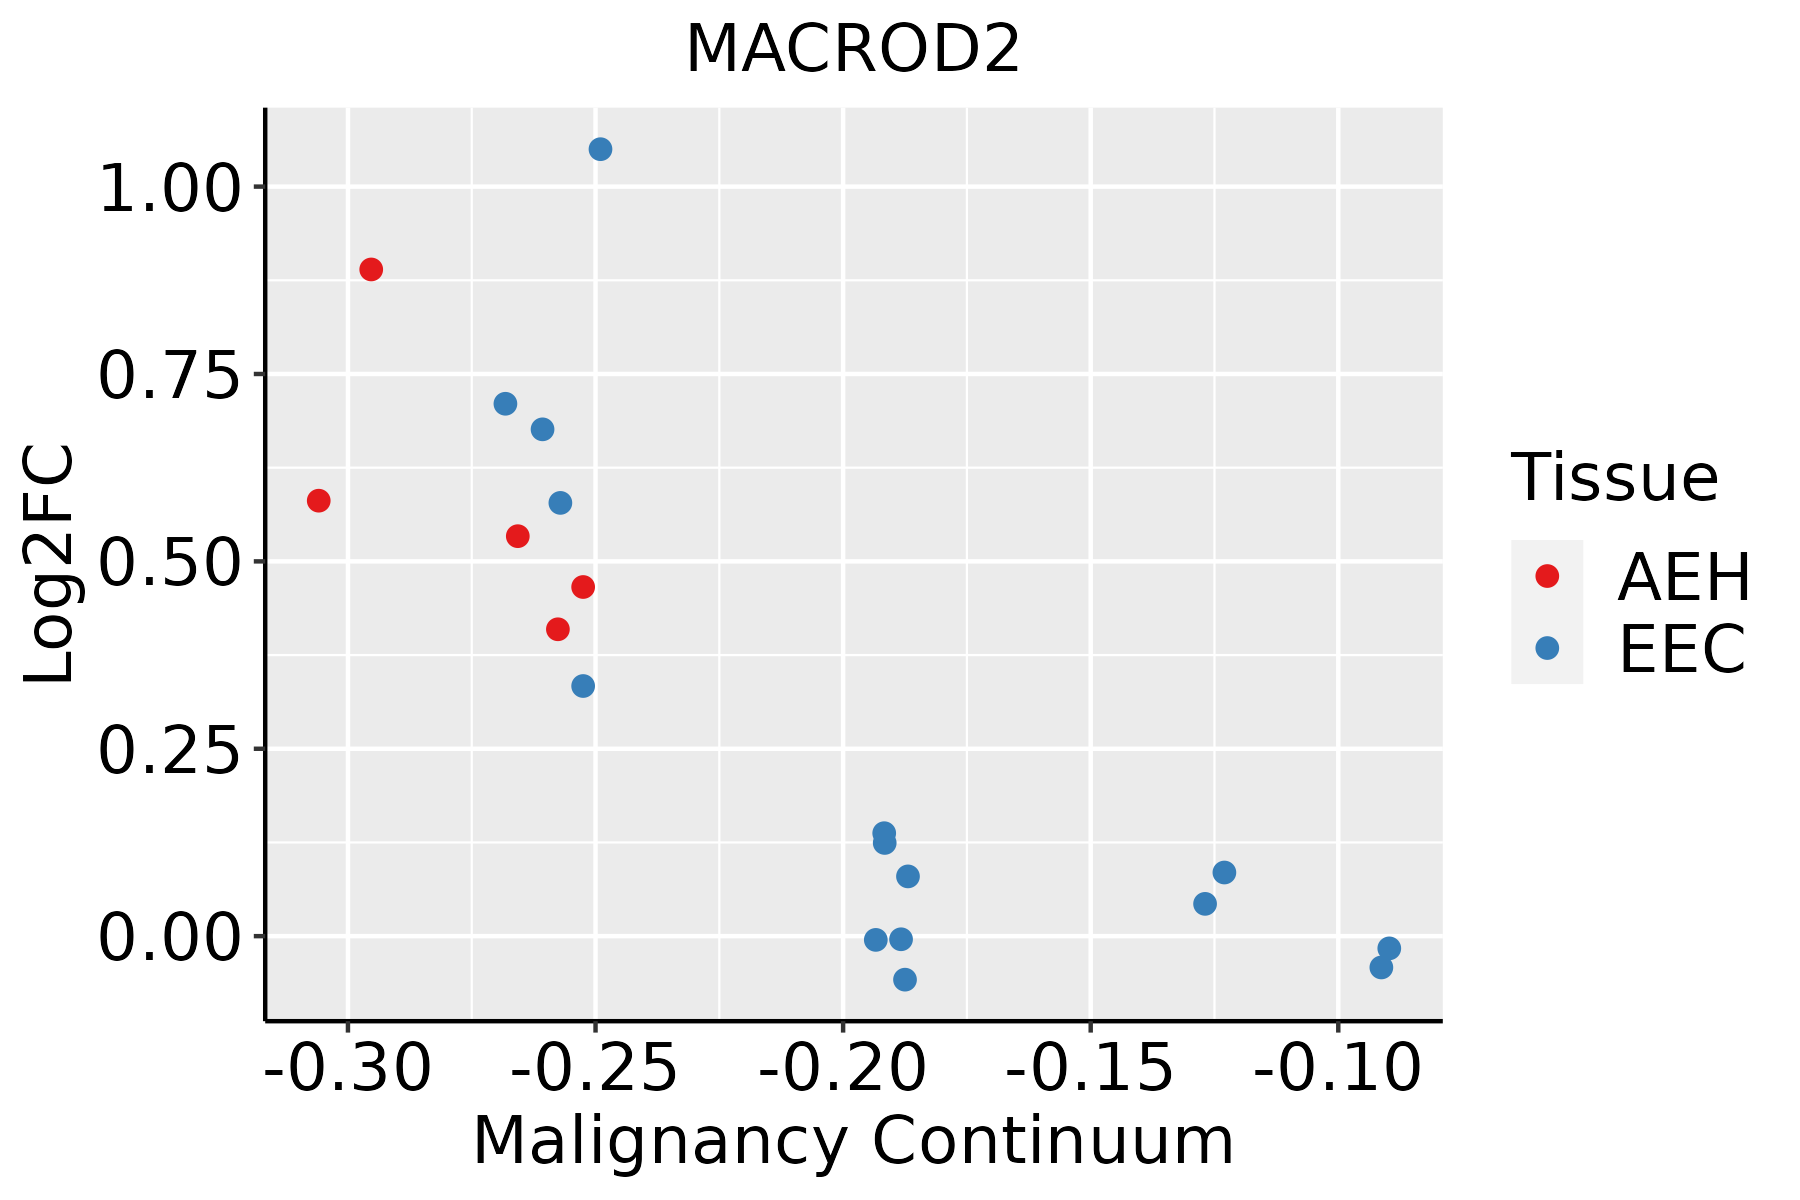 | AEH: Atypical endometrial hyperplasia |
| EEC: Endometrioid Cancer |
| Liver | 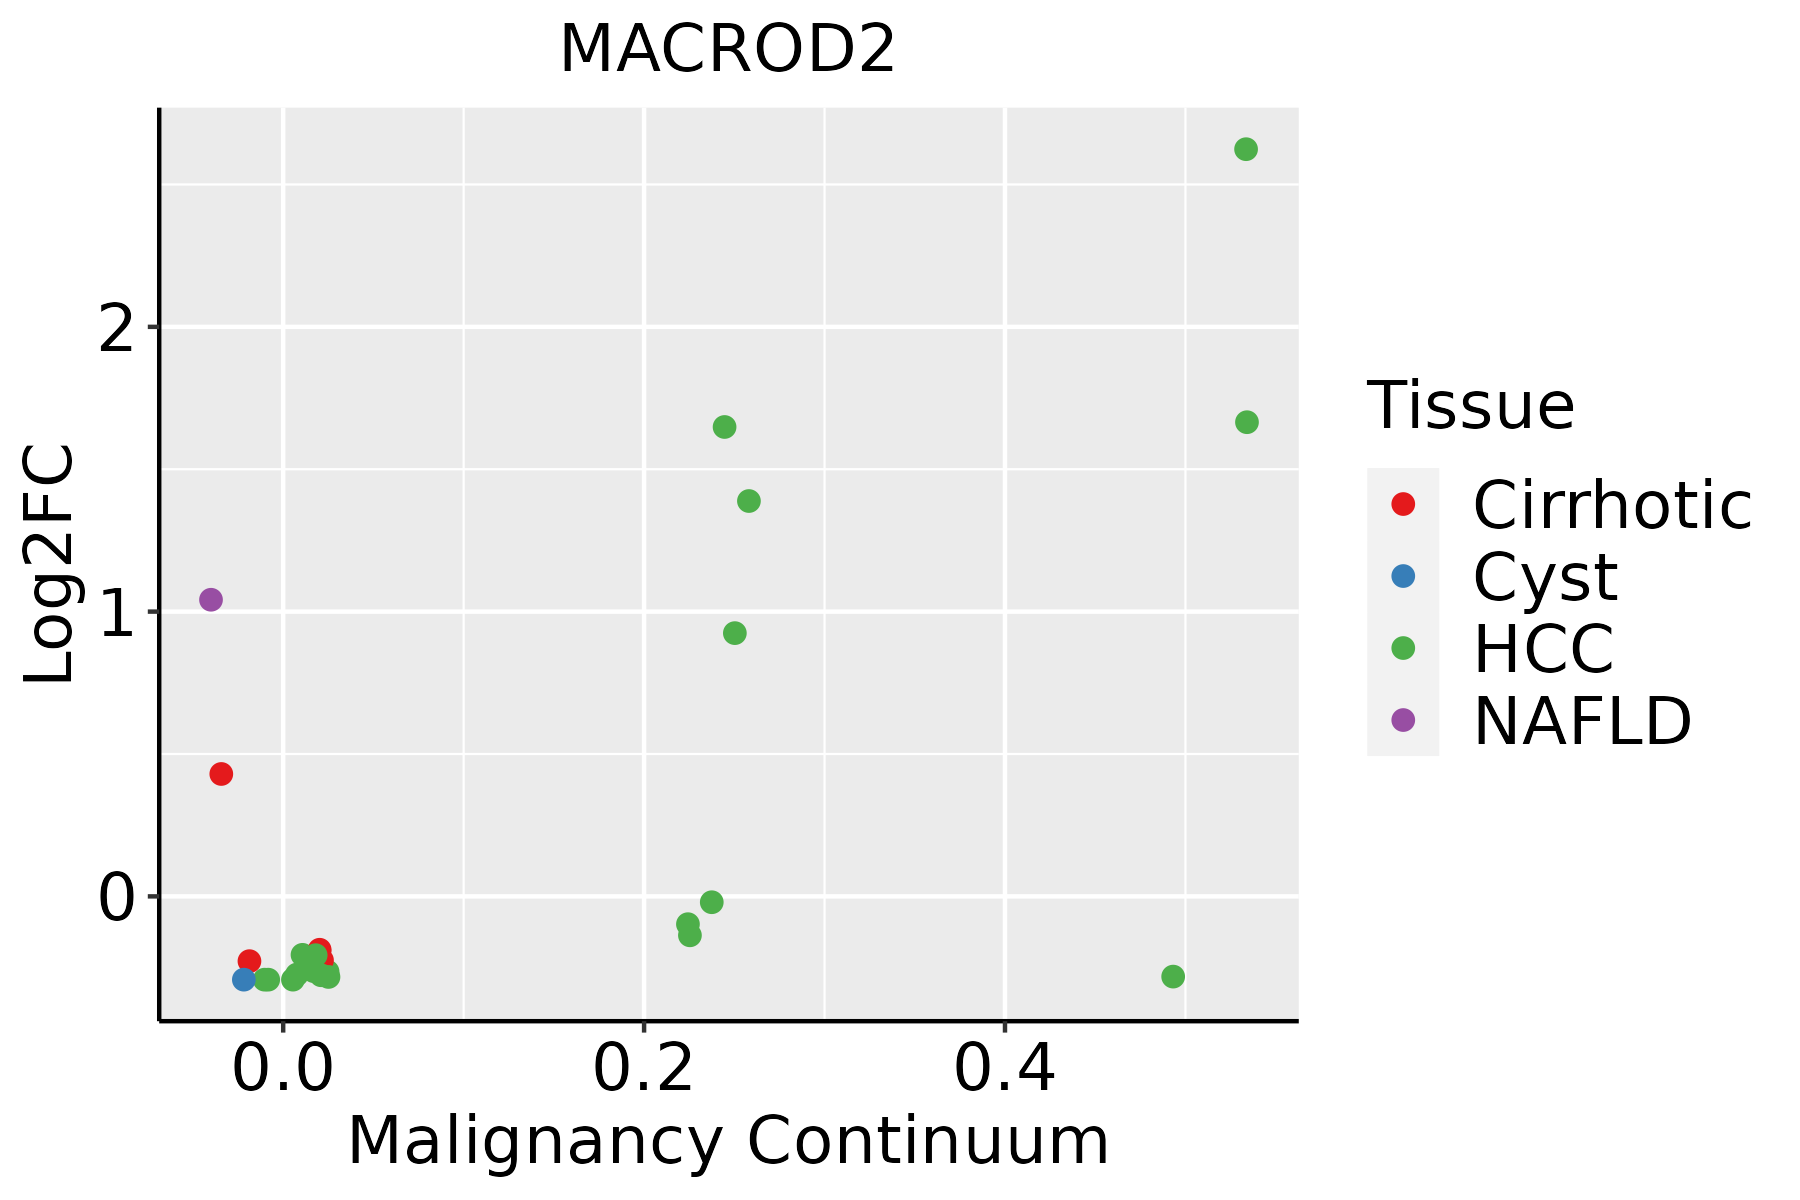 | HCC: Hepatocellular carcinoma |
| NAFLD: Non-alcoholic fatty liver disease |
| Lung |  | AAH: Atypical adenomatous hyperplasia |
| AIS: Adenocarcinoma in situ |
| IAC: Invasive lung adenocarcinoma |
| MIA: Minimally invasive adenocarcinoma |
| Skin | 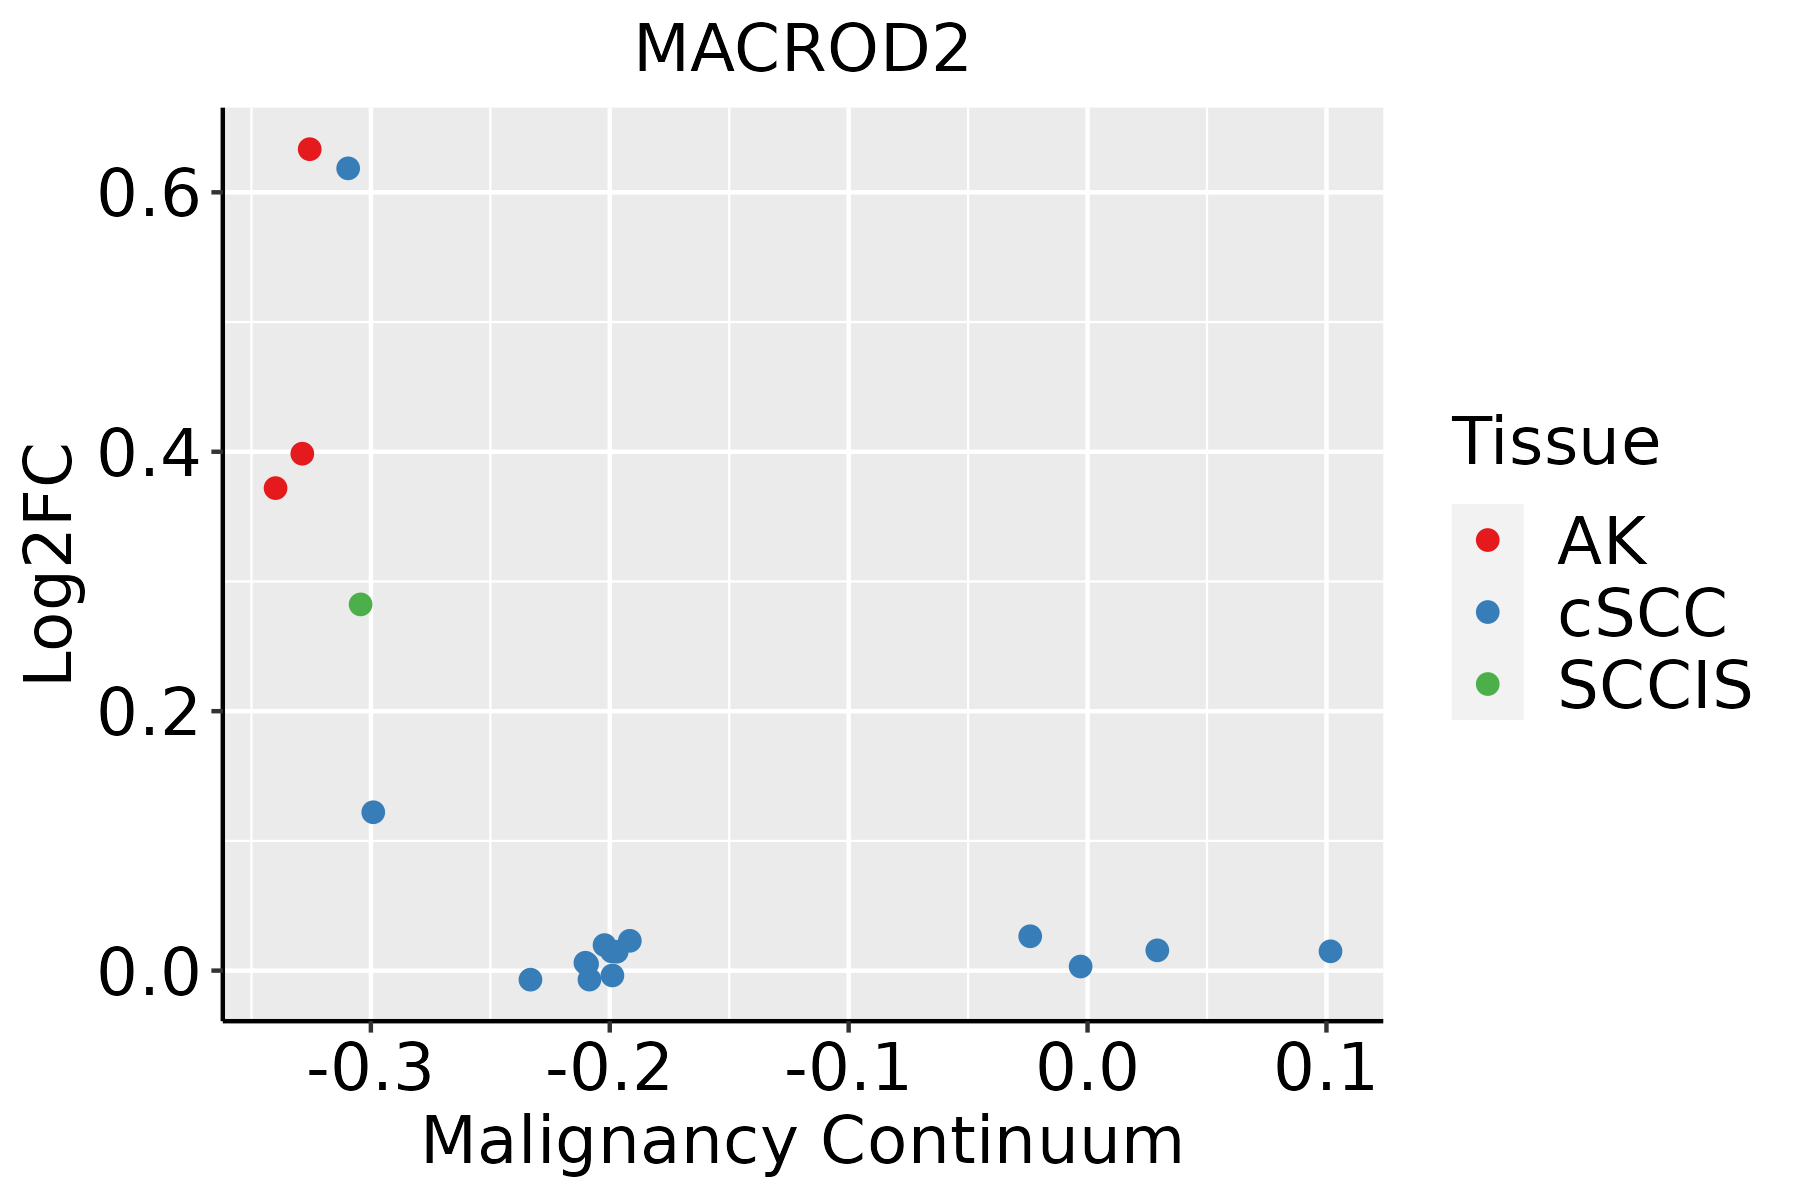 | AK: Actinic keratosis |
| cSCC: Cutaneous squamous cell carcinoma |
| SCCIS:squamous cell carcinoma in situ |
| Thyroid | 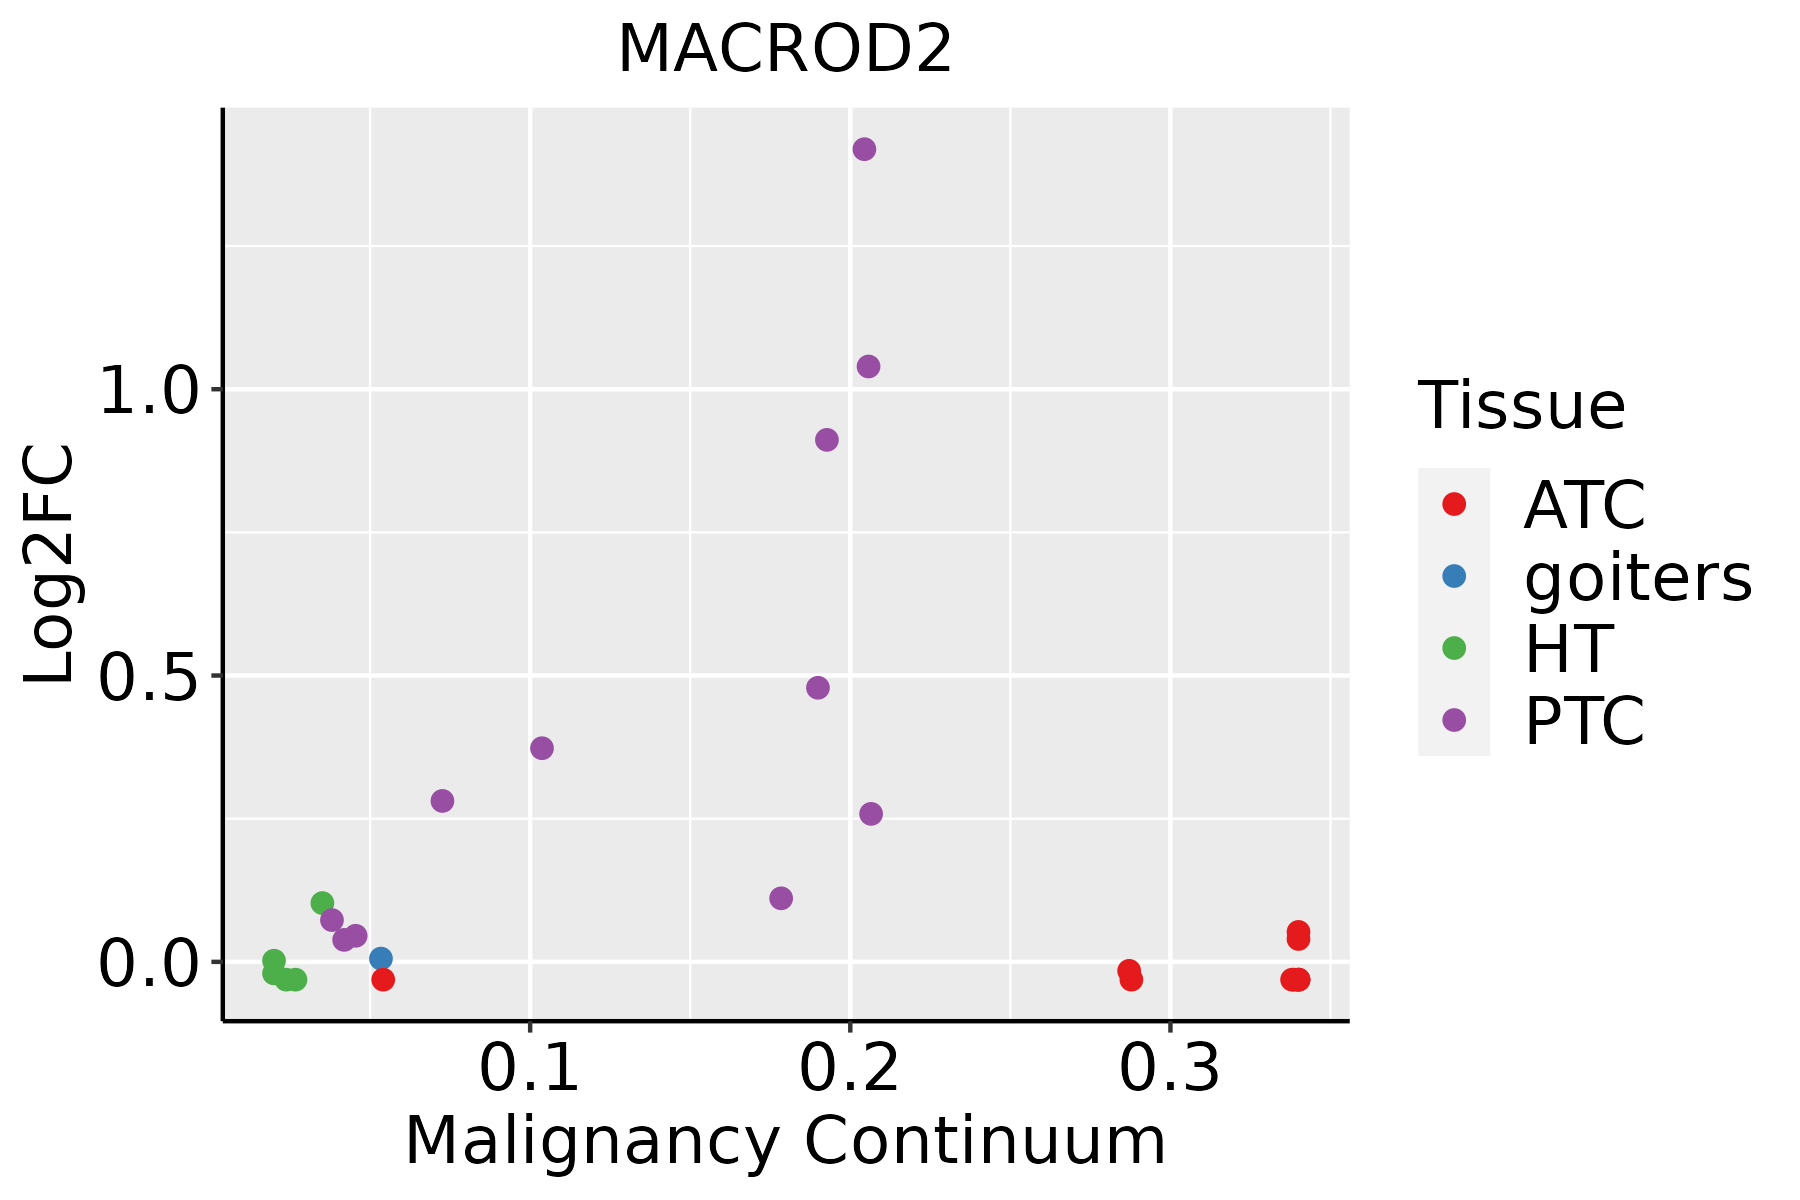 | ATC: Anaplastic thyroid cancer |
| HT: Hashimoto's thyroiditis |
| PTC: Papillary thyroid cancer |
| GO ID | Tissue | Disease Stage | Description | Gene Ratio | Bg Ratio | pvalue | p.adjust | Count |
| GO:007252110 | Cervix | CC | purine-containing compound metabolic process | 69/2311 | 416/18723 | 6.27e-03 | 3.54e-02 | 69 |
| GO:0072521 | Colorectum | AD | purine-containing compound metabolic process | 153/3918 | 416/18723 | 4.34e-14 | 1.01e-11 | 153 |
| GO:00725211 | Colorectum | SER | purine-containing compound metabolic process | 113/2897 | 416/18723 | 4.80e-10 | 5.68e-08 | 113 |
| GO:00725212 | Colorectum | MSS | purine-containing compound metabolic process | 132/3467 | 416/18723 | 4.13e-11 | 4.86e-09 | 132 |
| GO:00725214 | Colorectum | FAP | purine-containing compound metabolic process | 101/2622 | 416/18723 | 1.11e-08 | 1.33e-06 | 101 |
| GO:00725215 | Colorectum | CRC | purine-containing compound metabolic process | 79/2078 | 416/18723 | 1.15e-06 | 6.75e-05 | 79 |
| GO:007252116 | Endometrium | AEH | purine-containing compound metabolic process | 71/2100 | 416/18723 | 2.01e-04 | 2.54e-03 | 71 |
| GO:007252117 | Endometrium | EEC | purine-containing compound metabolic process | 73/2168 | 416/18723 | 1.82e-04 | 2.24e-03 | 73 |
| GO:00725217 | Liver | NAFLD | purine-containing compound metabolic process | 74/1882 | 416/18723 | 7.73e-07 | 4.27e-05 | 74 |
| GO:007252112 | Liver | Cirrhotic | purine-containing compound metabolic process | 156/4634 | 416/18723 | 3.74e-09 | 1.52e-07 | 156 |
| GO:19016572 | Liver | Cirrhotic | glycosyl compound metabolic process | 37/4634 | 88/18723 | 2.70e-04 | 2.40e-03 | 37 |
| GO:0042278 | Liver | Cirrhotic | purine nucleoside metabolic process | 13/4634 | 26/18723 | 4.72e-03 | 2.48e-02 | 13 |
| GO:0009116 | Liver | Cirrhotic | nucleoside metabolic process | 25/4634 | 62/18723 | 4.90e-03 | 2.56e-02 | 25 |
| GO:007252122 | Liver | HCC | purine-containing compound metabolic process | 250/7958 | 416/18723 | 2.26e-13 | 1.24e-11 | 250 |
| GO:19016571 | Liver | HCC | glycosyl compound metabolic process | 55/7958 | 88/18723 | 1.20e-04 | 1.01e-03 | 55 |
| GO:00091161 | Liver | HCC | nucleoside metabolic process | 37/7958 | 62/18723 | 4.73e-03 | 2.02e-02 | 37 |
| GO:00725218 | Lung | IAC | purine-containing compound metabolic process | 67/2061 | 416/18723 | 9.03e-04 | 1.11e-02 | 67 |
| GO:007252113 | Lung | AIS | purine-containing compound metabolic process | 61/1849 | 416/18723 | 1.10e-03 | 1.42e-02 | 61 |
| GO:007252123 | Lung | AAH | purine-containing compound metabolic process | 32/613 | 416/18723 | 7.55e-06 | 1.82e-03 | 32 |
| GO:007252126 | Skin | SCCIS | purine-containing compound metabolic process | 33/919 | 416/18723 | 4.69e-03 | 3.89e-02 | 33 |
| Hugo Symbol | Variant Class | Variant Classification | dbSNP RS | HGVSc | HGVSp | HGVSp Short | SWISSPROT | BIOTYPE | SIFT | PolyPhen | Tumor Sample Barcode | Tissue | Histology | Sex | Age | Stage | Therapy Types | Drugs | Outcome |
| MACROD2 | SNV | Missense_Mutation | rs757545585 | c.904N>A | p.Glu302Lys | p.E302K | A1Z1Q3 | protein_coding | tolerated_low_confidence(0.46) | benign(0.019) | TCGA-A8-A09I-01 | Breast | breast invasive carcinoma | Female | >=65 | I/II | Hormone Therapy | anastrozole | SD |
| MACROD2 | SNV | Missense_Mutation | novel | c.475N>A | p.Glu159Lys | p.E159K | A1Z1Q3 | protein_coding | tolerated(0.08) | possibly_damaging(0.831) | TCGA-AN-A046-01 | Breast | breast invasive carcinoma | Female | >=65 | I/II | Unknown | Unknown | SD |
| MACROD2 | SNV | Missense_Mutation | novel | c.545N>C | p.Phe182Ser | p.F182S | A1Z1Q3 | protein_coding | deleterious(0) | probably_damaging(1) | TCGA-D8-A1XW-01 | Breast | breast invasive carcinoma | Female | <65 | I/II | Chemotherapy | adriamycin+cyclophosphamide | SD |
| MACROD2 | insertion | Frame_Shift_Ins | novel | c.503_504insCACCACGT | p.Leu169ThrfsTer4 | p.L169Tfs*4 | A1Z1Q3 | protein_coding | | | TCGA-A8-A09Q-01 | Breast | breast invasive carcinoma | Female | >=65 | III/IV | Hormone Therapy | anastrozole | SD |
| MACROD2 | insertion | Nonsense_Mutation | novel | c.984_985insTAGCATATTTTAGCTAAAAAGTATTTTTCA | p.Asp328_Gly329insTer | p.D328_G329ins* | A1Z1Q3 | protein_coding | | | TCGA-B6-A402-01 | Breast | breast invasive carcinoma | Female | <65 | I/II | Chemotherapy | cyclophosphamide | PD |
| MACROD2 | SNV | Missense_Mutation | novel | c.75N>C | p.Glu25Asp | p.E25D | A1Z1Q3 | protein_coding | tolerated(0.22) | benign(0.122) | TCGA-VS-A958-01 | Cervix | cervical & endocervical cancer | Female | <65 | I/II | Chemotherapy | cisplatin | CR |
| MACROD2 | insertion | In_Frame_Ins | novel | c.738_739insGAA | p.Glu250dup | p.E250dup | A1Z1Q3 | protein_coding | | | TCGA-Q1-A73P-01 | Cervix | cervical & endocervical cancer | Female | <65 | I/II | Unknown | Unknown | SD |
| MACROD2 | SNV | Missense_Mutation | | c.559N>G | p.Thr187Ala | p.T187A | A1Z1Q3 | protein_coding | deleterious(0) | benign(0.385) | TCGA-AA-3510-01 | Colorectum | colon adenocarcinoma | Male | >=65 | I/II | Unknown | Unknown | SD |
| MACROD2 | SNV | Missense_Mutation | | c.49N>T | p.Arg17Cys | p.R17C | A1Z1Q3 | protein_coding | deleterious(0) | benign(0.042) | TCGA-AA-3864-01 | Colorectum | colon adenocarcinoma | Male | >=65 | I/II | Unknown | Unknown | SD |
| MACROD2 | SNV | Missense_Mutation | | c.97G>T | p.Asp33Tyr | p.D33Y | A1Z1Q3 | protein_coding | deleterious(0) | probably_damaging(0.953) | TCGA-AA-A010-01 | Colorectum | colon adenocarcinoma | Female | <65 | I/II | Chemotherapy | folinic | CR |


