
|
|||||
|
 | |
| |
| |
| |
| |
| |
|
Gene: LZTS2 |
Gene summary for LZTS2 |
| Gene information | Species | Human | Gene symbol | LZTS2 | Gene ID | 84445 |
| Gene name | leucine zipper tumor suppressor 2 | |
| Gene Alias | LAPSER1 | |
| Cytomap | 10q24.31 | |
| Gene Type | protein-coding | GO ID | GO:0000226 | UniProtAcc | B4DP66 |
Top |
Malignant transformation analysis |
| Identification of the aberrant gene expression in precancerous and cancerous lesions by comparing the gene expression of stem-like cells in diseased tissues with normal stem cells |
| Entrez ID | Symbol | Replicates | Species | Organ | Tissue | Adj P-value | Log2FC | Malignancy |
| 84445 | LZTS2 | LZE7T | Human | Esophagus | ESCC | 1.31e-02 | 1.48e-01 | 0.0667 |
| 84445 | LZTS2 | LZE24T | Human | Esophagus | ESCC | 1.49e-06 | 1.63e-01 | 0.0596 |
| 84445 | LZTS2 | P1T-E | Human | Esophagus | ESCC | 1.77e-06 | 3.80e-01 | 0.0875 |
| 84445 | LZTS2 | P2T-E | Human | Esophagus | ESCC | 6.91e-21 | 3.34e-01 | 0.1177 |
| 84445 | LZTS2 | P4T-E | Human | Esophagus | ESCC | 1.48e-16 | 3.15e-01 | 0.1323 |
| 84445 | LZTS2 | P5T-E | Human | Esophagus | ESCC | 8.04e-21 | 2.39e-01 | 0.1327 |
| 84445 | LZTS2 | P8T-E | Human | Esophagus | ESCC | 1.72e-18 | 1.74e-01 | 0.0889 |
| 84445 | LZTS2 | P9T-E | Human | Esophagus | ESCC | 4.47e-08 | 8.59e-02 | 0.1131 |
| 84445 | LZTS2 | P10T-E | Human | Esophagus | ESCC | 4.84e-05 | 1.46e-02 | 0.116 |
| 84445 | LZTS2 | P11T-E | Human | Esophagus | ESCC | 4.83e-09 | 3.32e-01 | 0.1426 |
| 84445 | LZTS2 | P12T-E | Human | Esophagus | ESCC | 6.99e-19 | 2.76e-01 | 0.1122 |
| 84445 | LZTS2 | P15T-E | Human | Esophagus | ESCC | 7.59e-12 | 3.56e-01 | 0.1149 |
| 84445 | LZTS2 | P16T-E | Human | Esophagus | ESCC | 8.68e-19 | 3.37e-01 | 0.1153 |
| 84445 | LZTS2 | P20T-E | Human | Esophagus | ESCC | 3.45e-10 | 2.42e-01 | 0.1124 |
| 84445 | LZTS2 | P21T-E | Human | Esophagus | ESCC | 3.70e-10 | 7.04e-02 | 0.1617 |
| 84445 | LZTS2 | P22T-E | Human | Esophagus | ESCC | 2.49e-14 | 1.11e-01 | 0.1236 |
| 84445 | LZTS2 | P23T-E | Human | Esophagus | ESCC | 1.15e-09 | 1.94e-01 | 0.108 |
| 84445 | LZTS2 | P24T-E | Human | Esophagus | ESCC | 4.52e-16 | 1.09e-01 | 0.1287 |
| 84445 | LZTS2 | P26T-E | Human | Esophagus | ESCC | 4.62e-10 | 1.76e-01 | 0.1276 |
| 84445 | LZTS2 | P27T-E | Human | Esophagus | ESCC | 5.64e-18 | 2.48e-01 | 0.1055 |
| Page: 1 2 3 4 |
| Tissue | Expression Dynamics | Abbreviation |
| Esophagus |  | ESCC: Esophageal squamous cell carcinoma |
| HGIN: High-grade intraepithelial neoplasias | ||
| LGIN: Low-grade intraepithelial neoplasias | ||
| Liver | 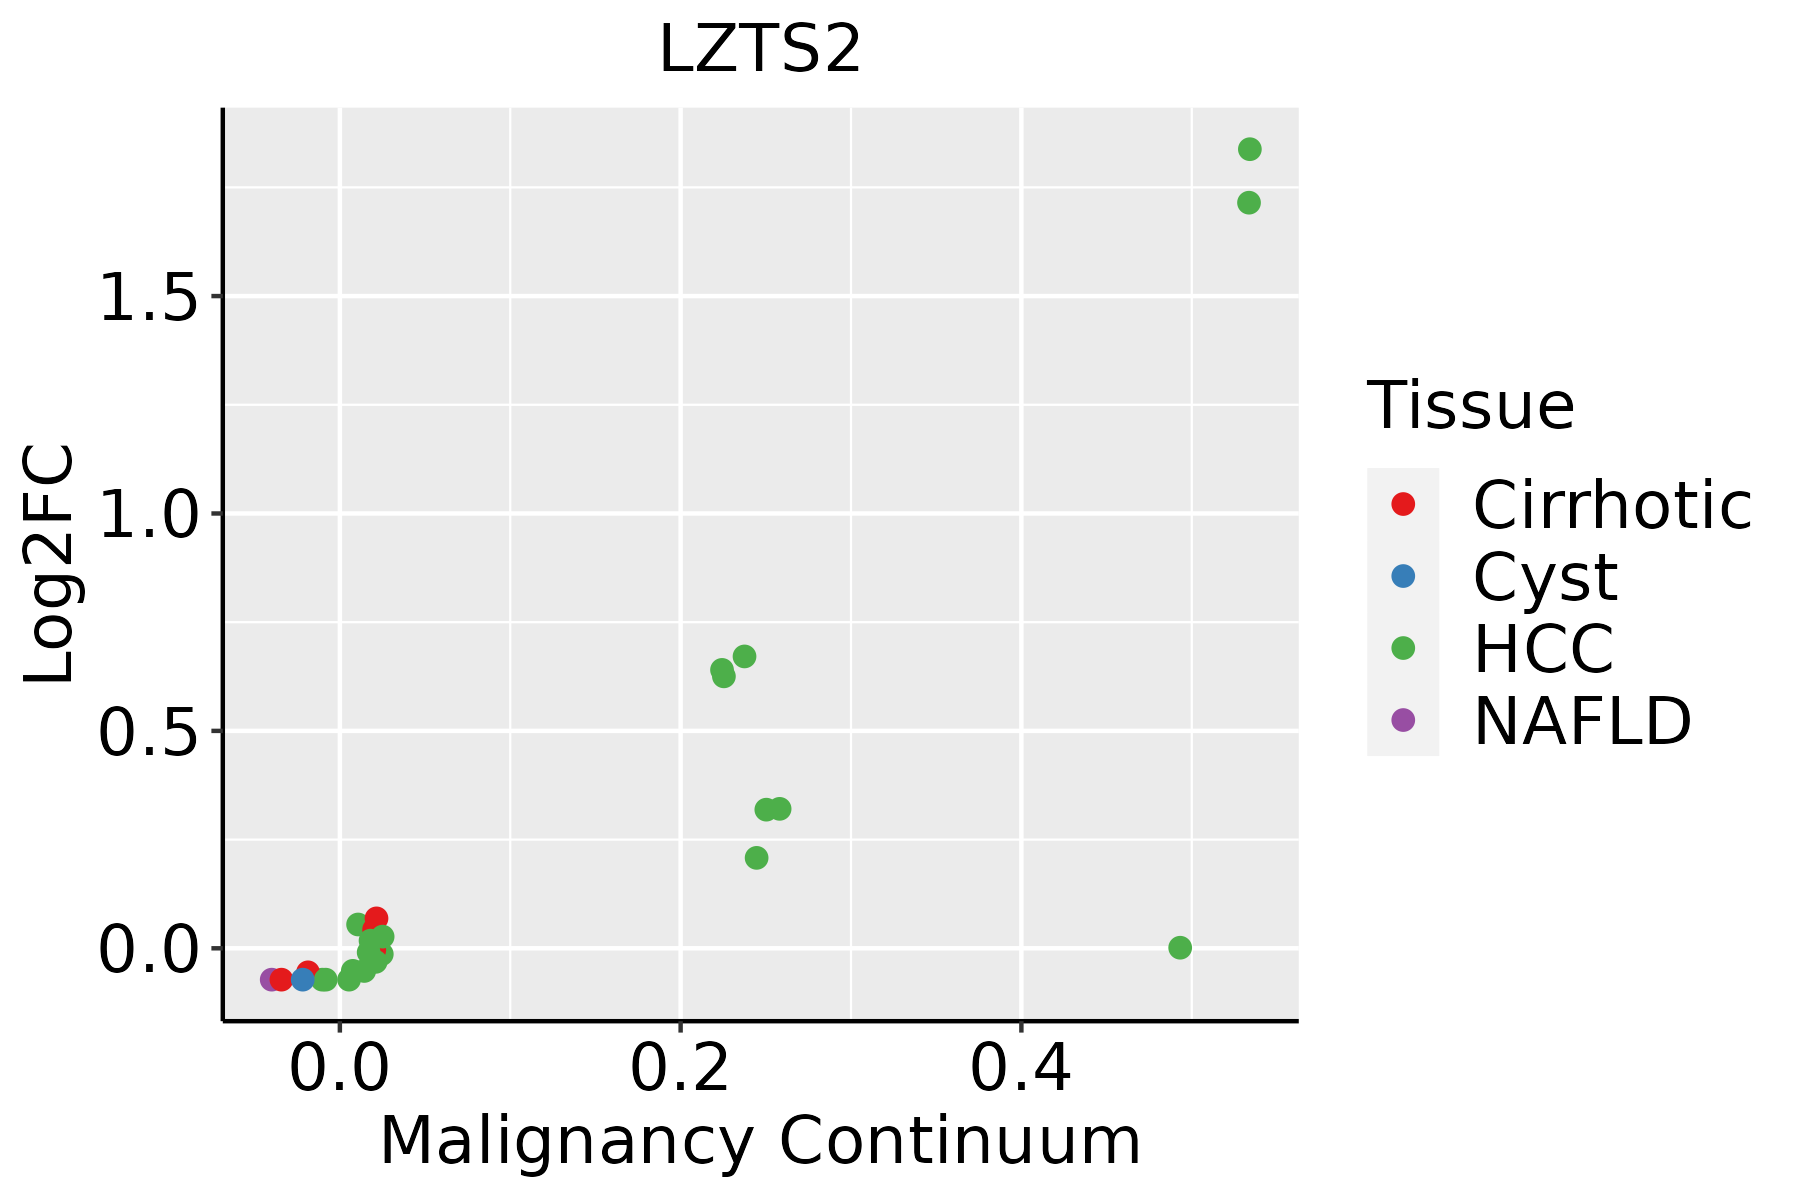 | HCC: Hepatocellular carcinoma |
| NAFLD: Non-alcoholic fatty liver disease | ||
| Thyroid |  | ATC: Anaplastic thyroid cancer |
| HT: Hashimoto's thyroiditis | ||
| PTC: Papillary thyroid cancer |
| ∗log2FC in expression of this searched gene in stem-like cells from each diseased tissue sample relative to stem-like cells in normal samples in each tissue plotted against the malignancy continuum. Samples are colored based on if they are from different disease stage. |
Top |
Malignant transformation related pathway analysis |
| Find out the enriched GO biological processes and KEGG pathways involved in transition from healthy to precancer to cancer |
| Tissue | Disease Stage | Enriched GO biological Processes |
| Colorectum | AD |  |
| Colorectum | SER |  |
| Colorectum | MSS |  |
| Colorectum | MSI-H |  |
| Colorectum | FAP |  |
| ∗Top 15 enriched GO BP terms are showed in the bar plot of each disease state in each tissue. Each row represents a significant GO biological process which is colored according to the -log10(p.adjust). |
| Page: 1 2 3 4 5 6 7 8 9 |
| GO ID | Tissue | Disease Stage | Description | Gene Ratio | Bg Ratio | pvalue | p.adjust | Count |
| GO:0006913110 | Esophagus | ESCC | nucleocytoplasmic transport | 230/8552 | 301/18723 | 6.04e-28 | 2.02e-25 | 230 |
| GO:0051169110 | Esophagus | ESCC | nuclear transport | 230/8552 | 301/18723 | 6.04e-28 | 2.02e-25 | 230 |
| GO:003450418 | Esophagus | ESCC | protein localization to nucleus | 211/8552 | 290/18723 | 4.06e-21 | 6.60e-19 | 211 |
| GO:0051168110 | Esophagus | ESCC | nuclear export | 126/8552 | 154/18723 | 1.88e-20 | 2.65e-18 | 126 |
| GO:000705114 | Esophagus | ESCC | spindle organization | 134/8552 | 184/18723 | 5.70e-14 | 2.87e-12 | 134 |
| GO:190018018 | Esophagus | ESCC | regulation of protein localization to nucleus | 102/8552 | 136/18723 | 2.84e-12 | 1.13e-10 | 102 |
| GO:001605517 | Esophagus | ESCC | Wnt signaling pathway | 268/8552 | 444/18723 | 2.32e-10 | 6.58e-09 | 268 |
| GO:019873817 | Esophagus | ESCC | cell-cell signaling by wnt | 269/8552 | 446/18723 | 2.41e-10 | 6.79e-09 | 269 |
| GO:000028115 | Esophagus | ESCC | mitotic cytokinesis | 58/8552 | 71/18723 | 4.34e-10 | 1.15e-08 | 58 |
| GO:00512256 | Esophagus | ESCC | spindle assembly | 85/8552 | 117/18723 | 2.72e-09 | 5.98e-08 | 85 |
| GO:000091016 | Esophagus | ESCC | cytokinesis | 115/8552 | 173/18723 | 2.48e-08 | 4.68e-07 | 115 |
| GO:006164015 | Esophagus | ESCC | cytoskeleton-dependent cytokinesis | 72/8552 | 100/18723 | 8.10e-08 | 1.39e-06 | 72 |
| GO:003011117 | Esophagus | ESCC | regulation of Wnt signaling pathway | 194/8552 | 328/18723 | 5.39e-07 | 7.14e-06 | 194 |
| GO:006007016 | Esophagus | ESCC | canonical Wnt signaling pathway | 180/8552 | 303/18723 | 9.15e-07 | 1.17e-05 | 180 |
| GO:006082817 | Esophagus | ESCC | regulation of canonical Wnt signaling pathway | 153/8552 | 253/18723 | 1.38e-06 | 1.67e-05 | 153 |
| GO:006056210 | Esophagus | ESCC | epithelial tube morphogenesis | 187/8552 | 325/18723 | 9.95e-06 | 9.44e-05 | 187 |
| GO:19038289 | Esophagus | ESCC | negative regulation of cellular protein localization | 76/8552 | 117/18723 | 1.97e-05 | 1.72e-04 | 76 |
| GO:006056010 | Esophagus | ESCC | developmental growth involved in morphogenesis | 131/8552 | 234/18723 | 9.28e-04 | 4.73e-03 | 131 |
| GO:00301788 | Esophagus | ESCC | negative regulation of Wnt signaling pathway | 97/8552 | 170/18723 | 1.81e-03 | 8.31e-03 | 97 |
| GO:00900905 | Esophagus | ESCC | negative regulation of canonical Wnt signaling pathway | 78/8552 | 137/18723 | 5.17e-03 | 1.95e-02 | 78 |
| Page: 1 2 3 4 5 6 |
| Pathway ID | Tissue | Disease Stage | Description | Gene Ratio | Bg Ratio | pvalue | p.adjust | qvalue | Count |
| Page: 1 |
Top |
Cell-cell communication analysis |
| Identification of potential cell-cell interactions between two cell types and their ligand-receptor pairs for different disease states |
| Ligand | Receptor | LRpair | Pathway | Tissue | Disease Stage |
| Page: 1 |
Top |
Single-cell gene regulatory network inference analysis |
| Find out the significant the regulons (TFs) and the target genes of each regulon across cell types for different disease states |
| TF | Cell Type | Tissue | Disease Stage | Target Gene | RSS | Regulon Activity |
| ∗The dot plots of a searched regulon are shown for all cell subpopulations in each disease state of each tissue based on the regulon specific score inferred using pySCENIC and by calculating the average expression. |
| Page: 1 |
Top |
Somatic mutation of malignant transformation related genes |
| Annotation of somatic variants for genes involved in malignant transformation |
| Hugo Symbol | Variant Class | Variant Classification | dbSNP RS | HGVSc | HGVSp | HGVSp Short | SWISSPROT | BIOTYPE | SIFT | PolyPhen | Tumor Sample Barcode | Tissue | Histology | Sex | Age | Stage | Therapy Types | Drugs | Outcome |
| LZTS2 | SNV | Missense_Mutation | c.919N>A | p.Cys307Ser | p.C307S | Q9BRK4 | protein_coding | tolerated(0.26) | benign(0) | TCGA-AR-A0TR-01 | Breast | breast invasive carcinoma | Female | >=65 | I/II | Hormone Therapy | tamoxiphen | SD | |
| LZTS2 | SNV | Missense_Mutation | c.178N>A | p.Asp60Asn | p.D60N | Q9BRK4 | protein_coding | deleterious(0.04) | benign(0.227) | TCGA-BH-A18V-01 | Breast | breast invasive carcinoma | Female | <65 | I/II | Unknown | Unknown | SD | |
| LZTS2 | SNV | Missense_Mutation | novel | c.557C>T | p.Pro186Leu | p.P186L | Q9BRK4 | protein_coding | tolerated(0.12) | benign(0.001) | TCGA-E9-A22B-01 | Breast | breast invasive carcinoma | Female | >=65 | I/II | Hormone Therapy | tamoxiphen | SD |
| LZTS2 | insertion | Frame_Shift_Ins | novel | c.567_568insAG | p.Ser191ProfsTer96 | p.S191Pfs*96 | Q9BRK4 | protein_coding | TCGA-A8-A07J-01 | Breast | breast invasive carcinoma | Female | <65 | I/II | Chemotherapy | 5-fluorouracil | CR | ||
| LZTS2 | insertion | Nonsense_Mutation | novel | c.568_569insGATGTTGAGGATGCCCGAGAGCAGCGGGCACACAATGCCCA | p.Ser190Ter | p.S190* | Q9BRK4 | protein_coding | TCGA-A8-A07J-01 | Breast | breast invasive carcinoma | Female | <65 | I/II | Chemotherapy | 5-fluorouracil | CR | ||
| LZTS2 | insertion | In_Frame_Ins | novel | c.17_18insATTTATAACTTTCACAGGCTT | p.Thr6_Leu7insPheIleThrPheThrGlyPhe | p.T6_L7insFITFTGF | Q9BRK4 | protein_coding | TCGA-A8-A08H-01 | Breast | breast invasive carcinoma | Female | >=65 | I/II | Unknown | Unknown | SD | ||
| LZTS2 | SNV | Missense_Mutation | novel | c.943C>T | p.Pro315Ser | p.P315S | Q9BRK4 | protein_coding | tolerated(0.3) | benign(0.22) | TCGA-2W-A8YY-01 | Cervix | cervical & endocervical cancer | Female | <65 | I/II | Chemotherapy | cisplatin | CR |
| LZTS2 | SNV | Missense_Mutation | c.91N>G | p.Ser31Gly | p.S31G | Q9BRK4 | protein_coding | deleterious(0) | probably_damaging(0.968) | TCGA-AA-3663-01 | Colorectum | colon adenocarcinoma | Male | <65 | I/II | Unknown | Unknown | SD | |
| LZTS2 | SNV | Missense_Mutation | c.210N>T | p.Gln70His | p.Q70H | Q9BRK4 | protein_coding | deleterious(0.01) | probably_damaging(0.969) | TCGA-CM-4746-01 | Colorectum | colon adenocarcinoma | Male | <65 | I/II | Unknown | Unknown | SD | |
| LZTS2 | SNV | Missense_Mutation | rs550892828 | c.1658C>T | p.Ala553Val | p.A553V | Q9BRK4 | protein_coding | tolerated(0.47) | benign(0.324) | TCGA-CM-4752-01 | Colorectum | colon adenocarcinoma | Male | <65 | I/II | Unknown | Unknown | SD |
| Page: 1 2 3 4 5 6 |
Top |
Related drugs of malignant transformation related genes |
| Identification of chemicals and drugs interact with genes involved in malignant transfromation |
| (DGIdb 4.0) |
| Entrez ID | Symbol | Category | Interaction Types | Drug Claim Name | Drug Name | PMIDs |
| Page: 1 |

Copyright 2023-Present -The University of Texas Health Science Center at Houston |