
|
|||||
|
 | |
| |
| |
| |
| |
| |
|
Gene: LZIC |
Gene summary for LZIC |
| Gene information | Species | Human | Gene symbol | LZIC | Gene ID | 84328 |
| Gene name | leucine zipper and CTNNBIP1 domain containing | |
| Gene Alias | LZIC | |
| Cytomap | 1p36.22 | |
| Gene Type | protein-coding | GO ID | GO:0008150 | UniProtAcc | A0A024R4I7 |
Top |
Malignant transformation analysis |
| Identification of the aberrant gene expression in precancerous and cancerous lesions by comparing the gene expression of stem-like cells in diseased tissues with normal stem cells |
| Entrez ID | Symbol | Replicates | Species | Organ | Tissue | Adj P-value | Log2FC | Malignancy |
| 84328 | LZIC | HTA11_2487_2000001011 | Human | Colorectum | SER | 1.13e-03 | 3.09e-01 | -0.1808 |
| 84328 | LZIC | HTA11_78_2000001011 | Human | Colorectum | AD | 1.58e-03 | 3.10e-01 | -0.1088 |
| 84328 | LZIC | HTA11_347_2000001011 | Human | Colorectum | AD | 9.68e-20 | 5.29e-01 | -0.1954 |
| 84328 | LZIC | HTA11_6801_2000001011 | Human | Colorectum | SER | 1.86e-02 | 3.57e-01 | 0.0171 |
| 84328 | LZIC | LZE2T | Human | Esophagus | ESCC | 1.58e-06 | 7.77e-01 | 0.082 |
| 84328 | LZIC | LZE4T | Human | Esophagus | ESCC | 2.77e-17 | 5.22e-01 | 0.0811 |
| 84328 | LZIC | LZE5T | Human | Esophagus | ESCC | 1.76e-04 | 2.40e-01 | 0.0514 |
| 84328 | LZIC | LZE7T | Human | Esophagus | ESCC | 2.50e-08 | 3.43e-01 | 0.0667 |
| 84328 | LZIC | LZE8T | Human | Esophagus | ESCC | 6.78e-04 | 1.16e-01 | 0.067 |
| 84328 | LZIC | LZE20T | Human | Esophagus | ESCC | 5.59e-10 | 2.92e-01 | 0.0662 |
| 84328 | LZIC | LZE22T | Human | Esophagus | ESCC | 1.13e-09 | 6.12e-01 | 0.068 |
| 84328 | LZIC | LZE24T | Human | Esophagus | ESCC | 1.36e-26 | 5.89e-01 | 0.0596 |
| 84328 | LZIC | LZE6T | Human | Esophagus | ESCC | 2.99e-04 | 1.80e-01 | 0.0845 |
| 84328 | LZIC | P1T-E | Human | Esophagus | ESCC | 4.21e-07 | 3.25e-01 | 0.0875 |
| 84328 | LZIC | P2T-E | Human | Esophagus | ESCC | 5.35e-48 | 7.84e-01 | 0.1177 |
| 84328 | LZIC | P4T-E | Human | Esophagus | ESCC | 1.57e-32 | 6.46e-01 | 0.1323 |
| 84328 | LZIC | P5T-E | Human | Esophagus | ESCC | 2.20e-41 | 7.08e-01 | 0.1327 |
| 84328 | LZIC | P8T-E | Human | Esophagus | ESCC | 3.43e-24 | 3.88e-01 | 0.0889 |
| 84328 | LZIC | P9T-E | Human | Esophagus | ESCC | 1.03e-12 | 3.21e-01 | 0.1131 |
| 84328 | LZIC | P10T-E | Human | Esophagus | ESCC | 9.33e-28 | 5.73e-01 | 0.116 |
| Page: 1 2 3 4 5 6 |
| Tissue | Expression Dynamics | Abbreviation |
| Colorectum (GSE201348) |  | FAP: Familial adenomatous polyposis |
| CRC: Colorectal cancer | ||
| Colorectum (HTA11) |  | AD: Adenomas |
| SER: Sessile serrated lesions | ||
| MSI-H: Microsatellite-high colorectal cancer | ||
| MSS: Microsatellite stable colorectal cancer | ||
| Esophagus | 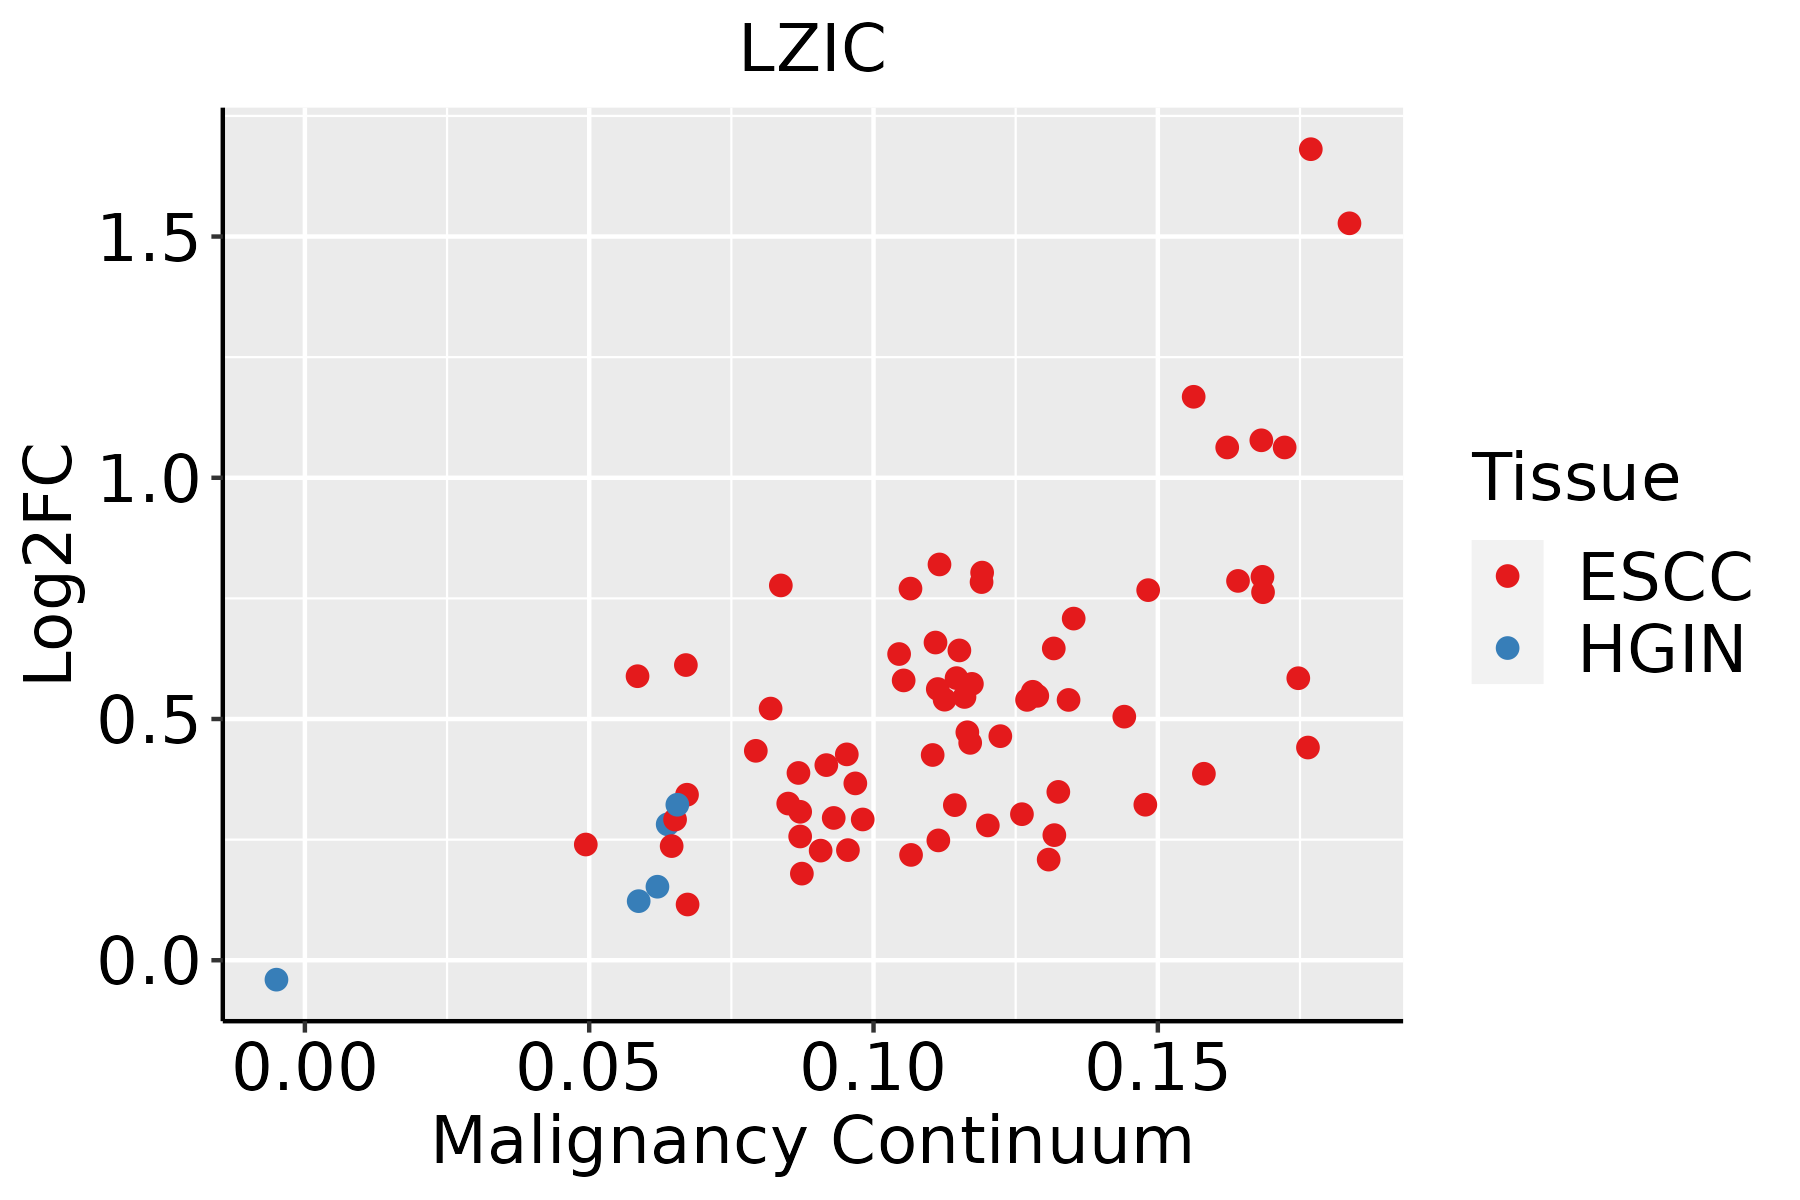 | ESCC: Esophageal squamous cell carcinoma |
| HGIN: High-grade intraepithelial neoplasias | ||
| LGIN: Low-grade intraepithelial neoplasias | ||
| Liver | 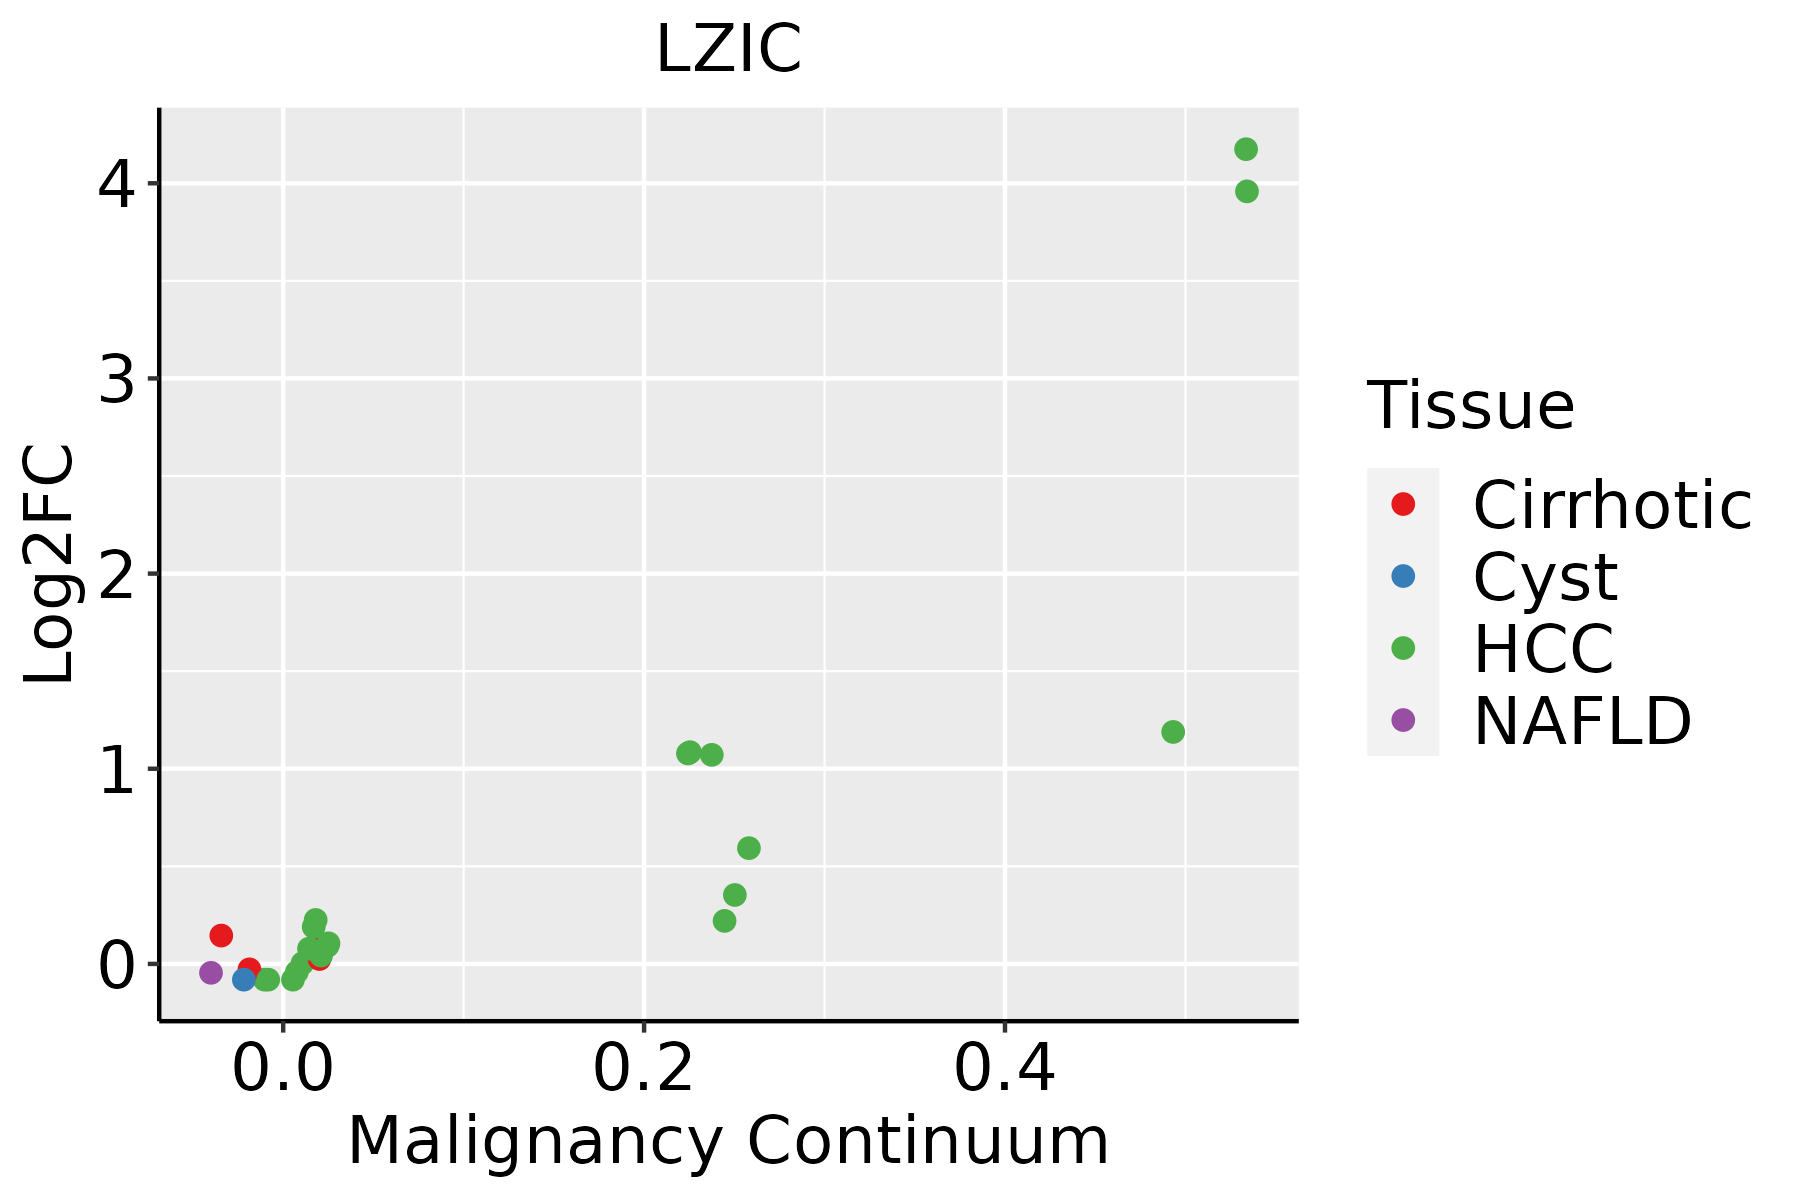 | HCC: Hepatocellular carcinoma |
| NAFLD: Non-alcoholic fatty liver disease | ||
| Oral Cavity |  | EOLP: Erosive Oral lichen planus |
| LP: leukoplakia | ||
| NEOLP: Non-erosive oral lichen planus | ||
| OSCC: Oral squamous cell carcinoma | ||
| Skin | 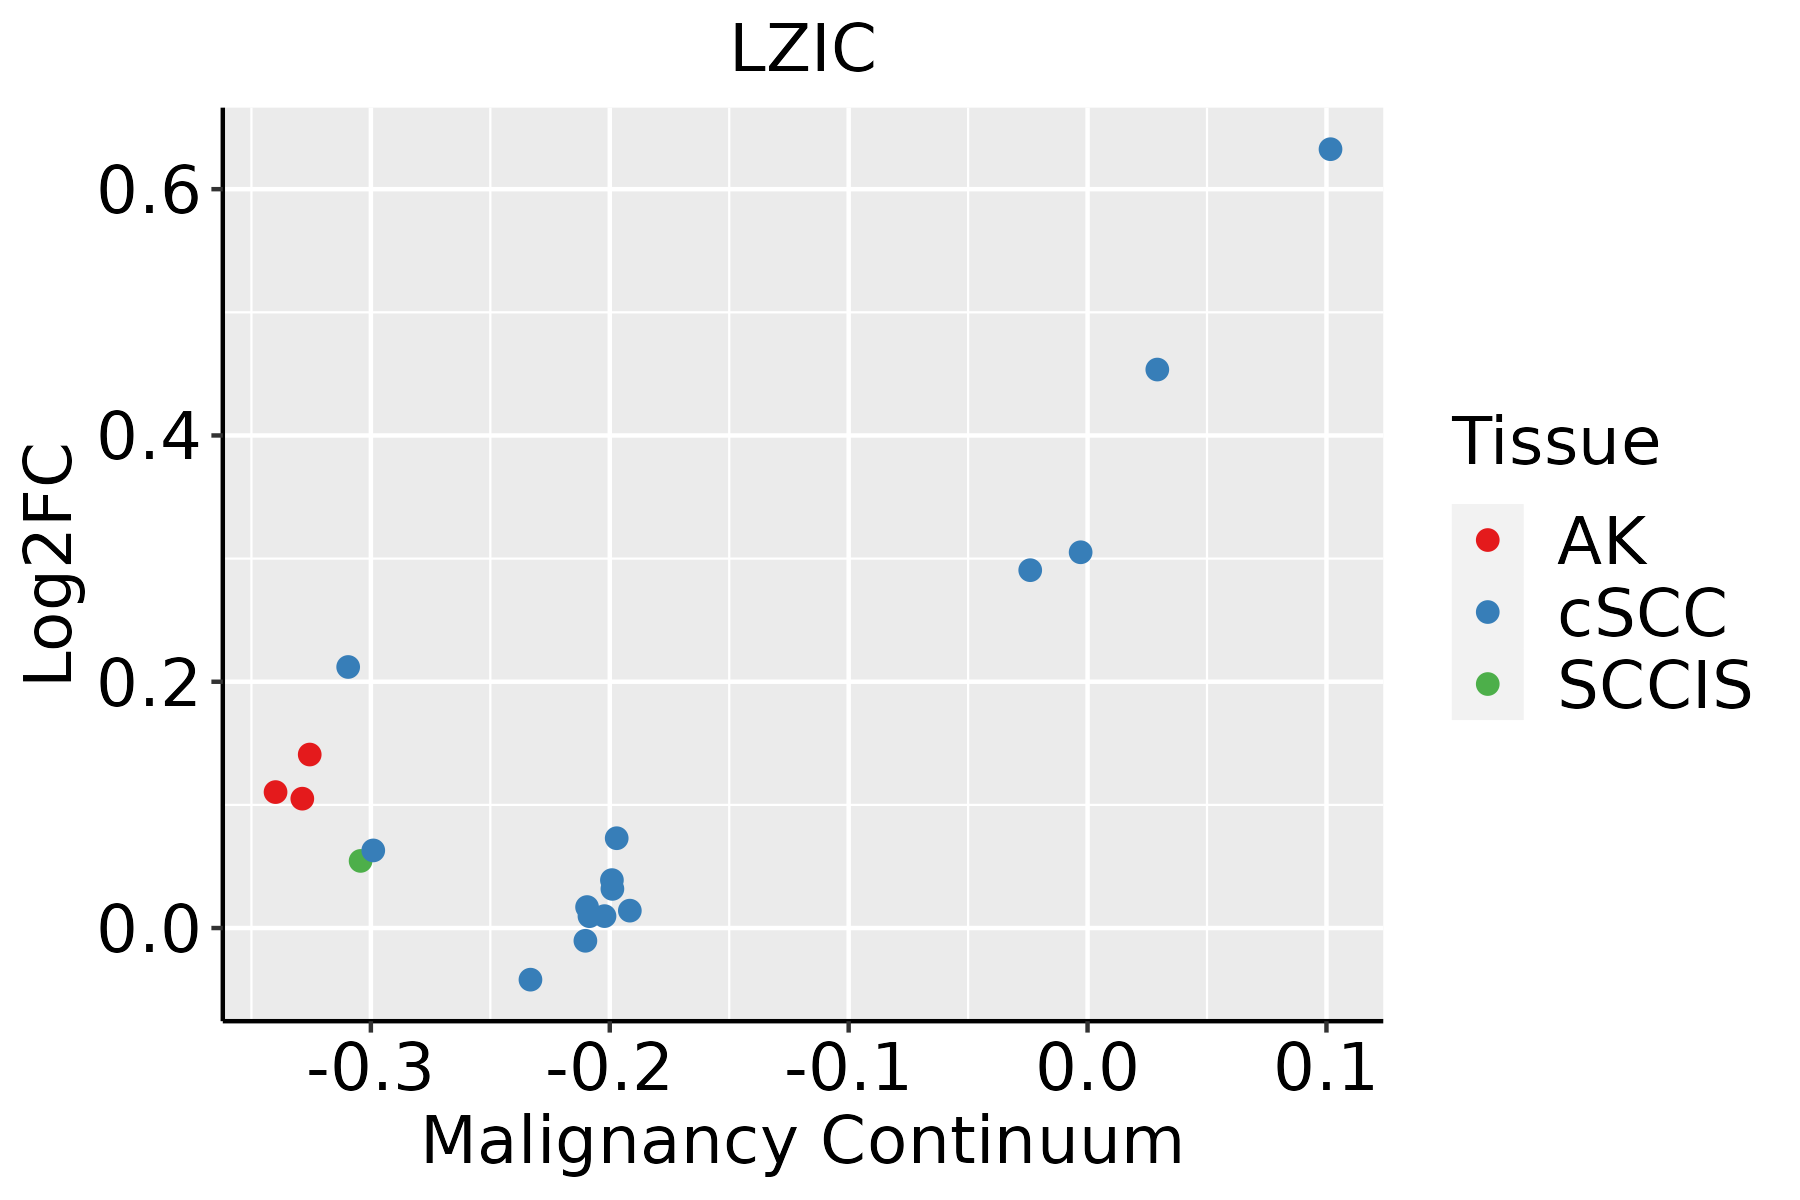 | AK: Actinic keratosis |
| cSCC: Cutaneous squamous cell carcinoma | ||
| SCCIS:squamous cell carcinoma in situ | ||
| Thyroid | 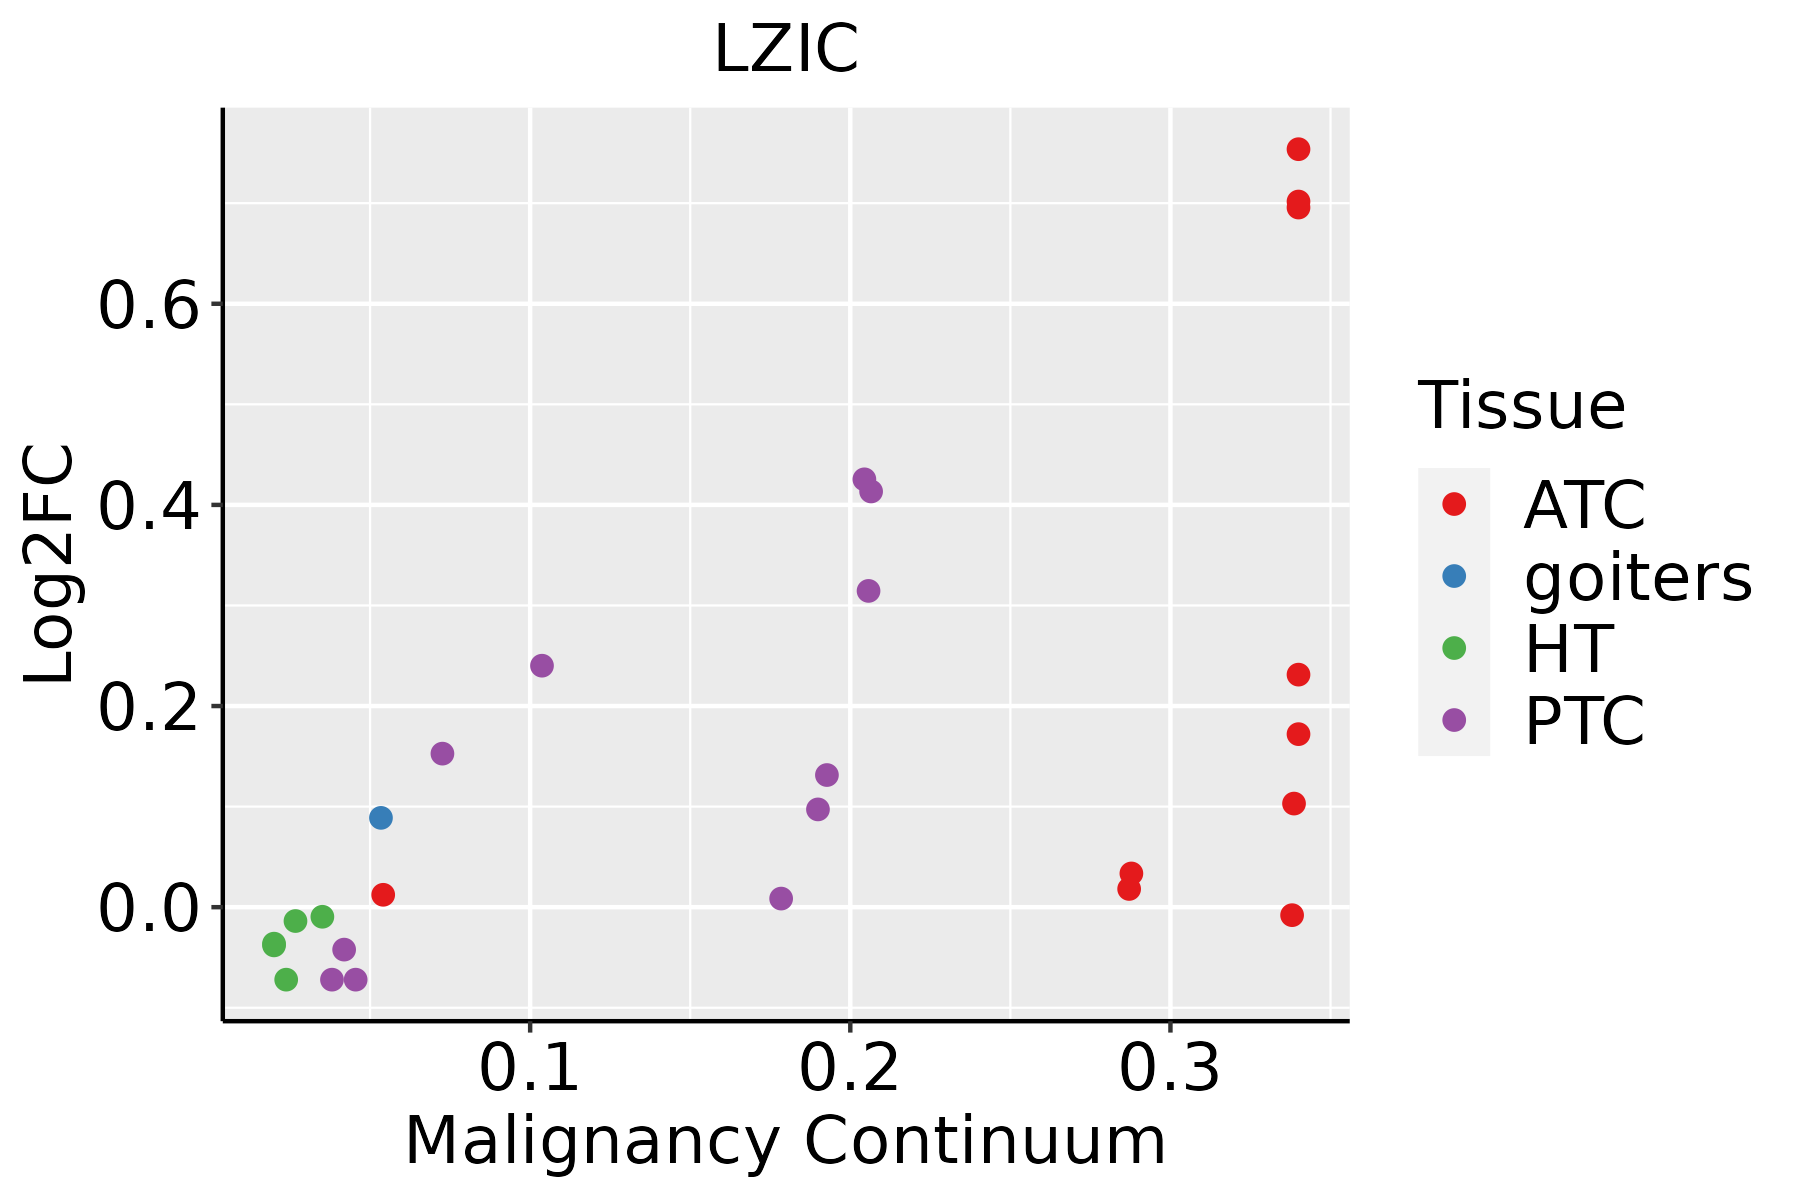 | ATC: Anaplastic thyroid cancer |
| HT: Hashimoto's thyroiditis | ||
| PTC: Papillary thyroid cancer |
| ∗log2FC in expression of this searched gene in stem-like cells from each diseased tissue sample relative to stem-like cells in normal samples in each tissue plotted against the malignancy continuum. Samples are colored based on if they are from different disease stage. |
Top |
Malignant transformation related pathway analysis |
| Find out the enriched GO biological processes and KEGG pathways involved in transition from healthy to precancer to cancer |
| Tissue | Disease Stage | Enriched GO biological Processes |
| Colorectum | AD |  |
| Colorectum | SER |  |
| Colorectum | MSS |  |
| Colorectum | MSI-H |  |
| Colorectum | FAP |  |
| ∗Top 15 enriched GO BP terms are showed in the bar plot of each disease state in each tissue. Each row represents a significant GO biological process which is colored according to the -log10(p.adjust). |
| Page: 1 2 3 4 5 6 7 8 9 |
| GO ID | Tissue | Disease Stage | Description | Gene Ratio | Bg Ratio | pvalue | p.adjust | Count |
| GO:001021217 | Esophagus | ESCC | response to ionizing radiation | 110/8552 | 148/18723 | 1.11e-12 | 4.78e-11 | 110 |
| GO:000931419 | Esophagus | ESCC | response to radiation | 277/8552 | 456/18723 | 4.42e-11 | 1.43e-09 | 277 |
| GO:001021221 | Liver | HCC | response to ionizing radiation | 89/7958 | 148/18723 | 1.10e-05 | 1.26e-04 | 89 |
| GO:00093146 | Liver | HCC | response to radiation | 223/7958 | 456/18723 | 3.08e-03 | 1.43e-02 | 223 |
| GO:00102128 | Oral cavity | OSCC | response to ionizing radiation | 99/7305 | 148/18723 | 5.49e-12 | 2.08e-10 | 99 |
| GO:000931416 | Oral cavity | OSCC | response to radiation | 241/7305 | 456/18723 | 9.76e-10 | 2.40e-08 | 241 |
| GO:001021216 | Oral cavity | LP | response to ionizing radiation | 64/4623 | 148/18723 | 5.60e-07 | 1.51e-05 | 64 |
| GO:000931417 | Oral cavity | LP | response to radiation | 155/4623 | 456/18723 | 4.12e-06 | 8.49e-05 | 155 |
| GO:000931424 | Skin | cSCC | response to radiation | 166/4864 | 456/18723 | 4.37e-07 | 8.41e-06 | 166 |
| GO:001021225 | Skin | cSCC | response to ionizing radiation | 64/4864 | 148/18723 | 3.64e-06 | 5.50e-05 | 64 |
| GO:001021219 | Thyroid | PTC | response to ionizing radiation | 79/5968 | 148/18723 | 4.56e-08 | 9.74e-07 | 79 |
| GO:0009314111 | Thyroid | PTC | response to radiation | 195/5968 | 456/18723 | 5.10e-07 | 8.27e-06 | 195 |
| GO:000931426 | Thyroid | ATC | response to radiation | 210/6293 | 456/18723 | 1.69e-08 | 3.39e-07 | 210 |
| GO:0010212110 | Thyroid | ATC | response to ionizing radiation | 82/6293 | 148/18723 | 3.88e-08 | 7.15e-07 | 82 |
| Page: 1 |
| Pathway ID | Tissue | Disease Stage | Description | Gene Ratio | Bg Ratio | pvalue | p.adjust | qvalue | Count |
| Page: 1 |
Top |
Cell-cell communication analysis |
| Identification of potential cell-cell interactions between two cell types and their ligand-receptor pairs for different disease states |
| Ligand | Receptor | LRpair | Pathway | Tissue | Disease Stage |
| Page: 1 |
Top |
Single-cell gene regulatory network inference analysis |
| Find out the significant the regulons (TFs) and the target genes of each regulon across cell types for different disease states |
| TF | Cell Type | Tissue | Disease Stage | Target Gene | RSS | Regulon Activity |
| ∗The dot plots of a searched regulon are shown for all cell subpopulations in each disease state of each tissue based on the regulon specific score inferred using pySCENIC and by calculating the average expression. |
| Page: 1 |
Top |
Somatic mutation of malignant transformation related genes |
| Annotation of somatic variants for genes involved in malignant transformation |
| Hugo Symbol | Variant Class | Variant Classification | dbSNP RS | HGVSc | HGVSp | HGVSp Short | SWISSPROT | BIOTYPE | SIFT | PolyPhen | Tumor Sample Barcode | Tissue | Histology | Sex | Age | Stage | Therapy Types | Drugs | Outcome |
| LZIC | SNV | Missense_Mutation | c.127N>A | p.Glu43Lys | p.E43K | Q8WZA0 | protein_coding | deleterious(0.01) | probably_damaging(0.914) | TCGA-BH-A0HP-01 | Breast | breast invasive carcinoma | Female | >=65 | III/IV | Chemotherapy | doxorubicin | SD | |
| LZIC | SNV | Missense_Mutation | c.87N>A | p.Asp29Glu | p.D29E | Q8WZA0 | protein_coding | deleterious(0) | probably_damaging(0.997) | TCGA-AG-3902-01 | Colorectum | rectum adenocarcinoma | Male | <65 | I/II | Unknown | Unknown | SD | |
| LZIC | deletion | Frame_Shift_Del | rs779313258 | c.570delN | p.Lys190AsnfsTer16 | p.K190Nfs*16 | Q8WZA0 | protein_coding | TCGA-5M-AAT6-01 | Colorectum | colon adenocarcinoma | Female | <65 | III/IV | Unknown | Unknown | PD | ||
| LZIC | deletion | Frame_Shift_Del | rs779313258 | c.570delN | p.Lys190AsnfsTer16 | p.K190Nfs*16 | Q8WZA0 | protein_coding | TCGA-AA-3672-01 | Colorectum | colon adenocarcinoma | Female | >=65 | III/IV | Unknown | Unknown | SD | ||
| LZIC | SNV | Missense_Mutation | novel | c.24G>T | p.Glu8Asp | p.E8D | Q8WZA0 | protein_coding | deleterious(0.01) | probably_damaging(0.991) | TCGA-A5-A1OF-01 | Endometrium | uterine corpus endometrioid carcinoma | Female | <65 | I/II | Unknown | Unknown | SD |
| LZIC | SNV | Missense_Mutation | rs765149898 | c.542C>T | p.Ala181Val | p.A181V | Q8WZA0 | protein_coding | tolerated(0.08) | benign(0.416) | TCGA-AJ-A3NE-01 | Endometrium | uterine corpus endometrioid carcinoma | Female | <65 | I/II | Unknown | Unknown | SD |
| LZIC | SNV | Missense_Mutation | c.93N>T | p.Glu31Asp | p.E31D | Q8WZA0 | protein_coding | deleterious(0) | probably_damaging(0.991) | TCGA-AP-A0LM-01 | Endometrium | uterine corpus endometrioid carcinoma | Female | <65 | III/IV | Chemotherapy | cisplatin | SD | |
| LZIC | SNV | Missense_Mutation | novel | c.65G>T | p.Arg22Ile | p.R22I | Q8WZA0 | protein_coding | deleterious(0) | probably_damaging(0.998) | TCGA-AX-A1CE-01 | Endometrium | uterine corpus endometrioid carcinoma | Female | <65 | I/II | Unspecific | Paclitaxel | SD |
| LZIC | SNV | Missense_Mutation | novel | c.443N>C | p.Asp148Ala | p.D148A | Q8WZA0 | protein_coding | tolerated(0.12) | benign(0) | TCGA-BK-A13B-01 | Endometrium | uterine corpus endometrioid carcinoma | Female | <65 | I/II | Unknown | Unknown | PD |
| LZIC | SNV | Missense_Mutation | c.511N>A | p.Leu171Ile | p.L171I | Q8WZA0 | protein_coding | tolerated(0.43) | benign(0.012) | TCGA-D1-A17H-01 | Endometrium | uterine corpus endometrioid carcinoma | Female | <65 | I/II | Unknown | Unknown | SD |
| Page: 1 2 |
Top |
Related drugs of malignant transformation related genes |
| Identification of chemicals and drugs interact with genes involved in malignant transfromation |
| (DGIdb 4.0) |
| Entrez ID | Symbol | Category | Interaction Types | Drug Claim Name | Drug Name | PMIDs |
| Page: 1 |

Copyright 2023-Present -The University of Texas Health Science Center at Houston |