
|
|||||
|
 | |
| |
| |
| |
| |
| |
|
Gene: LYZ |
Gene summary for LYZ |
| Gene information | Species | Human | Gene symbol | LYZ | Gene ID | 4069 |
| Gene name | lysozyme | |
| Gene Alias | LYZF1 | |
| Cytomap | 12q15 | |
| Gene Type | protein-coding | GO ID | GO:0001894 | UniProtAcc | B2R4C5 |
Top |
Malignant transformation analysis |
| Identification of the aberrant gene expression in precancerous and cancerous lesions by comparing the gene expression of stem-like cells in diseased tissues with normal stem cells |
| Entrez ID | Symbol | Replicates | Species | Organ | Tissue | Adj P-value | Log2FC | Malignancy |
| 4069 | LYZ | GSM4909287 | Human | Breast | IDC | 1.71e-04 | 4.14e-01 | 0.2057 |
| 4069 | LYZ | NCCBC14 | Human | Breast | DCIS | 4.94e-06 | 5.54e-01 | 0.2021 |
| 4069 | LYZ | NCCBC3 | Human | Breast | DCIS | 5.48e-25 | 6.75e-01 | 0.1198 |
| 4069 | LYZ | NCCBC5 | Human | Breast | DCIS | 2.31e-05 | 5.22e-01 | 0.2046 |
| 4069 | LYZ | CA_HPV_1 | Human | Cervix | CC | 1.29e-31 | 1.07e+00 | 0.0264 |
| 4069 | LYZ | N_HPV_2 | Human | Cervix | N_HPV | 1.47e-16 | 7.15e-01 | -0.0131 |
| 4069 | LYZ | CCI_1 | Human | Cervix | CC | 3.79e-02 | -6.43e-01 | 0.528 |
| 4069 | LYZ | CCII_1 | Human | Cervix | CC | 7.61e-06 | -6.43e-01 | 0.3249 |
| 4069 | LYZ | Tumor | Human | Cervix | CC | 3.11e-10 | -6.23e-01 | 0.1241 |
| 4069 | LYZ | sample1 | Human | Cervix | CC | 1.58e-04 | -6.43e-01 | 0.0959 |
| 4069 | LYZ | sample3 | Human | Cervix | CC | 5.06e-10 | -6.36e-01 | 0.1387 |
| 4069 | LYZ | H2 | Human | Cervix | HSIL_HPV | 1.30e-16 | -7.33e-02 | 0.0632 |
| 4069 | LYZ | L1 | Human | Cervix | CC | 6.35e-07 | 3.17e-01 | 0.0802 |
| 4069 | LYZ | T1 | Human | Cervix | CC | 1.93e-09 | -6.30e-01 | 0.0918 |
| 4069 | LYZ | T3 | Human | Cervix | CC | 8.18e-08 | -6.30e-01 | 0.1389 |
| 4069 | LYZ | HTA11_78_2000001011 | Human | Colorectum | AD | 8.99e-30 | 7.39e-01 | -0.1088 |
| 4069 | LYZ | HTA11_1391_2000001011 | Human | Colorectum | AD | 2.88e-08 | 2.51e-01 | -0.059 |
| 4069 | LYZ | HTA11_4255_2000001011 | Human | Colorectum | SER | 2.53e-02 | 2.40e-01 | 0.0446 |
| 4069 | LYZ | HTA11_99999965104_69814 | Human | Colorectum | MSS | 7.40e-09 | 2.87e-01 | 0.281 |
| 4069 | LYZ | A002-C-010 | Human | Colorectum | FAP | 1.77e-02 | 2.98e-01 | 0.242 |
| Page: 1 2 3 4 5 6 7 |
| Tissue | Expression Dynamics | Abbreviation |
| Breast | 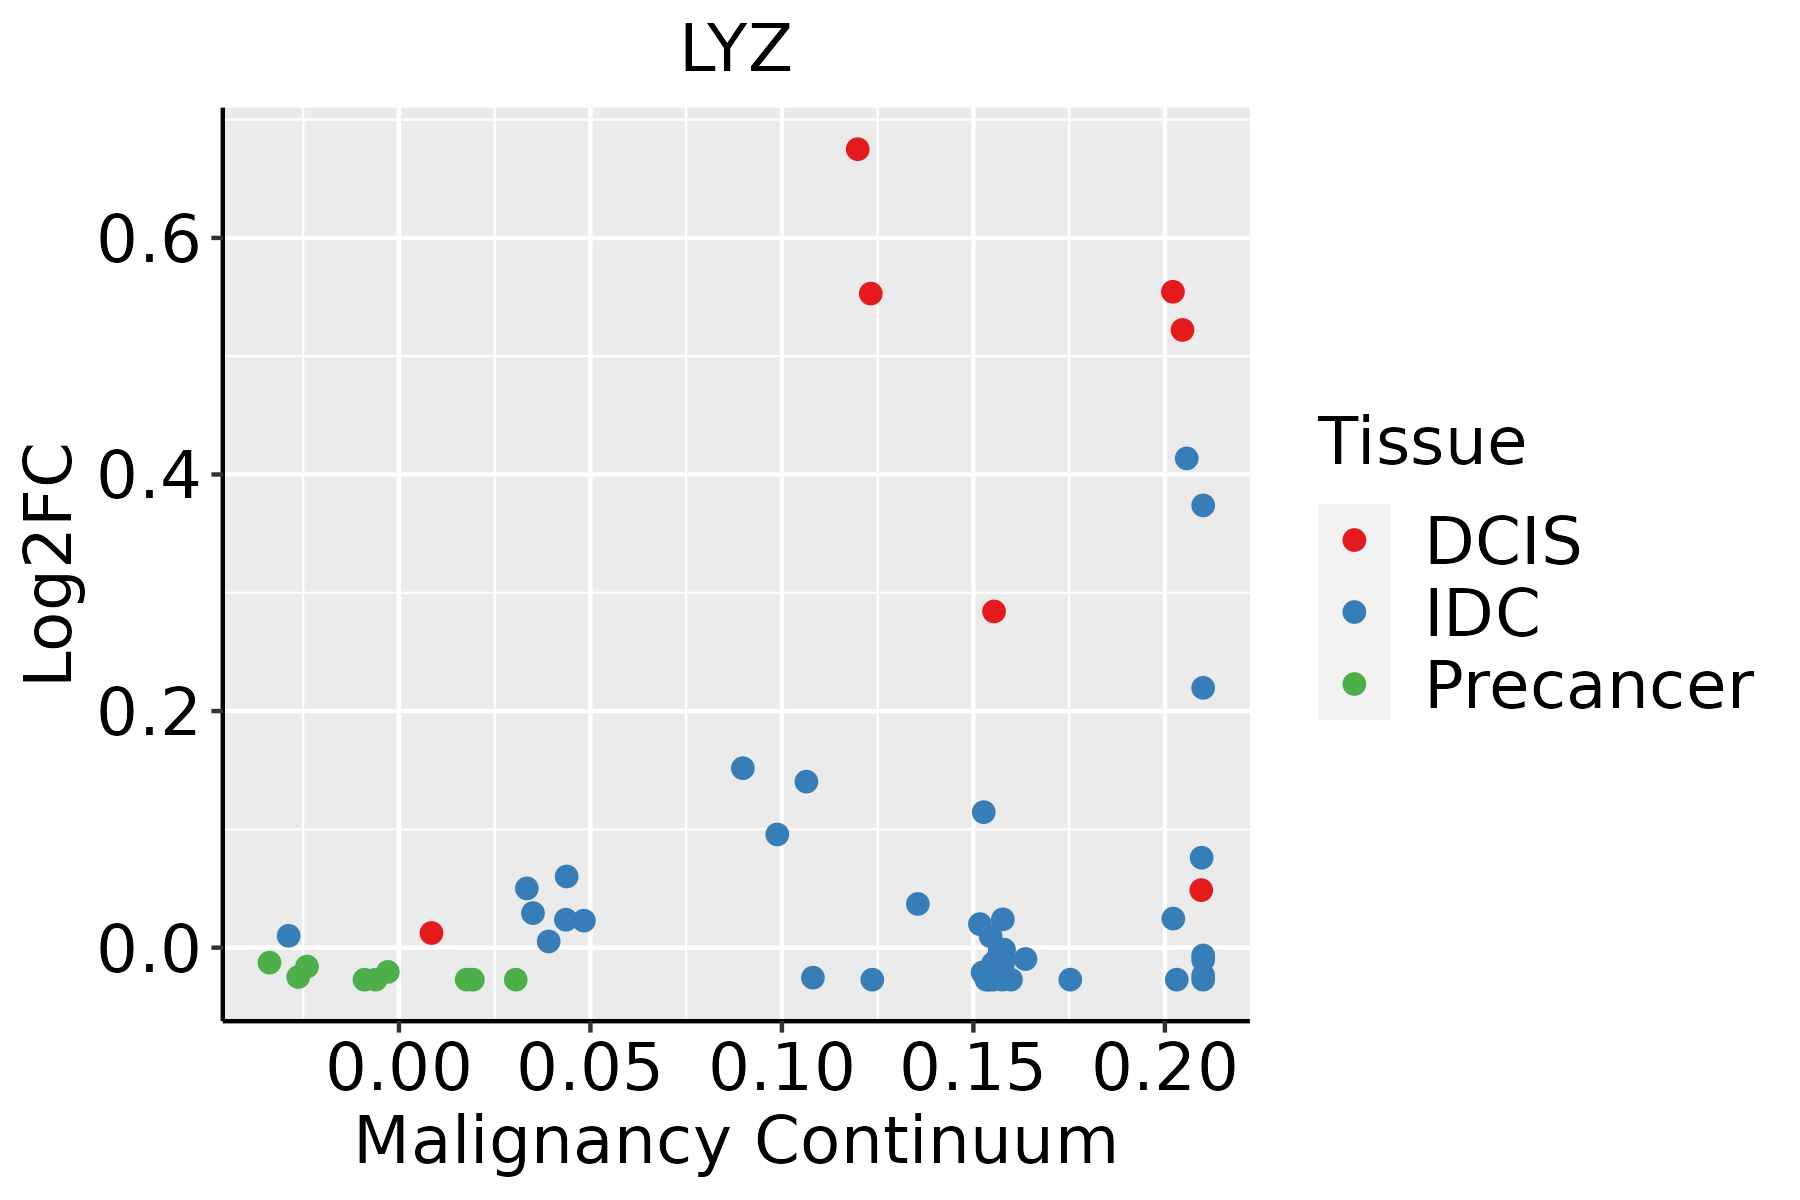 | IDC: Invasive ductal carcinoma |
| DCIS: Ductal carcinoma in situ | ||
| Precancer(BRCA1-mut): Precancerous lesion from BRCA1 mutation carriers | ||
| Cervix | 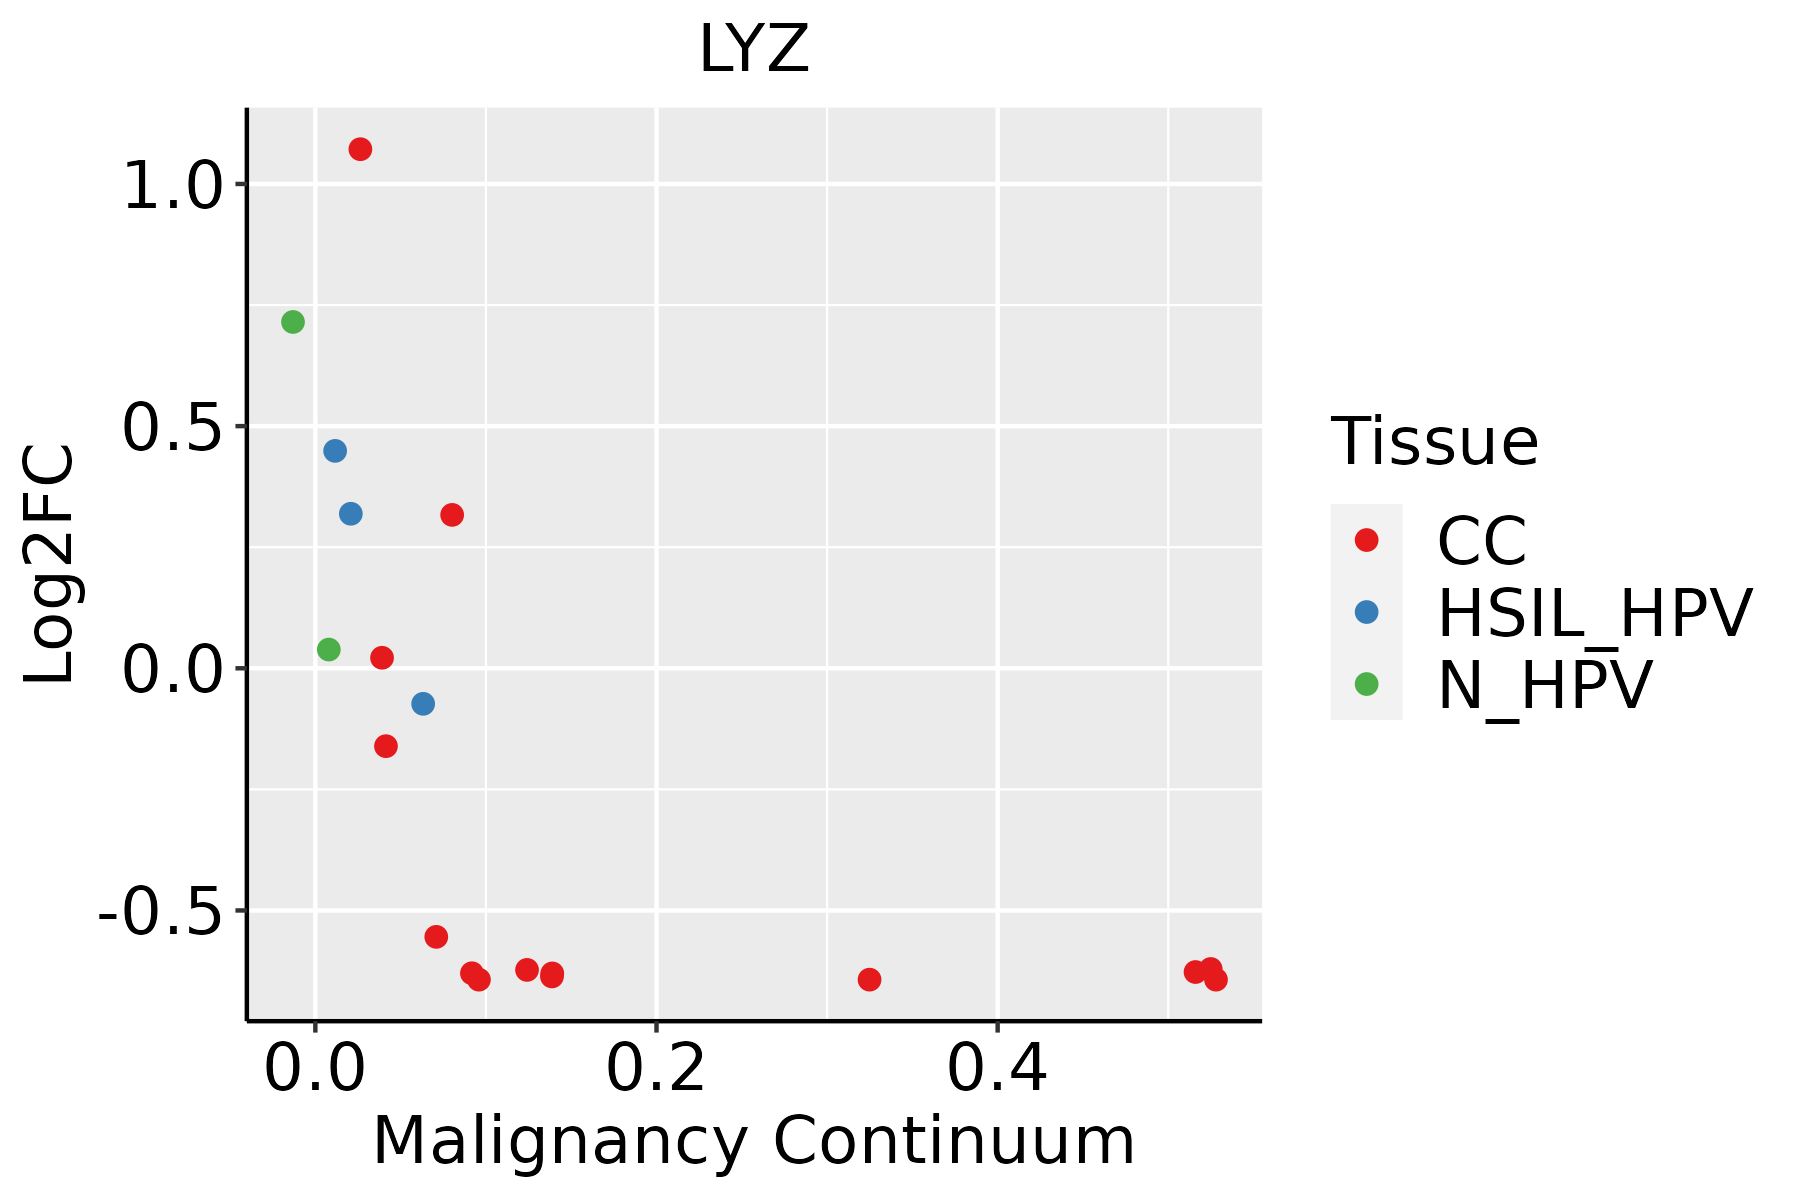 | CC: Cervix cancer |
| HSIL_HPV: HPV-infected high-grade squamous intraepithelial lesions | ||
| N_HPV: HPV-infected normal cervix | ||
| Colorectum (GSE201348) |  | FAP: Familial adenomatous polyposis |
| CRC: Colorectal cancer | ||
| Colorectum (HTA11) |  | AD: Adenomas |
| SER: Sessile serrated lesions | ||
| MSI-H: Microsatellite-high colorectal cancer | ||
| MSS: Microsatellite stable colorectal cancer | ||
| Esophagus | 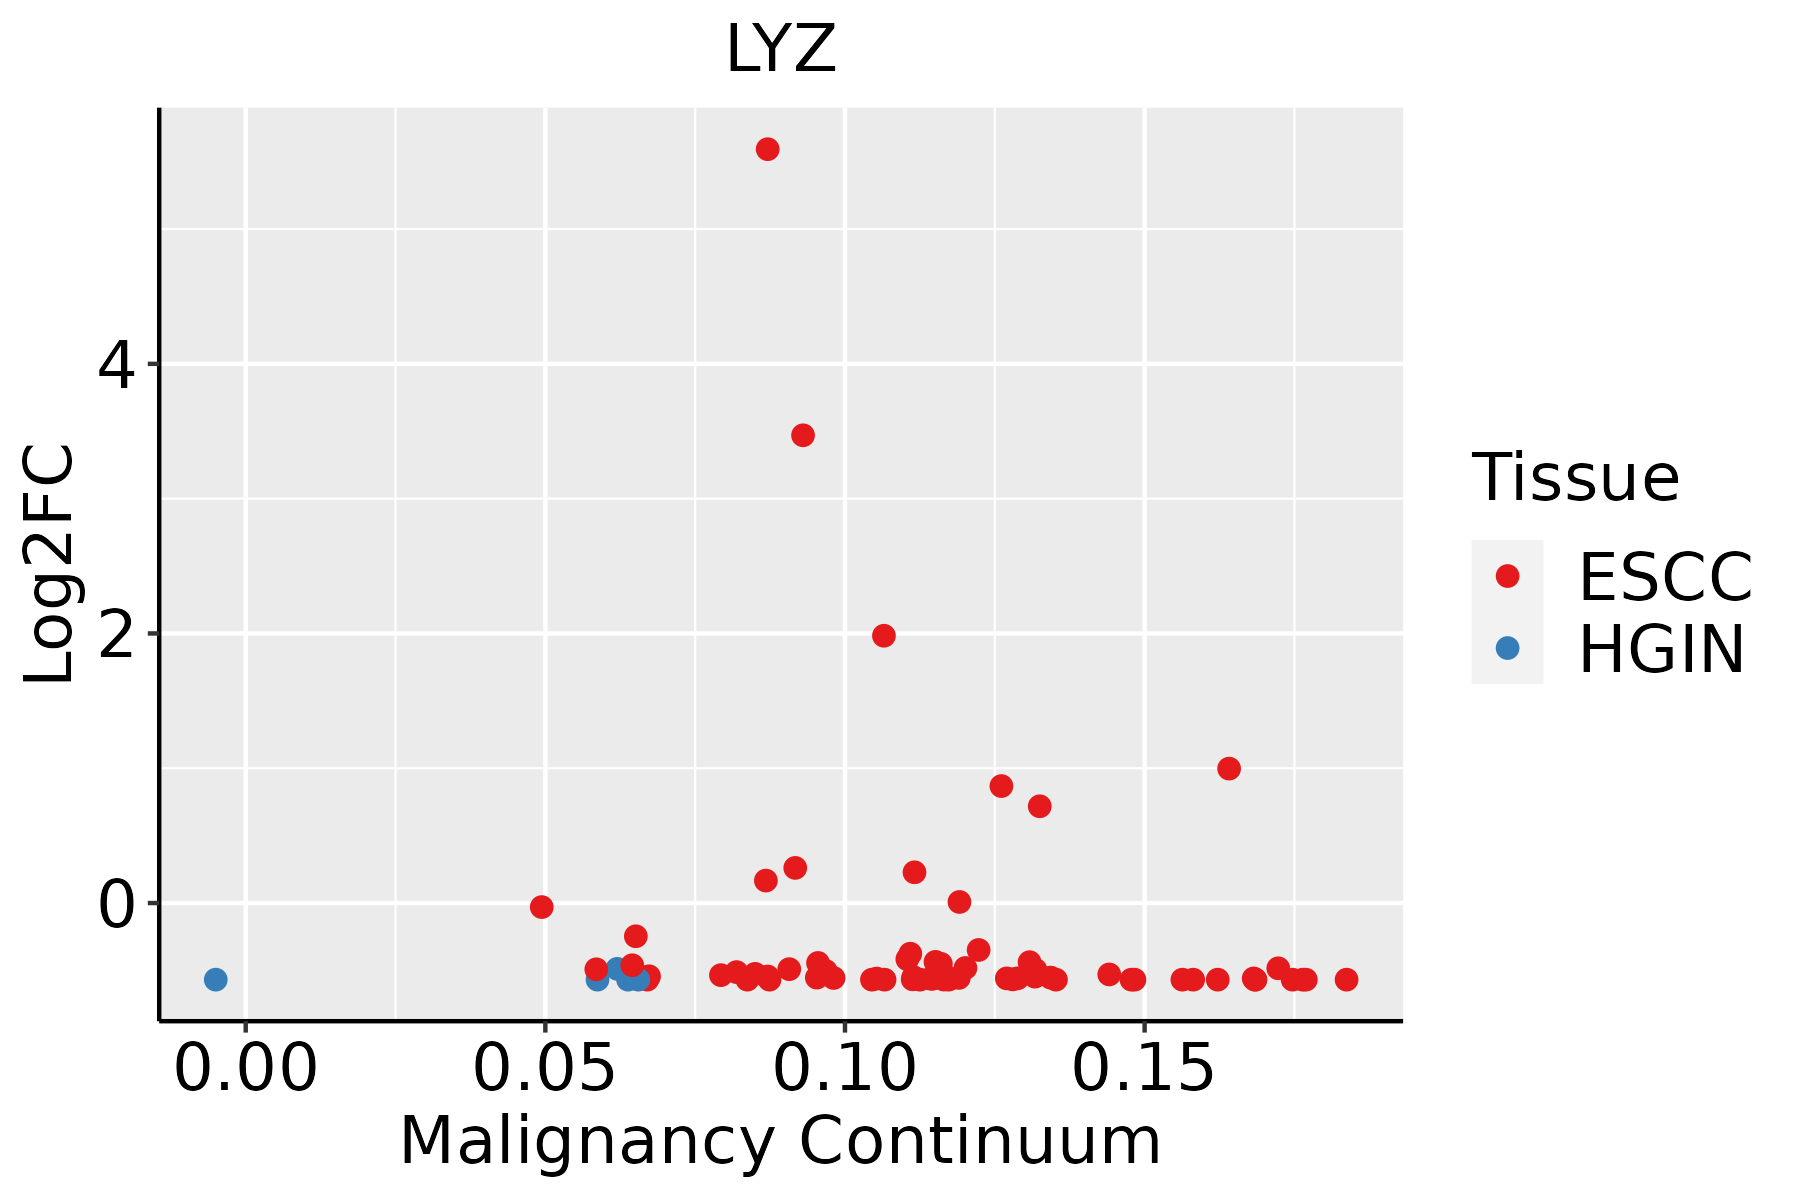 | ESCC: Esophageal squamous cell carcinoma |
| HGIN: High-grade intraepithelial neoplasias | ||
| LGIN: Low-grade intraepithelial neoplasias | ||
| GC | 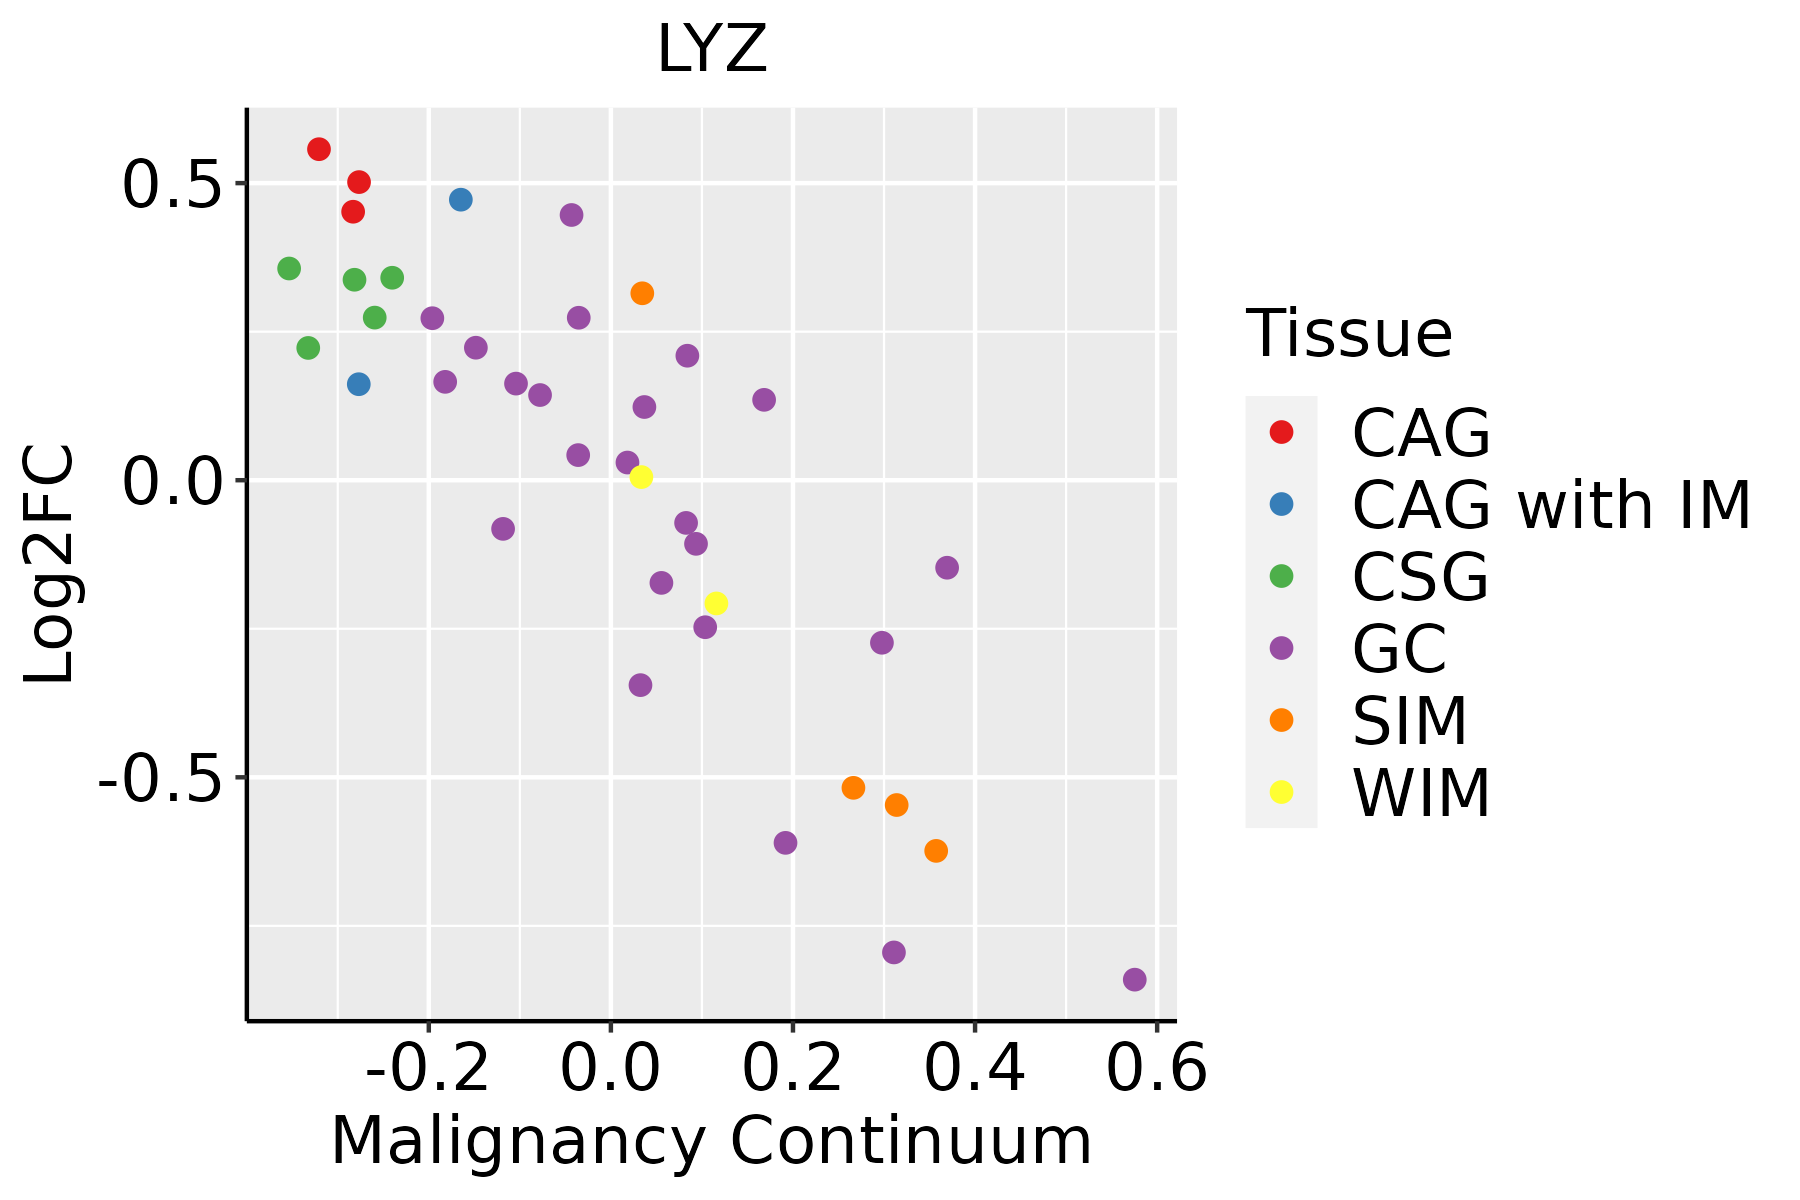 | CAG: Chronic atrophic gastritis |
| CAG with IM: Chronic atrophic gastritis with intestinal metaplasia | ||
| CSG: Chronic superficial gastritis | ||
| GC: Gastric cancer | ||
| SIM: Severe intestinal metaplasia | ||
| WIM: Wild intestinal metaplasia | ||
| Liver |  | HCC: Hepatocellular carcinoma |
| NAFLD: Non-alcoholic fatty liver disease | ||
| Oral Cavity | 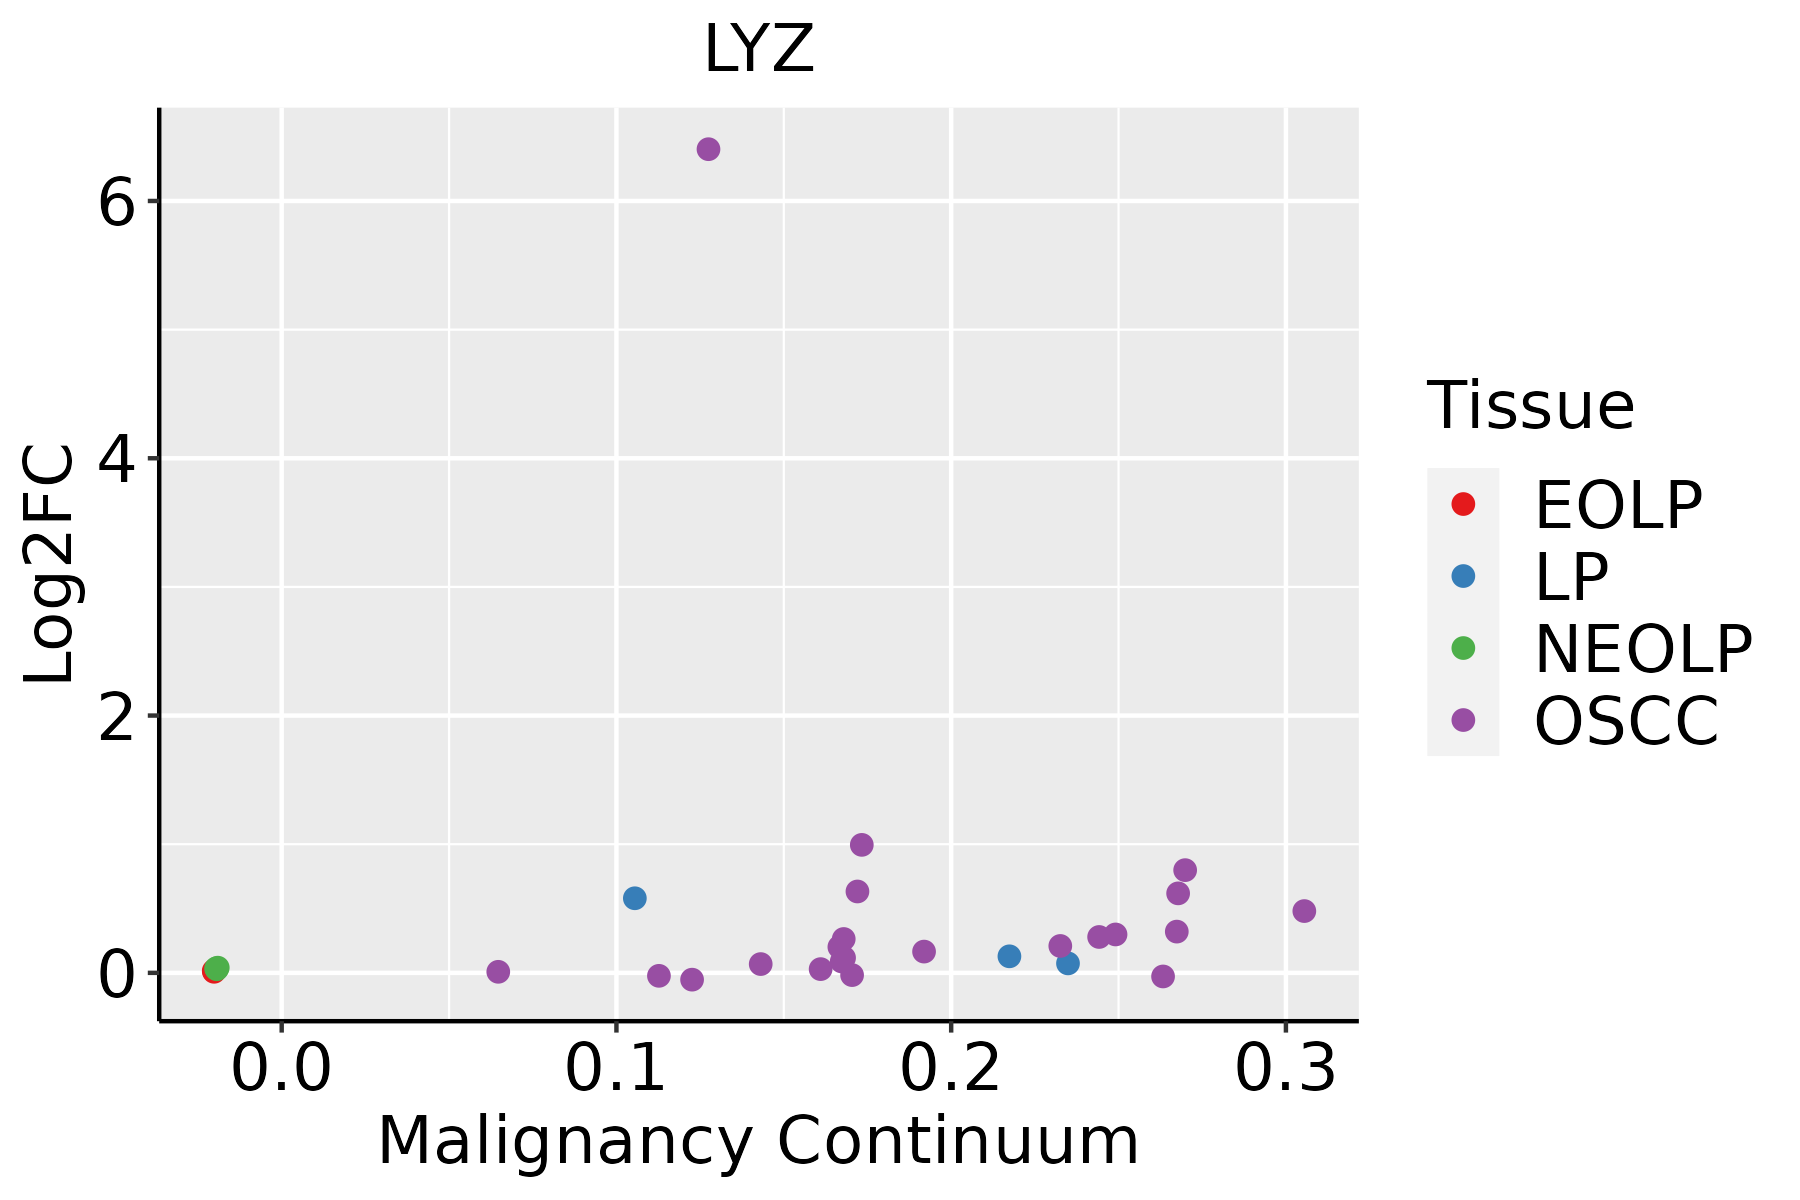 | EOLP: Erosive Oral lichen planus |
| LP: leukoplakia | ||
| NEOLP: Non-erosive oral lichen planus | ||
| OSCC: Oral squamous cell carcinoma | ||
| Prostate | 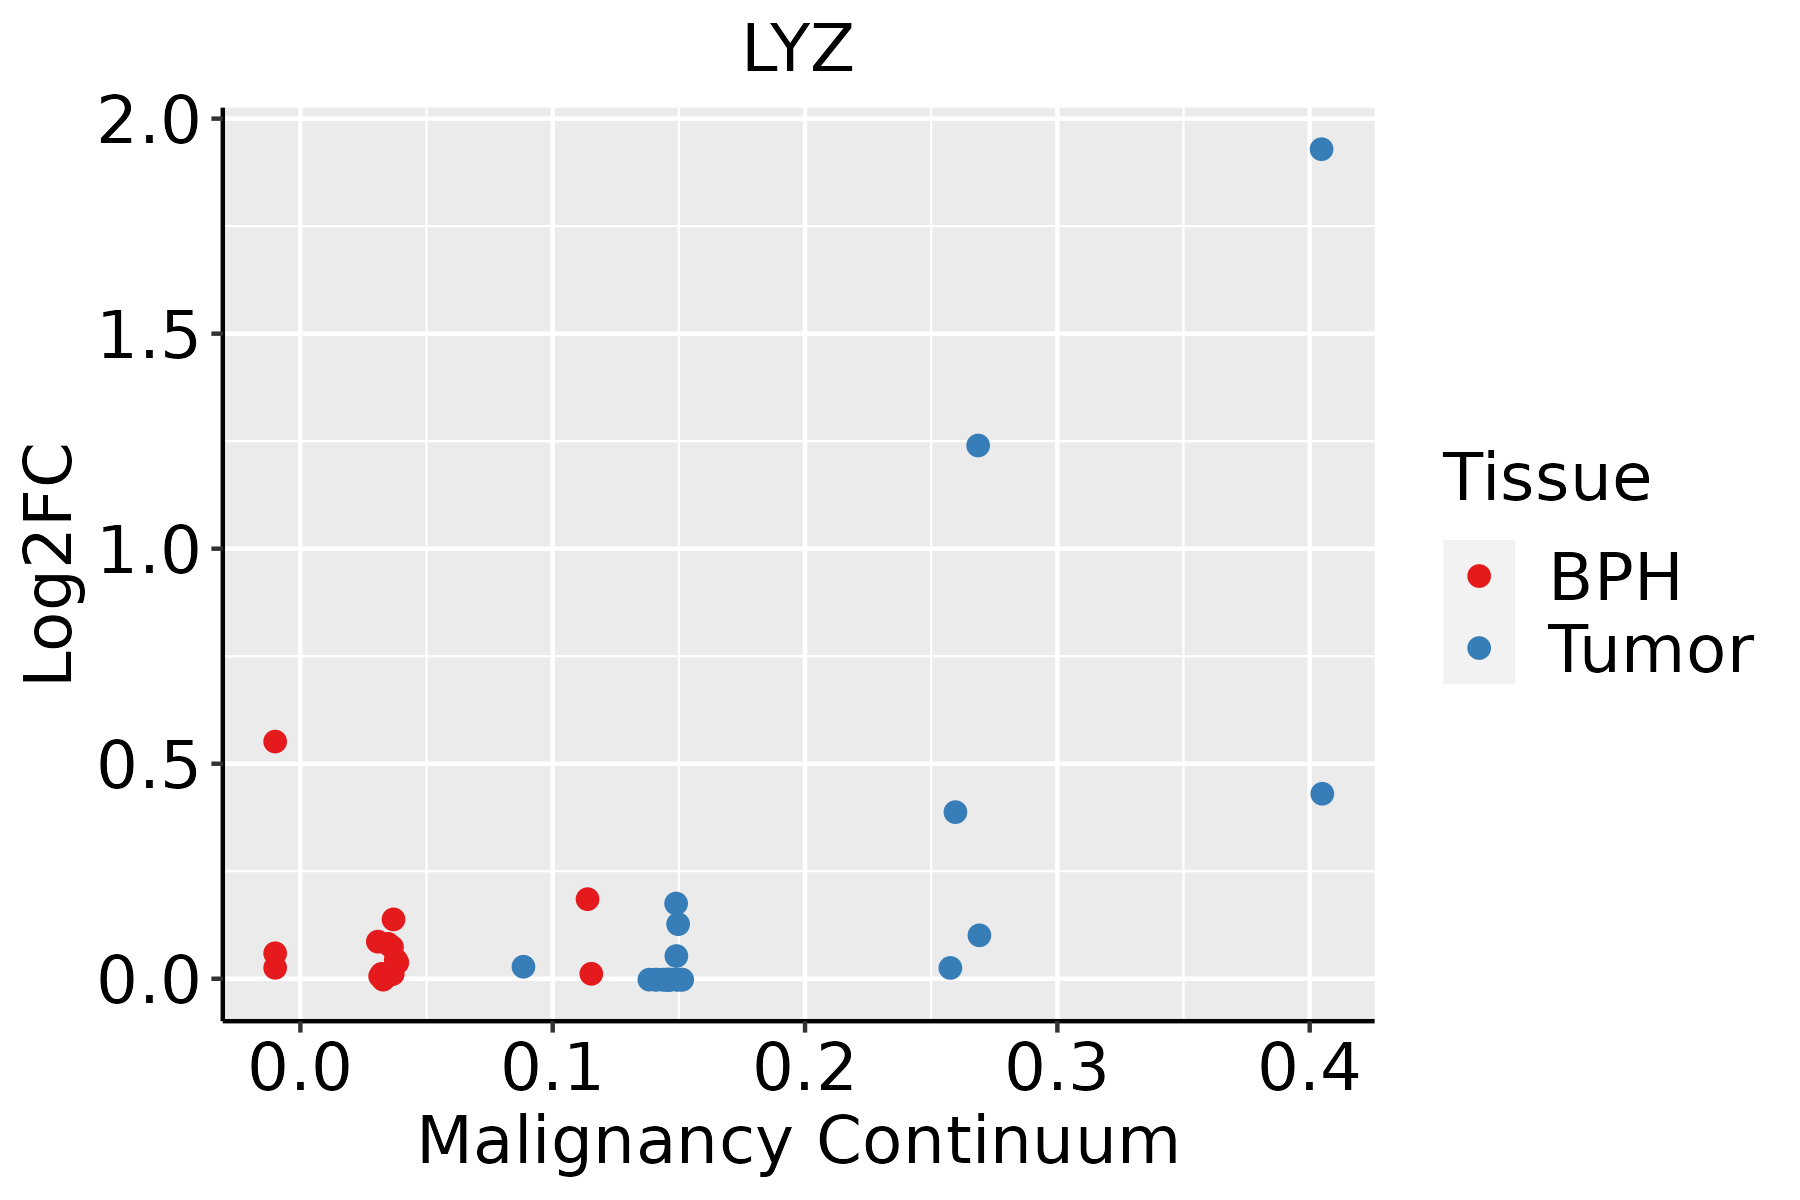 | BPH: Benign Prostatic Hyperplasia |
| Skin | 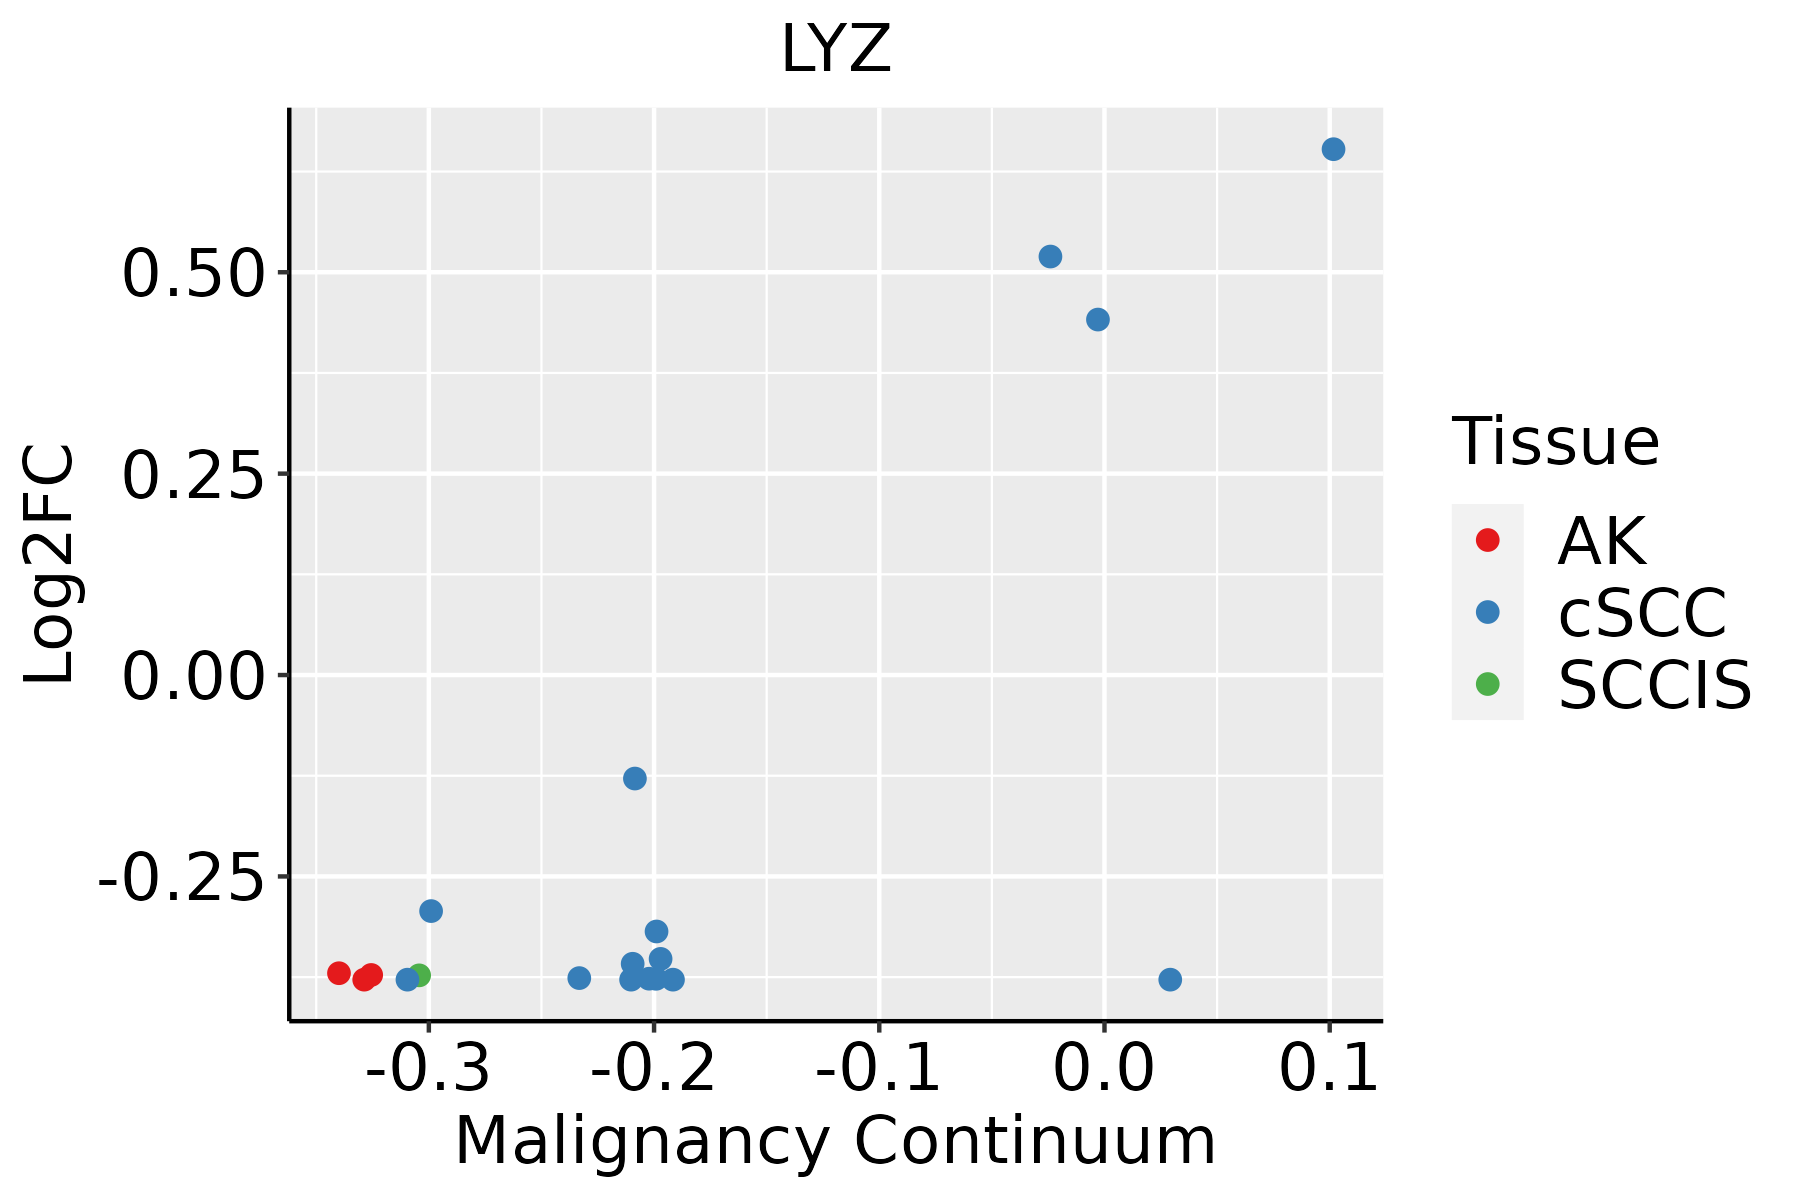 | AK: Actinic keratosis |
| cSCC: Cutaneous squamous cell carcinoma | ||
| SCCIS:squamous cell carcinoma in situ |
| ∗log2FC in expression of this searched gene in stem-like cells from each diseased tissue sample relative to stem-like cells in normal samples in each tissue plotted against the malignancy continuum. Samples are colored based on if they are from different disease stage. |
Top |
Malignant transformation related pathway analysis |
| Find out the enriched GO biological processes and KEGG pathways involved in transition from healthy to precancer to cancer |
| Tissue | Disease Stage | Enriched GO biological Processes |
| Colorectum | AD |  |
| Colorectum | SER |  |
| Colorectum | MSS |  |
| Colorectum | MSI-H |  |
| Colorectum | FAP |  |
| ∗Top 15 enriched GO BP terms are showed in the bar plot of each disease state in each tissue. Each row represents a significant GO biological process which is colored according to the -log10(p.adjust). |
| Page: 1 2 3 4 5 6 7 8 9 |
| GO ID | Tissue | Disease Stage | Description | Gene Ratio | Bg Ratio | pvalue | p.adjust | Count |
| GO:001973011 | Breast | IDC | antimicrobial humoral response | 23/1434 | 122/18723 | 4.67e-05 | 1.04e-03 | 23 |
| GO:000189511 | Breast | IDC | retina homeostasis | 15/1434 | 79/18723 | 8.62e-04 | 1.00e-02 | 15 |
| GO:00069596 | Breast | IDC | humoral immune response | 40/1434 | 317/18723 | 1.25e-03 | 1.33e-02 | 40 |
| GO:000189413 | Breast | IDC | tissue homeostasis | 34/1434 | 268/18723 | 2.54e-03 | 2.28e-02 | 34 |
| GO:001973021 | Breast | DCIS | antimicrobial humoral response | 21/1390 | 122/18723 | 2.40e-04 | 3.75e-03 | 21 |
| GO:000189521 | Breast | DCIS | retina homeostasis | 14/1390 | 79/18723 | 1.88e-03 | 1.81e-02 | 14 |
| GO:000189423 | Breast | DCIS | tissue homeostasis | 33/1390 | 268/18723 | 2.88e-03 | 2.48e-02 | 33 |
| GO:000695911 | Breast | DCIS | humoral immune response | 37/1390 | 317/18723 | 4.16e-03 | 3.29e-02 | 37 |
| GO:00018949 | Cervix | CC | tissue homeostasis | 57/2311 | 268/18723 | 2.43e-05 | 4.21e-04 | 57 |
| GO:00602498 | Cervix | CC | anatomical structure homeostasis | 63/2311 | 314/18723 | 6.03e-05 | 8.68e-04 | 63 |
| GO:00197308 | Cervix | CC | antimicrobial humoral response | 27/2311 | 122/18723 | 1.70e-03 | 1.29e-02 | 27 |
| GO:00019067 | Cervix | CC | cell killing | 37/2311 | 188/18723 | 2.61e-03 | 1.80e-02 | 37 |
| GO:00018957 | Cervix | CC | retina homeostasis | 19/2311 | 79/18723 | 2.94e-03 | 1.94e-02 | 19 |
| GO:00069597 | Cervix | CC | humoral immune response | 54/2311 | 317/18723 | 8.57e-03 | 4.42e-02 | 54 |
| GO:000695912 | Cervix | HSIL_HPV | humoral immune response | 39/737 | 317/18723 | 2.88e-10 | 7.02e-08 | 39 |
| GO:001973012 | Cervix | HSIL_HPV | antimicrobial humoral response | 18/737 | 122/18723 | 1.35e-06 | 6.21e-05 | 18 |
| GO:000190611 | Cervix | HSIL_HPV | cell killing | 23/737 | 188/18723 | 1.45e-06 | 6.47e-05 | 23 |
| GO:000189512 | Cervix | HSIL_HPV | retina homeostasis | 12/737 | 79/18723 | 5.76e-05 | 1.39e-03 | 12 |
| GO:00427423 | Cervix | HSIL_HPV | defense response to bacterium | 30/737 | 350/18723 | 5.82e-05 | 1.40e-03 | 30 |
| GO:000189414 | Cervix | HSIL_HPV | tissue homeostasis | 25/737 | 268/18723 | 6.17e-05 | 1.46e-03 | 25 |
| Page: 1 2 3 4 |
| Pathway ID | Tissue | Disease Stage | Description | Gene Ratio | Bg Ratio | pvalue | p.adjust | qvalue | Count |
| hsa049704 | Breast | IDC | Salivary secretion | 18/867 | 93/8465 | 5.69e-03 | 3.13e-02 | 2.34e-02 | 18 |
| hsa0497011 | Breast | IDC | Salivary secretion | 18/867 | 93/8465 | 5.69e-03 | 3.13e-02 | 2.34e-02 | 18 |
| hsa04970 | Colorectum | FAP | Salivary secretion | 24/1404 | 93/8465 | 1.52e-02 | 4.99e-02 | 3.03e-02 | 24 |
| hsa049701 | Colorectum | FAP | Salivary secretion | 24/1404 | 93/8465 | 1.52e-02 | 4.99e-02 | 3.03e-02 | 24 |
| hsa049702 | Colorectum | CRC | Salivary secretion | 22/1091 | 93/8465 | 3.03e-03 | 1.91e-02 | 1.29e-02 | 22 |
| hsa049703 | Colorectum | CRC | Salivary secretion | 22/1091 | 93/8465 | 3.03e-03 | 1.91e-02 | 1.29e-02 | 22 |
| Page: 1 |
Top |
Cell-cell communication analysis |
| Identification of potential cell-cell interactions between two cell types and their ligand-receptor pairs for different disease states |
| Ligand | Receptor | LRpair | Pathway | Tissue | Disease Stage |
| Page: 1 |
Top |
Single-cell gene regulatory network inference analysis |
| Find out the significant the regulons (TFs) and the target genes of each regulon across cell types for different disease states |
| TF | Cell Type | Tissue | Disease Stage | Target Gene | RSS | Regulon Activity |
| ∗The dot plots of a searched regulon are shown for all cell subpopulations in each disease state of each tissue based on the regulon specific score inferred using pySCENIC and by calculating the average expression. |
| Page: 1 |
Top |
Somatic mutation of malignant transformation related genes |
| Annotation of somatic variants for genes involved in malignant transformation |
| Hugo Symbol | Variant Class | Variant Classification | dbSNP RS | HGVSc | HGVSp | HGVSp Short | SWISSPROT | BIOTYPE | SIFT | PolyPhen | Tumor Sample Barcode | Tissue | Histology | Sex | Age | Stage | Therapy Types | Drugs | Outcome |
| LYZ | deletion | Frame_Shift_Del | novel | c.136delN | p.Trp46GlyfsTer66 | p.W46Gfs*66 | P61626 | protein_coding | TCGA-EW-A2FV-01 | Breast | breast invasive carcinoma | Female | <65 | III/IV | Chemotherapy | docetaxel | SD | ||
| LYZ | SNV | Missense_Mutation | novel | c.392N>T | p.Arg131Ile | p.R131I | P61626 | protein_coding | deleterious(0.03) | benign(0.052) | TCGA-CA-6717-01 | Colorectum | colon adenocarcinoma | Male | <65 | I/II | Chemotherapy | oxaliplatin | CR |
| LYZ | SNV | Missense_Mutation | novel | c.283N>C | p.Cys95Arg | p.C95R | P61626 | protein_coding | deleterious(0) | probably_damaging(1) | TCGA-AP-A1DK-01 | Endometrium | uterine corpus endometrioid carcinoma | Female | <65 | I/II | Unknown | Unknown | SD |
| LYZ | SNV | Missense_Mutation | novel | c.412G>T | p.Asp138Tyr | p.D138Y | P61626 | protein_coding | deleterious(0.01) | probably_damaging(0.997) | TCGA-AP-A1DV-01 | Endometrium | uterine corpus endometrioid carcinoma | Female | <65 | I/II | Unknown | Unknown | SD |
| LYZ | SNV | Missense_Mutation | novel | c.206N>T | p.Ser69Ile | p.S69I | P61626 | protein_coding | deleterious(0) | probably_damaging(0.998) | TCGA-AX-A05Z-01 | Endometrium | uterine corpus endometrioid carcinoma | Female | <65 | III/IV | Chemotherapy | adriamycin | SD |
| LYZ | SNV | Missense_Mutation | novel | c.397N>T | p.Arg133Cys | p.R133C | P61626 | protein_coding | deleterious(0) | possibly_damaging(0.754) | TCGA-AX-A05Z-01 | Endometrium | uterine corpus endometrioid carcinoma | Female | <65 | III/IV | Chemotherapy | adriamycin | SD |
| LYZ | SNV | Missense_Mutation | novel | c.397C>T | p.Arg133Cys | p.R133C | P61626 | protein_coding | deleterious(0) | possibly_damaging(0.754) | TCGA-BS-A0UV-01 | Endometrium | uterine corpus endometrioid carcinoma | Female | <65 | III/IV | Unknown | Unknown | SD |
| LYZ | SNV | Missense_Mutation | novel | c.299N>A | p.Ser100Asn | p.S100N | P61626 | protein_coding | tolerated(0.2) | benign(0.006) | TCGA-EY-A1GU-01 | Endometrium | uterine corpus endometrioid carcinoma | Female | >=65 | I/II | Unknown | Unknown | SD |
| LYZ | SNV | Missense_Mutation | c.389G>T | p.Trp130Leu | p.W130L | P61626 | protein_coding | deleterious(0) | probably_damaging(1) | TCGA-FI-A2D5-01 | Endometrium | uterine corpus endometrioid carcinoma | Female | <65 | III/IV | Chemotherapy | carboplatinum | PD | |
| LYZ | SNV | Missense_Mutation | novel | c.47N>A | p.Val16Asp | p.V16D | P61626 | protein_coding | deleterious(0.02) | benign(0.104) | TCGA-22-0940-01 | Lung | lung squamous cell carcinoma | Male | >=65 | I/II | Unknown | Unknown | PD |
| Page: 1 2 |
Top |
Related drugs of malignant transformation related genes |
| Identification of chemicals and drugs interact with genes involved in malignant transfromation |
| (DGIdb 4.0) |
| Entrez ID | Symbol | Category | Interaction Types | Drug Claim Name | Drug Name | PMIDs |
| Page: 1 |

Copyright 2023-Present -The University of Texas Health Science Center at Houston |