
|
|||||
|
 | |
| |
| |
| |
| |
| |
|
Gene: LYSMD3 |
Gene summary for LYSMD3 |
| Gene information | Species | Human | Gene symbol | LYSMD3 | Gene ID | 116068 |
| Gene name | LysM domain containing 3 | |
| Gene Alias | LYSMD3 | |
| Cytomap | 5q14.3 | |
| Gene Type | protein-coding | GO ID | GO:0006996 | UniProtAcc | Q7Z3D4 |
Top |
Malignant transformation analysis |
| Identification of the aberrant gene expression in precancerous and cancerous lesions by comparing the gene expression of stem-like cells in diseased tissues with normal stem cells |
| Entrez ID | Symbol | Replicates | Species | Organ | Tissue | Adj P-value | Log2FC | Malignancy |
| 116068 | LYSMD3 | PTCwithHT_6 | Human | Thyroid | HT | 1.09e-02 | -2.11e-01 | 0.02 |
| 116068 | LYSMD3 | PTCwithoutHT_2 | Human | Thyroid | PTC | 2.56e-04 | -2.33e-01 | 0.0419 |
| 116068 | LYSMD3 | male-WTA | Human | Thyroid | PTC | 4.01e-14 | -5.06e-02 | 0.1037 |
| 116068 | LYSMD3 | PTC01 | Human | Thyroid | PTC | 3.70e-08 | -1.43e-01 | 0.1899 |
| 116068 | LYSMD3 | PTC04 | Human | Thyroid | PTC | 9.10e-07 | -2.74e-02 | 0.1927 |
| 116068 | LYSMD3 | PTC05 | Human | Thyroid | PTC | 5.41e-09 | 5.65e-02 | 0.2065 |
| 116068 | LYSMD3 | PTC06 | Human | Thyroid | PTC | 1.90e-08 | 1.41e-01 | 0.2057 |
| 116068 | LYSMD3 | PTC07 | Human | Thyroid | PTC | 6.95e-22 | 1.96e-01 | 0.2044 |
| 116068 | LYSMD3 | ATC12 | Human | Thyroid | ATC | 5.57e-10 | -1.12e-01 | 0.34 |
| 116068 | LYSMD3 | ATC13 | Human | Thyroid | ATC | 3.65e-24 | 1.29e-01 | 0.34 |
| 116068 | LYSMD3 | ATC2 | Human | Thyroid | ATC | 1.35e-12 | 1.10e+00 | 0.34 |
| 116068 | LYSMD3 | ATC4 | Human | Thyroid | ATC | 3.01e-07 | -5.41e-02 | 0.34 |
| 116068 | LYSMD3 | ATC5 | Human | Thyroid | ATC | 3.15e-13 | 1.61e-01 | 0.34 |
| Page: 1 |
| Tissue | Expression Dynamics | Abbreviation |
| Thyroid | 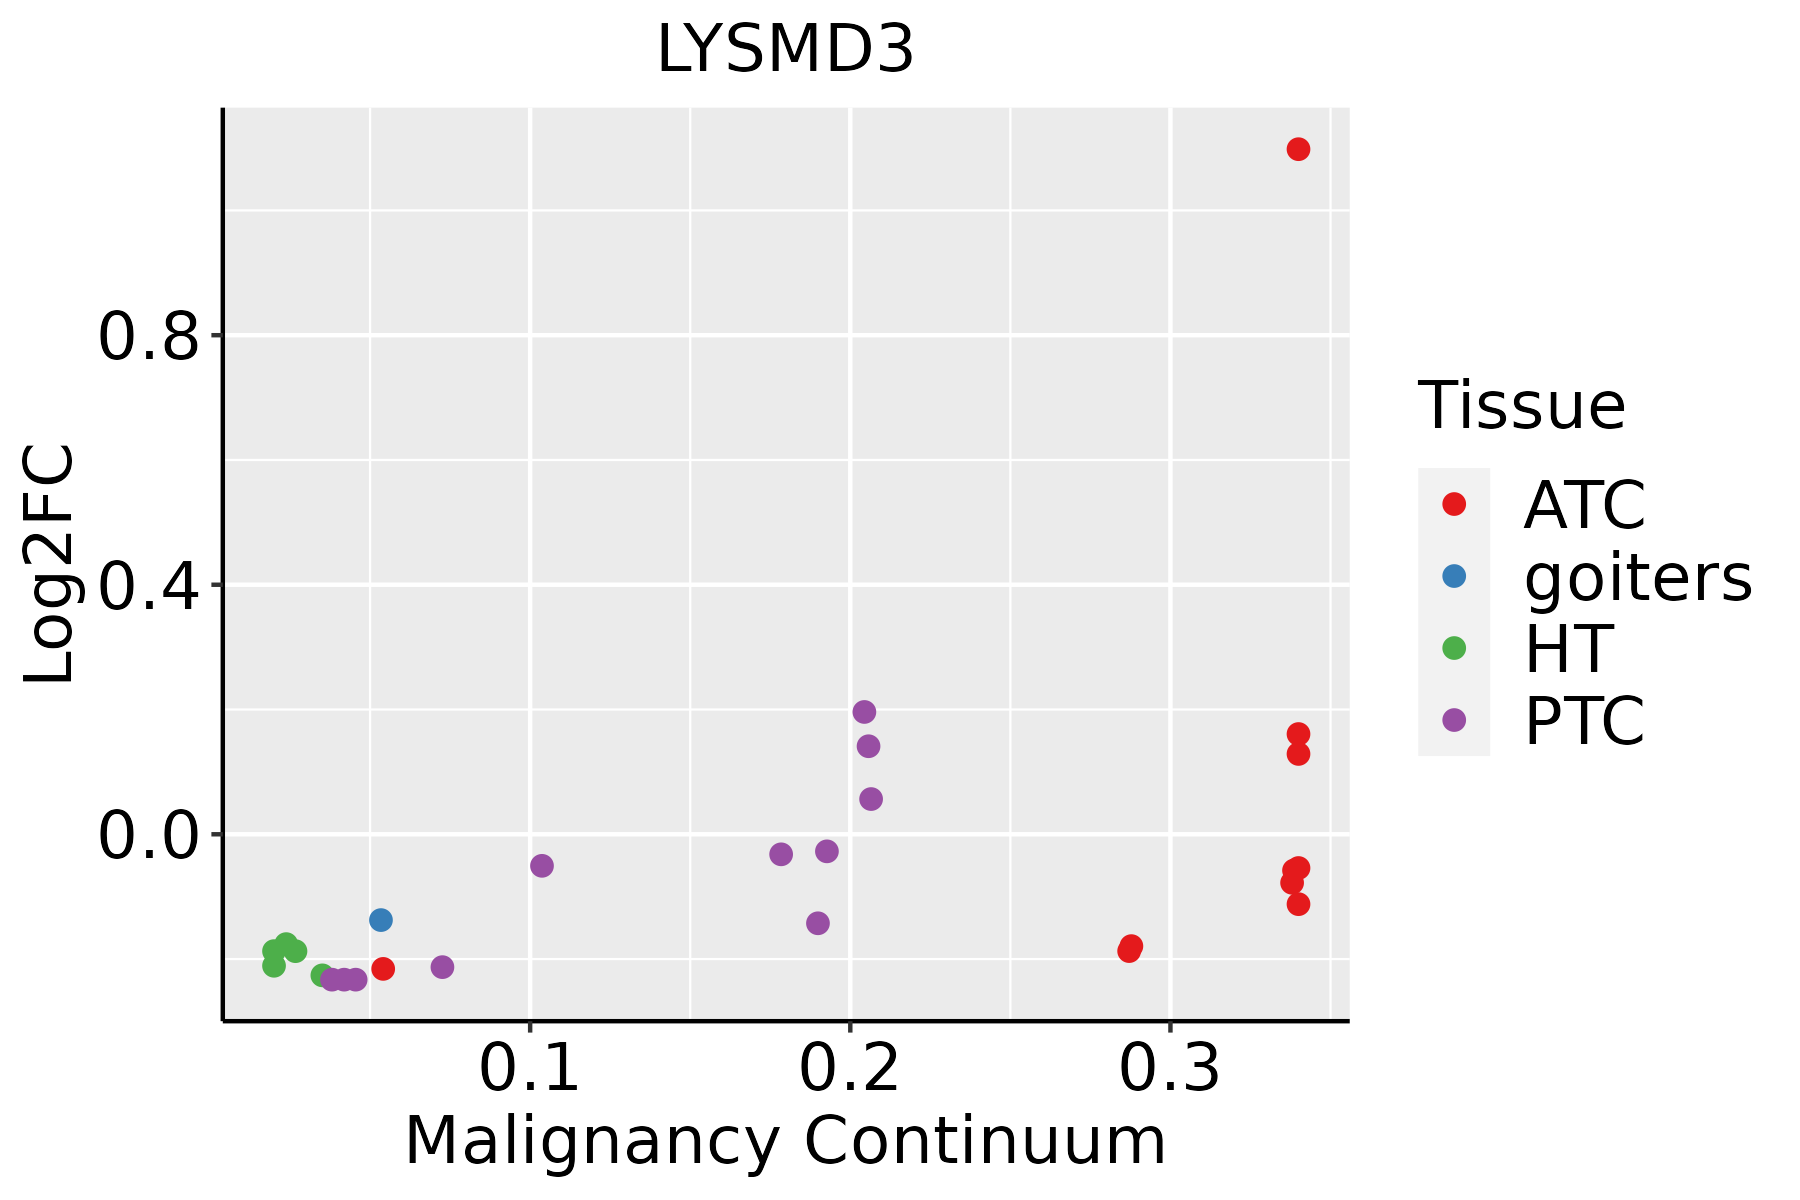 | ATC: Anaplastic thyroid cancer |
| HT: Hashimoto's thyroiditis | ||
| PTC: Papillary thyroid cancer |
| ∗log2FC in expression of this searched gene in stem-like cells from each diseased tissue sample relative to stem-like cells in normal samples in each tissue plotted against the malignancy continuum. Samples are colored based on if they are from different disease stage. |
Top |
Malignant transformation related pathway analysis |
| Find out the enriched GO biological processes and KEGG pathways involved in transition from healthy to precancer to cancer |
| Tissue | Disease Stage | Enriched GO biological Processes |
| Colorectum | AD |  |
| Colorectum | SER |  |
| Colorectum | MSS |  |
| Colorectum | MSI-H |  |
| Colorectum | FAP |  |
| ∗Top 15 enriched GO BP terms are showed in the bar plot of each disease state in each tissue. Each row represents a significant GO biological process which is colored according to the -log10(p.adjust). |
| Page: 1 2 3 4 5 6 7 8 9 |
| GO ID | Tissue | Disease Stage | Description | Gene Ratio | Bg Ratio | pvalue | p.adjust | Count |
| GO:000703010 | Thyroid | PTC | Golgi organization | 79/5968 | 157/18723 | 1.11e-06 | 1.64e-05 | 79 |
| GO:000703015 | Thyroid | ATC | Golgi organization | 79/6293 | 157/18723 | 1.07e-05 | 1.05e-04 | 79 |
| Page: 1 |
| Pathway ID | Tissue | Disease Stage | Description | Gene Ratio | Bg Ratio | pvalue | p.adjust | qvalue | Count |
| Page: 1 |
Top |
Cell-cell communication analysis |
| Identification of potential cell-cell interactions between two cell types and their ligand-receptor pairs for different disease states |
| Ligand | Receptor | LRpair | Pathway | Tissue | Disease Stage |
| Page: 1 |
Top |
Single-cell gene regulatory network inference analysis |
| Find out the significant the regulons (TFs) and the target genes of each regulon across cell types for different disease states |
| TF | Cell Type | Tissue | Disease Stage | Target Gene | RSS | Regulon Activity |
| ∗The dot plots of a searched regulon are shown for all cell subpopulations in each disease state of each tissue based on the regulon specific score inferred using pySCENIC and by calculating the average expression. |
| Page: 1 |
Top |
Somatic mutation of malignant transformation related genes |
| Annotation of somatic variants for genes involved in malignant transformation |
| Hugo Symbol | Variant Class | Variant Classification | dbSNP RS | HGVSc | HGVSp | HGVSp Short | SWISSPROT | BIOTYPE | SIFT | PolyPhen | Tumor Sample Barcode | Tissue | Histology | Sex | Age | Stage | Therapy Types | Drugs | Outcome |
| LYSMD3 | SNV | Missense_Mutation | c.321N>G | p.Ile107Met | p.I107M | Q7Z3D4 | protein_coding | deleterious(0) | possibly_damaging(0.678) | TCGA-A1-A0SO-01 | Breast | breast invasive carcinoma | Female | >=65 | I/II | Chemotherapy | SD | ||
| LYSMD3 | SNV | Missense_Mutation | c.91N>C | p.Asp31His | p.D31H | Q7Z3D4 | protein_coding | deleterious(0) | probably_damaging(0.963) | TCGA-D8-A1JA-01 | Breast | breast invasive carcinoma | Female | <65 | III/IV | Chemotherapy | adriamycin | PD | |
| LYSMD3 | SNV | Missense_Mutation | rs200104611 | c.355N>A | p.Glu119Lys | p.E119K | Q7Z3D4 | protein_coding | deleterious(0) | possibly_damaging(0.735) | TCGA-AA-3984-01 | Colorectum | colon adenocarcinoma | Female | <65 | I/II | Unknown | Unknown | SD |
| LYSMD3 | SNV | Missense_Mutation | c.251G>C | p.Cys84Ser | p.C84S | Q7Z3D4 | protein_coding | deleterious(0) | probably_damaging(0.999) | TCGA-AZ-6601-01 | Colorectum | colon adenocarcinoma | Male | >=65 | I/II | Unknown | Unknown | PD | |
| LYSMD3 | SNV | Missense_Mutation | rs200104611 | c.355N>A | p.Glu119Lys | p.E119K | Q7Z3D4 | protein_coding | deleterious(0) | possibly_damaging(0.735) | TCGA-CA-6717-01 | Colorectum | colon adenocarcinoma | Male | <65 | I/II | Chemotherapy | oxaliplatin | CR |
| LYSMD3 | SNV | Missense_Mutation | c.445G>T | p.Asp149Tyr | p.D149Y | Q7Z3D4 | protein_coding | deleterious(0) | possibly_damaging(0.514) | TCGA-AG-A002-01 | Colorectum | rectum adenocarcinoma | Male | <65 | I/II | Unknown | Unknown | SD | |
| LYSMD3 | SNV | Missense_Mutation | novel | c.167N>T | p.Arg56Ile | p.R56I | Q7Z3D4 | protein_coding | deleterious(0) | possibly_damaging(0.499) | TCGA-F5-6814-01 | Colorectum | rectum adenocarcinoma | Male | <65 | I/II | Unknown | Unknown | SD |
| LYSMD3 | insertion | Frame_Shift_Ins | novel | c.708_709insGATCATC | p.Leu237AspfsTer7 | p.L237Dfs*7 | Q7Z3D4 | protein_coding | TCGA-AM-5820-01 | Colorectum | colon adenocarcinoma | Female | <65 | I/II | Unknown | Unknown | SD | ||
| LYSMD3 | SNV | Missense_Mutation | novel | c.429N>C | p.Glu143Asp | p.E143D | Q7Z3D4 | protein_coding | tolerated(0.24) | benign(0) | TCGA-A5-A0G2-01 | Endometrium | uterine corpus endometrioid carcinoma | Female | <65 | III/IV | Unknown | Unknown | SD |
| LYSMD3 | SNV | Missense_Mutation | novel | c.7N>T | p.Gly3Trp | p.G3W | Q7Z3D4 | protein_coding | deleterious_low_confidence(0) | probably_damaging(0.998) | TCGA-A5-A0G2-01 | Endometrium | uterine corpus endometrioid carcinoma | Female | <65 | III/IV | Unknown | Unknown | SD |
| Page: 1 2 3 |
Top |
Related drugs of malignant transformation related genes |
| Identification of chemicals and drugs interact with genes involved in malignant transfromation |
| (DGIdb 4.0) |
| Entrez ID | Symbol | Category | Interaction Types | Drug Claim Name | Drug Name | PMIDs |
| Page: 1 |

Copyright 2023-Present -The University of Texas Health Science Center at Houston |