
|
|||||
|
 | |
| |
| |
| |
| |
| |
|
Gene: LYRM7 |
Gene summary for LYRM7 |
| Gene information | Species | Human | Gene symbol | LYRM7 | Gene ID | 90624 |
| Gene name | LYR motif containing 7 | |
| Gene Alias | C5orf31 | |
| Cytomap | 5q23.3-q31.1 | |
| Gene Type | protein-coding | GO ID | GO:0006091 | UniProtAcc | D6RBV5 |
Top |
Malignant transformation analysis |
| Identification of the aberrant gene expression in precancerous and cancerous lesions by comparing the gene expression of stem-like cells in diseased tissues with normal stem cells |
| Entrez ID | Symbol | Replicates | Species | Organ | Tissue | Adj P-value | Log2FC | Malignancy |
| 90624 | LYRM7 | LZE2T | Human | Esophagus | ESCC | 1.50e-04 | 4.75e-01 | 0.082 |
| 90624 | LYRM7 | LZE24T | Human | Esophagus | ESCC | 4.06e-09 | 1.93e-01 | 0.0596 |
| 90624 | LYRM7 | P2T-E | Human | Esophagus | ESCC | 1.46e-09 | 2.81e-01 | 0.1177 |
| 90624 | LYRM7 | P4T-E | Human | Esophagus | ESCC | 2.85e-17 | 3.47e-01 | 0.1323 |
| 90624 | LYRM7 | P5T-E | Human | Esophagus | ESCC | 6.88e-07 | 1.80e-01 | 0.1327 |
| 90624 | LYRM7 | P8T-E | Human | Esophagus | ESCC | 3.01e-02 | 7.82e-02 | 0.0889 |
| 90624 | LYRM7 | P9T-E | Human | Esophagus | ESCC | 3.18e-05 | 1.76e-01 | 0.1131 |
| 90624 | LYRM7 | P10T-E | Human | Esophagus | ESCC | 9.69e-07 | 2.10e-01 | 0.116 |
| 90624 | LYRM7 | P12T-E | Human | Esophagus | ESCC | 1.92e-05 | 1.76e-01 | 0.1122 |
| 90624 | LYRM7 | P15T-E | Human | Esophagus | ESCC | 4.32e-13 | 2.92e-01 | 0.1149 |
| 90624 | LYRM7 | P16T-E | Human | Esophagus | ESCC | 3.49e-06 | 1.92e-01 | 0.1153 |
| 90624 | LYRM7 | P17T-E | Human | Esophagus | ESCC | 5.38e-05 | 2.90e-01 | 0.1278 |
| 90624 | LYRM7 | P20T-E | Human | Esophagus | ESCC | 2.44e-13 | 2.74e-01 | 0.1124 |
| 90624 | LYRM7 | P21T-E | Human | Esophagus | ESCC | 6.95e-09 | 2.56e-01 | 0.1617 |
| 90624 | LYRM7 | P22T-E | Human | Esophagus | ESCC | 7.11e-04 | 1.22e-01 | 0.1236 |
| 90624 | LYRM7 | P23T-E | Human | Esophagus | ESCC | 2.15e-11 | 3.49e-01 | 0.108 |
| 90624 | LYRM7 | P24T-E | Human | Esophagus | ESCC | 4.46e-09 | 2.43e-01 | 0.1287 |
| 90624 | LYRM7 | P26T-E | Human | Esophagus | ESCC | 2.22e-05 | 1.60e-01 | 0.1276 |
| 90624 | LYRM7 | P27T-E | Human | Esophagus | ESCC | 2.02e-10 | 2.00e-01 | 0.1055 |
| 90624 | LYRM7 | P28T-E | Human | Esophagus | ESCC | 1.66e-08 | 1.85e-01 | 0.1149 |
| Page: 1 2 3 4 |
| Tissue | Expression Dynamics | Abbreviation |
| Esophagus | 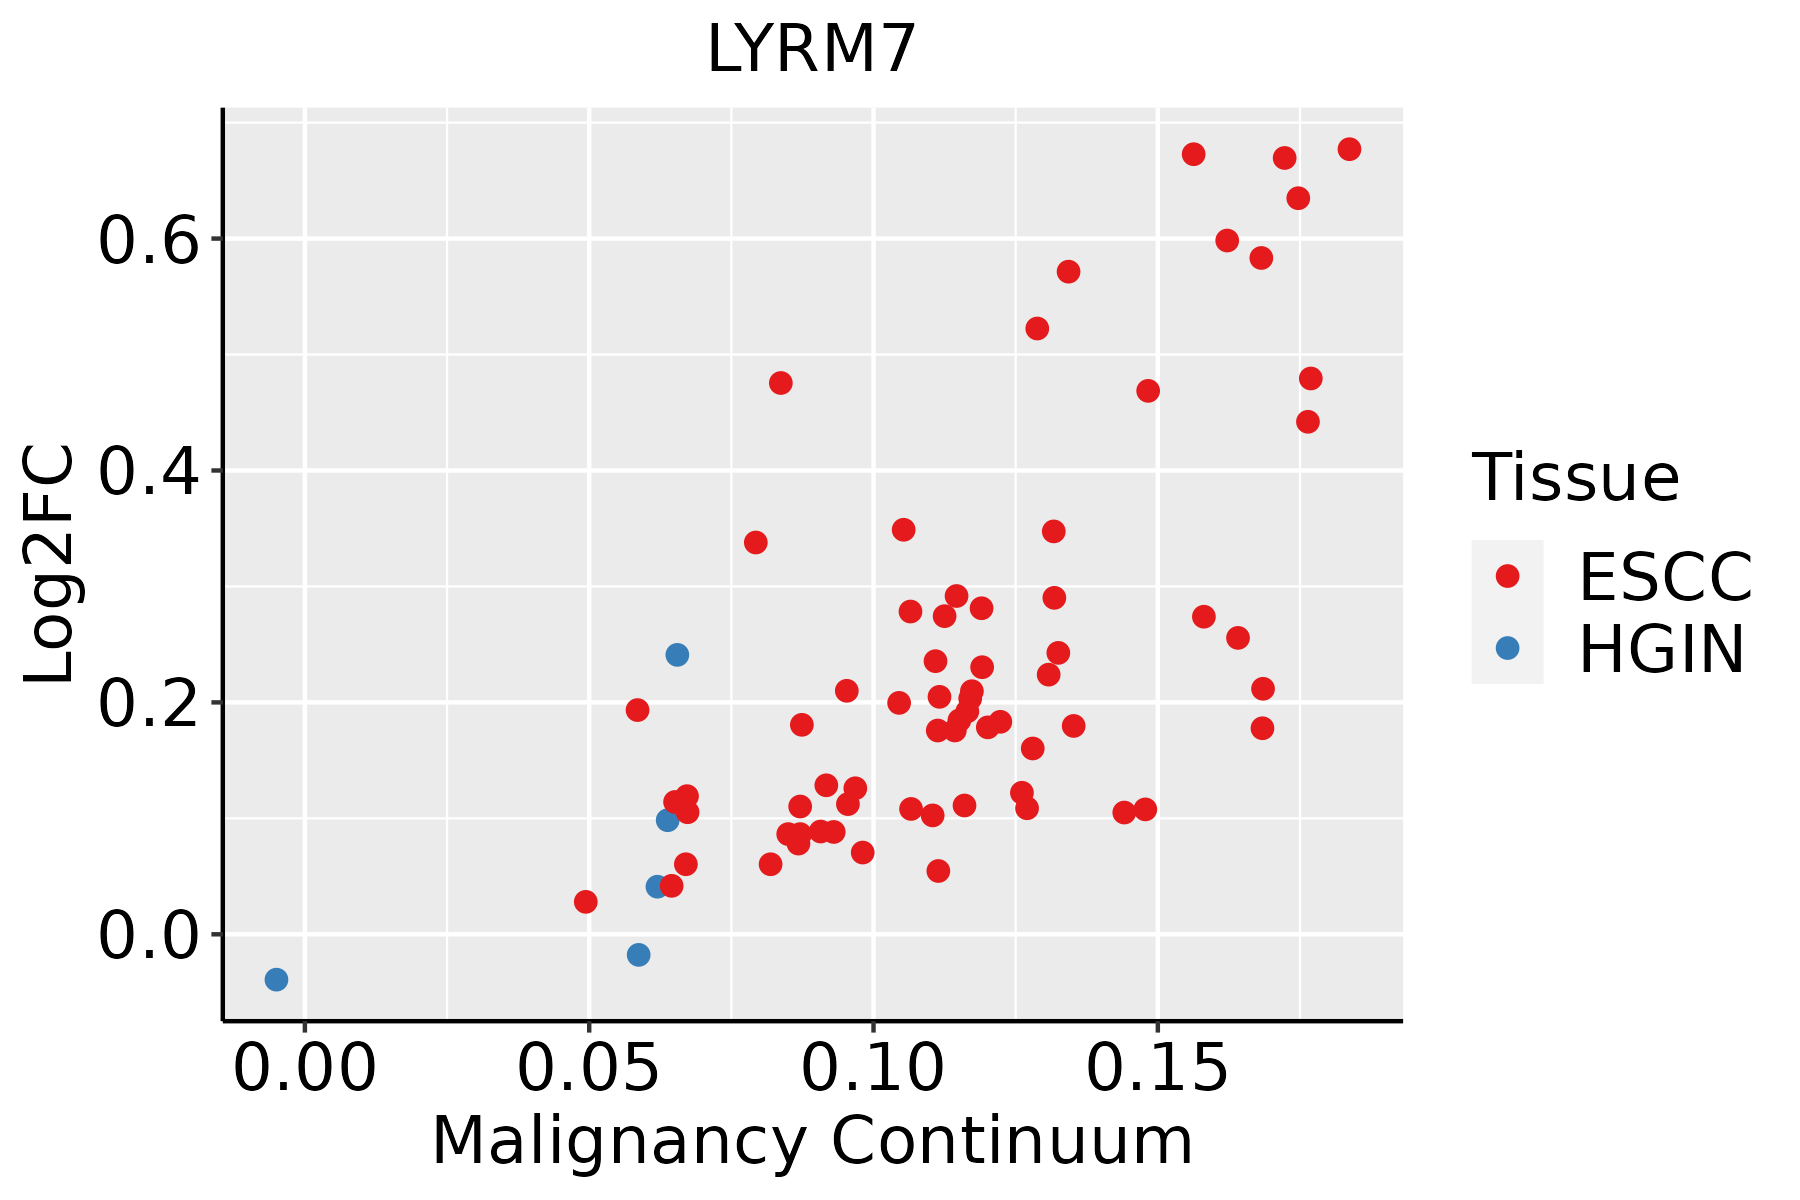 | ESCC: Esophageal squamous cell carcinoma |
| HGIN: High-grade intraepithelial neoplasias | ||
| LGIN: Low-grade intraepithelial neoplasias | ||
| Liver |  | HCC: Hepatocellular carcinoma |
| NAFLD: Non-alcoholic fatty liver disease | ||
| Oral Cavity | 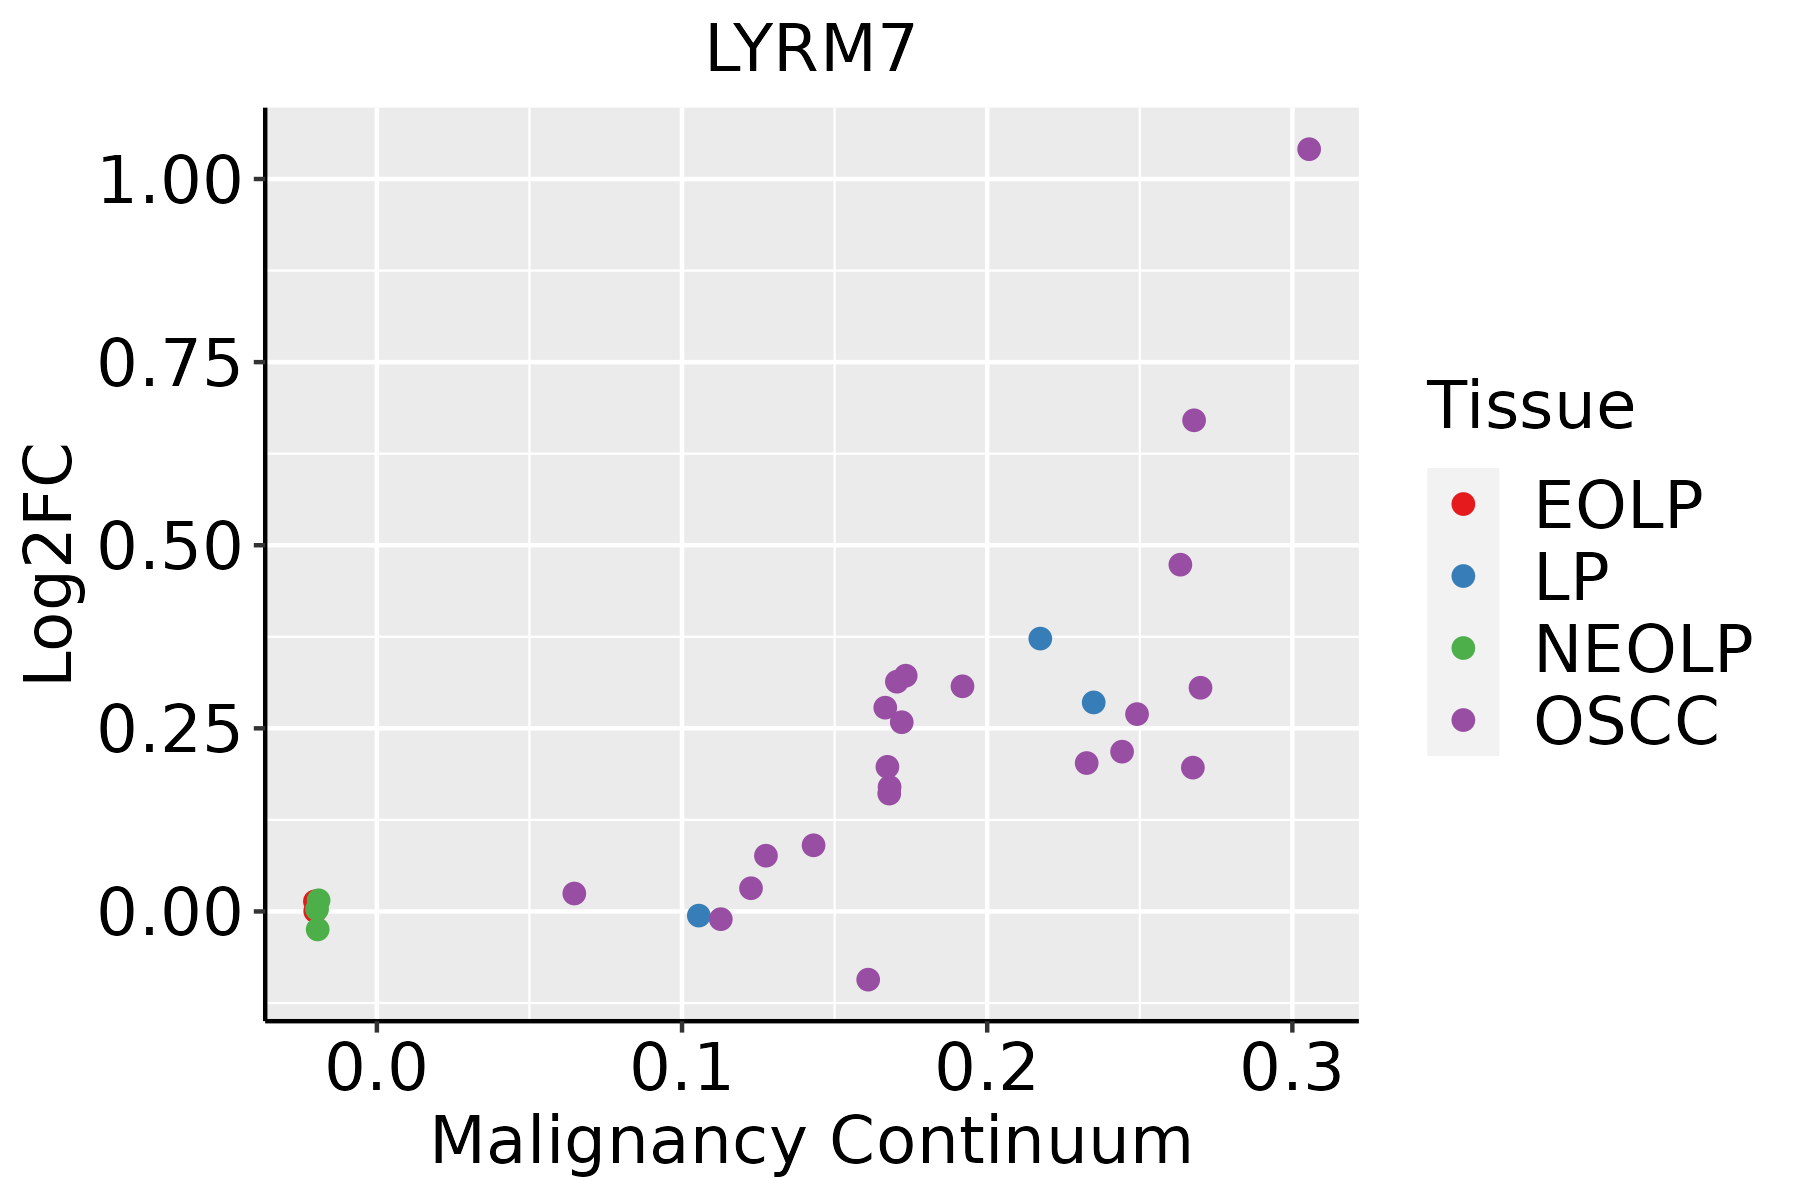 | EOLP: Erosive Oral lichen planus |
| LP: leukoplakia | ||
| NEOLP: Non-erosive oral lichen planus | ||
| OSCC: Oral squamous cell carcinoma | ||
| Skin | 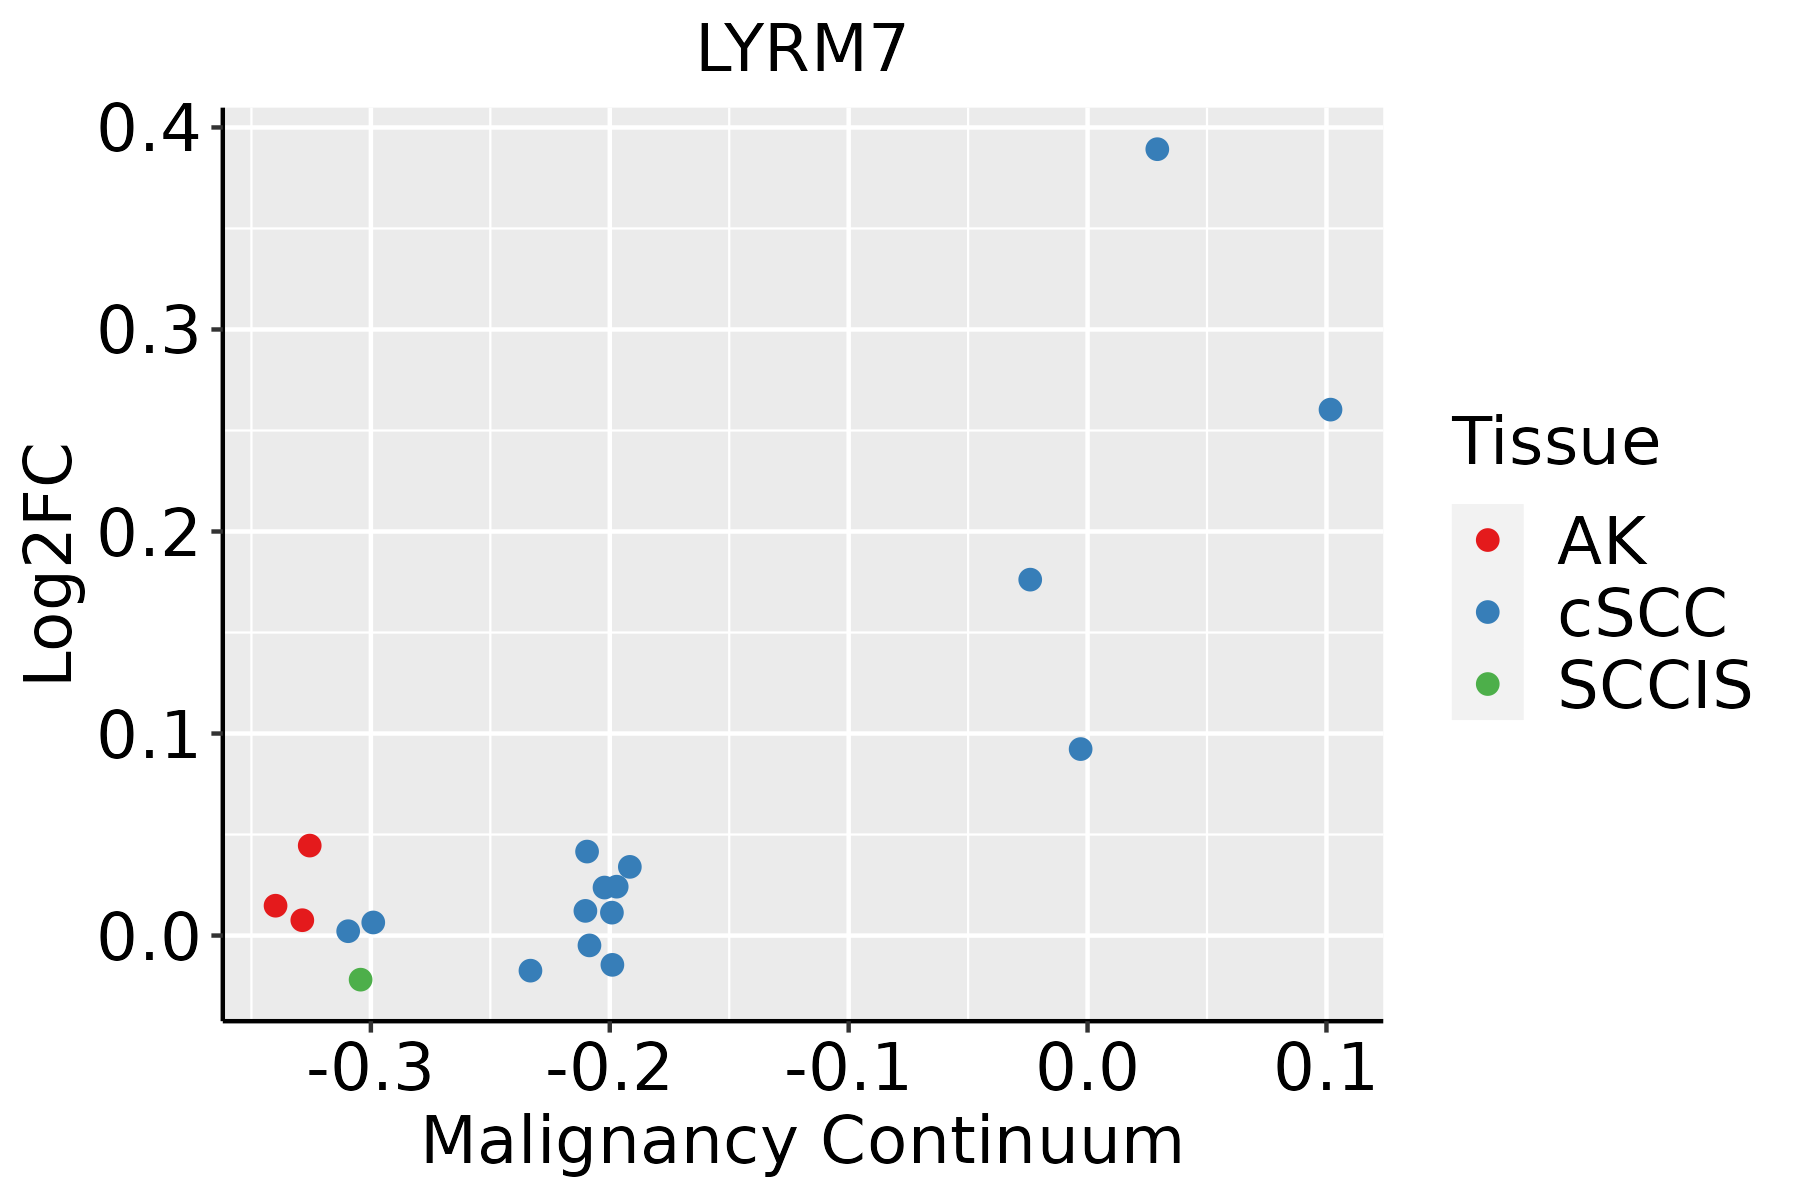 | AK: Actinic keratosis |
| cSCC: Cutaneous squamous cell carcinoma | ||
| SCCIS:squamous cell carcinoma in situ |
| ∗log2FC in expression of this searched gene in stem-like cells from each diseased tissue sample relative to stem-like cells in normal samples in each tissue plotted against the malignancy continuum. Samples are colored based on if they are from different disease stage. |
Top |
Malignant transformation related pathway analysis |
| Find out the enriched GO biological processes and KEGG pathways involved in transition from healthy to precancer to cancer |
| Tissue | Disease Stage | Enriched GO biological Processes |
| Colorectum | AD |  |
| Colorectum | SER |  |
| Colorectum | MSS |  |
| Colorectum | MSI-H |  |
| Colorectum | FAP |  |
| ∗Top 15 enriched GO BP terms are showed in the bar plot of each disease state in each tissue. Each row represents a significant GO biological process which is colored according to the -log10(p.adjust). |
| Page: 1 2 3 4 5 6 7 8 9 |
| GO ID | Tissue | Disease Stage | Description | Gene Ratio | Bg Ratio | pvalue | p.adjust | Count |
| GO:0006091110 | Esophagus | ESCC | generation of precursor metabolites and energy | 331/8552 | 490/18723 | 3.86e-23 | 8.45e-21 | 331 |
| GO:0045333110 | Esophagus | ESCC | cellular respiration | 173/8552 | 230/18723 | 4.53e-20 | 5.99e-18 | 173 |
| GO:0033108110 | Esophagus | ESCC | mitochondrial respiratory chain complex assembly | 83/8552 | 93/18723 | 9.56e-19 | 1.05e-16 | 83 |
| GO:0015980110 | Esophagus | ESCC | energy derivation by oxidation of organic compounds | 220/8552 | 318/18723 | 1.20e-17 | 1.09e-15 | 220 |
| GO:001700413 | Esophagus | ESCC | cytochrome complex assembly | 34/8552 | 36/18723 | 5.08e-10 | 1.31e-08 | 34 |
| GO:000609112 | Liver | Cirrhotic | generation of precursor metabolites and energy | 238/4634 | 490/18723 | 6.85e-31 | 1.07e-27 | 238 |
| GO:00453337 | Liver | Cirrhotic | cellular respiration | 122/4634 | 230/18723 | 2.15e-20 | 6.43e-18 | 122 |
| GO:001598012 | Liver | Cirrhotic | energy derivation by oxidation of organic compounds | 154/4634 | 318/18723 | 3.11e-20 | 8.87e-18 | 154 |
| GO:00331087 | Liver | Cirrhotic | mitochondrial respiratory chain complex assembly | 64/4634 | 93/18723 | 3.85e-19 | 7.79e-17 | 64 |
| GO:0017004 | Liver | Cirrhotic | cytochrome complex assembly | 22/4634 | 36/18723 | 3.92e-06 | 6.70e-05 | 22 |
| GO:000609122 | Liver | HCC | generation of precursor metabolites and energy | 340/7958 | 490/18723 | 4.04e-34 | 2.85e-31 | 340 |
| GO:004533312 | Liver | HCC | cellular respiration | 171/7958 | 230/18723 | 6.35e-23 | 1.26e-20 | 171 |
| GO:001598022 | Liver | HCC | energy derivation by oxidation of organic compounds | 221/7958 | 318/18723 | 1.02e-22 | 1.86e-20 | 221 |
| GO:003310812 | Liver | HCC | mitochondrial respiratory chain complex assembly | 80/7958 | 93/18723 | 3.47e-18 | 4.15e-16 | 80 |
| GO:00170041 | Liver | HCC | cytochrome complex assembly | 30/7958 | 36/18723 | 5.69e-07 | 9.03e-06 | 30 |
| GO:000609118 | Oral cavity | OSCC | generation of precursor metabolites and energy | 286/7305 | 490/18723 | 1.45e-18 | 1.71e-16 | 286 |
| GO:004533318 | Oral cavity | OSCC | cellular respiration | 153/7305 | 230/18723 | 2.07e-17 | 1.87e-15 | 153 |
| GO:003310818 | Oral cavity | OSCC | mitochondrial respiratory chain complex assembly | 75/7305 | 93/18723 | 2.17e-16 | 1.68e-14 | 75 |
| GO:001598018 | Oral cavity | OSCC | energy derivation by oxidation of organic compounds | 190/7305 | 318/18723 | 4.10e-14 | 2.26e-12 | 190 |
| GO:00170043 | Oral cavity | OSCC | cytochrome complex assembly | 31/7305 | 36/18723 | 7.28e-09 | 1.53e-07 | 31 |
| Page: 1 2 |
| Pathway ID | Tissue | Disease Stage | Description | Gene Ratio | Bg Ratio | pvalue | p.adjust | qvalue | Count |
| Page: 1 |
Top |
Cell-cell communication analysis |
| Identification of potential cell-cell interactions between two cell types and their ligand-receptor pairs for different disease states |
| Ligand | Receptor | LRpair | Pathway | Tissue | Disease Stage |
| Page: 1 |
Top |
Single-cell gene regulatory network inference analysis |
| Find out the significant the regulons (TFs) and the target genes of each regulon across cell types for different disease states |
| TF | Cell Type | Tissue | Disease Stage | Target Gene | RSS | Regulon Activity |
| ∗The dot plots of a searched regulon are shown for all cell subpopulations in each disease state of each tissue based on the regulon specific score inferred using pySCENIC and by calculating the average expression. |
| Page: 1 |
Top |
Somatic mutation of malignant transformation related genes |
| Annotation of somatic variants for genes involved in malignant transformation |
| Hugo Symbol | Variant Class | Variant Classification | dbSNP RS | HGVSc | HGVSp | HGVSp Short | SWISSPROT | BIOTYPE | SIFT | PolyPhen | Tumor Sample Barcode | Tissue | Histology | Sex | Age | Stage | Therapy Types | Drugs | Outcome |
| LYRM7 | SNV | Missense_Mutation | novel | c.254C>G | p.Pro85Arg | p.P85R | Q5U5X0 | protein_coding | deleterious(0.02) | possibly_damaging(0.77) | TCGA-BH-A2L8-01 | Breast | breast invasive carcinoma | Female | <65 | I/II | Chemotherapy | cytoxan | CR |
| LYRM7 | SNV | Missense_Mutation | novel | c.266N>G | p.Leu89Arg | p.L89R | Q5U5X0 | protein_coding | tolerated(0.07) | probably_damaging(0.973) | TCGA-A5-A0G1-01 | Endometrium | uterine corpus endometrioid carcinoma | Female | >=65 | I/II | Unknown | Unknown | SD |
| LYRM7 | SNV | Missense_Mutation | novel | c.68N>C | p.Lys23Thr | p.K23T | Q5U5X0 | protein_coding | tolerated(0.06) | benign(0.133) | TCGA-A5-A2K5-01 | Endometrium | uterine corpus endometrioid carcinoma | Female | >=65 | I/II | Unknown | Unknown | SD |
| LYRM7 | SNV | Missense_Mutation | c.250N>A | p.Val84Ile | p.V84I | Q5U5X0 | protein_coding | tolerated(0.17) | benign(0.003) | TCGA-AP-A051-01 | Endometrium | uterine corpus endometrioid carcinoma | Female | >=65 | I/II | Unknown | Unknown | SD | |
| LYRM7 | SNV | Missense_Mutation | c.155T>C | p.Ile52Thr | p.I52T | Q5U5X0 | protein_coding | deleterious(0) | probably_damaging(0.999) | TCGA-AP-A0LM-01 | Endometrium | uterine corpus endometrioid carcinoma | Female | <65 | III/IV | Chemotherapy | cisplatin | SD | |
| LYRM7 | SNV | Missense_Mutation | c.10N>A | p.Ala4Thr | p.A4T | Q5U5X0 | protein_coding | tolerated(0.33) | benign(0.01) | TCGA-B5-A0JY-01 | Endometrium | uterine corpus endometrioid carcinoma | Female | <65 | III/IV | Chemotherapy | doxorubicin | SD | |
| LYRM7 | SNV | Missense_Mutation | novel | c.71N>G | p.Asn24Ser | p.N24S | Q5U5X0 | protein_coding | tolerated(0.06) | possibly_damaging(0.78) | TCGA-EO-A22X-01 | Endometrium | uterine corpus endometrioid carcinoma | Female | <65 | III/IV | Unspecific | Carboplatin | Complete Response |
| LYRM7 | SNV | Missense_Mutation | novel | c.269N>G | p.Leu90Arg | p.L90R | Q5U5X0 | protein_coding | deleterious(0) | probably_damaging(0.98) | TCGA-EO-A3B0-01 | Endometrium | uterine corpus endometrioid carcinoma | Female | <65 | III/IV | Unknown | Unknown | SD |
| LYRM7 | SNV | Missense_Mutation | novel | c.289N>G | p.Cys97Gly | p.C97G | Q5U5X0 | protein_coding | tolerated(0.07) | benign(0.212) | TCGA-95-7567-01 | Lung | lung adenocarcinoma | Male | <65 | I/II | Chemotherapy | cisplatin | SD |
| Page: 1 |
Top |
Related drugs of malignant transformation related genes |
| Identification of chemicals and drugs interact with genes involved in malignant transfromation |
| (DGIdb 4.0) |
| Entrez ID | Symbol | Category | Interaction Types | Drug Claim Name | Drug Name | PMIDs |
| Page: 1 |

Copyright 2023-Present -The University of Texas Health Science Center at Houston |