
|
|||||
|
 | |
| |
| |
| |
| |
| |
|
Gene: LYRM2 |
Gene summary for LYRM2 |
| Gene information | Species | Human | Gene symbol | LYRM2 | Gene ID | 57226 |
| Gene name | LYR motif containing 2 | |
| Gene Alias | DJ122O8.2 | |
| Cytomap | 6q15 | |
| Gene Type | protein-coding | GO ID | GO:0003674 | UniProtAcc | Q9NU23 |
Top |
Malignant transformation analysis |
| Identification of the aberrant gene expression in precancerous and cancerous lesions by comparing the gene expression of stem-like cells in diseased tissues with normal stem cells |
| Entrez ID | Symbol | Replicates | Species | Organ | Tissue | Adj P-value | Log2FC | Malignancy |
| 57226 | LYRM2 | HTA11_347_2000001011 | Human | Colorectum | AD | 9.17e-09 | 4.36e-01 | -0.1954 |
| 57226 | LYRM2 | HTA11_696_2000001011 | Human | Colorectum | AD | 3.51e-04 | 2.43e-01 | -0.1464 |
| 57226 | LYRM2 | HTA11_99999971662_82457 | Human | Colorectum | MSS | 4.39e-02 | 2.66e-01 | 0.3859 |
| 57226 | LYRM2 | A002-C-205 | Human | Colorectum | FAP | 1.34e-02 | -1.01e-01 | -0.1236 |
| 57226 | LYRM2 | LZE4T | Human | Esophagus | ESCC | 2.95e-14 | 3.11e-01 | 0.0811 |
| 57226 | LYRM2 | LZE5T | Human | Esophagus | ESCC | 8.36e-08 | 5.09e-01 | 0.0514 |
| 57226 | LYRM2 | LZE7T | Human | Esophagus | ESCC | 1.58e-09 | 5.26e-01 | 0.0667 |
| 57226 | LYRM2 | LZE8T | Human | Esophagus | ESCC | 6.47e-03 | 1.96e-01 | 0.067 |
| 57226 | LYRM2 | LZE20T | Human | Esophagus | ESCC | 3.11e-11 | 2.21e-01 | 0.0662 |
| 57226 | LYRM2 | LZE24T | Human | Esophagus | ESCC | 1.88e-17 | 4.24e-01 | 0.0596 |
| 57226 | LYRM2 | LZE21T | Human | Esophagus | ESCC | 3.91e-06 | 5.71e-01 | 0.0655 |
| 57226 | LYRM2 | LZE6T | Human | Esophagus | ESCC | 3.72e-06 | 2.90e-01 | 0.0845 |
| 57226 | LYRM2 | P1T-E | Human | Esophagus | ESCC | 2.30e-16 | 5.63e-01 | 0.0875 |
| 57226 | LYRM2 | P2T-E | Human | Esophagus | ESCC | 2.00e-39 | 6.72e-01 | 0.1177 |
| 57226 | LYRM2 | P4T-E | Human | Esophagus | ESCC | 1.94e-44 | 9.74e-01 | 0.1323 |
| 57226 | LYRM2 | P5T-E | Human | Esophagus | ESCC | 9.88e-38 | 7.02e-01 | 0.1327 |
| 57226 | LYRM2 | P8T-E | Human | Esophagus | ESCC | 4.51e-30 | 4.97e-01 | 0.0889 |
| 57226 | LYRM2 | P9T-E | Human | Esophagus | ESCC | 6.53e-15 | 3.04e-01 | 0.1131 |
| 57226 | LYRM2 | P10T-E | Human | Esophagus | ESCC | 2.41e-50 | 8.40e-01 | 0.116 |
| 57226 | LYRM2 | P11T-E | Human | Esophagus | ESCC | 6.17e-19 | 7.25e-01 | 0.1426 |
| Page: 1 2 3 4 5 6 7 |
| Tissue | Expression Dynamics | Abbreviation |
| Colorectum (GSE201348) |  | FAP: Familial adenomatous polyposis |
| CRC: Colorectal cancer | ||
| Colorectum (HTA11) | 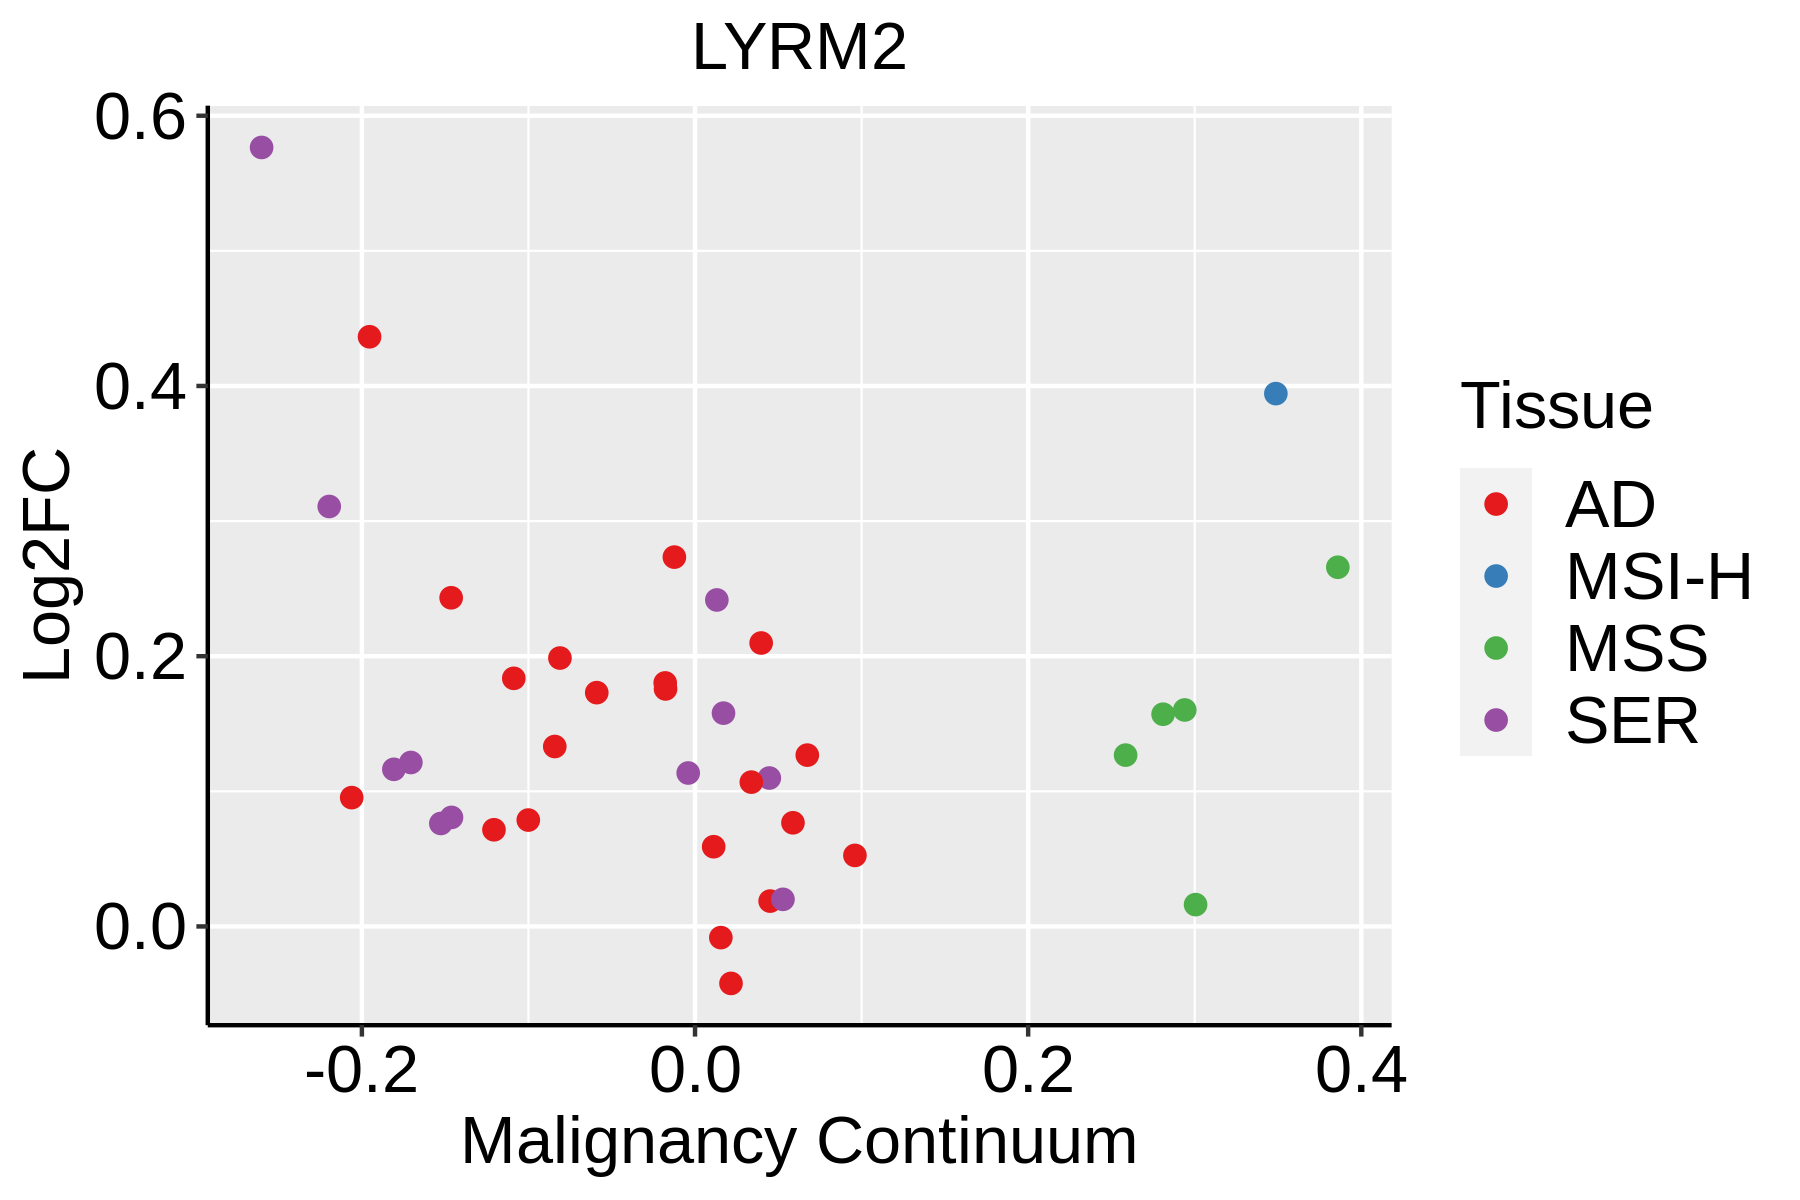 | AD: Adenomas |
| SER: Sessile serrated lesions | ||
| MSI-H: Microsatellite-high colorectal cancer | ||
| MSS: Microsatellite stable colorectal cancer | ||
| Esophagus |  | ESCC: Esophageal squamous cell carcinoma |
| HGIN: High-grade intraepithelial neoplasias | ||
| LGIN: Low-grade intraepithelial neoplasias | ||
| Liver | 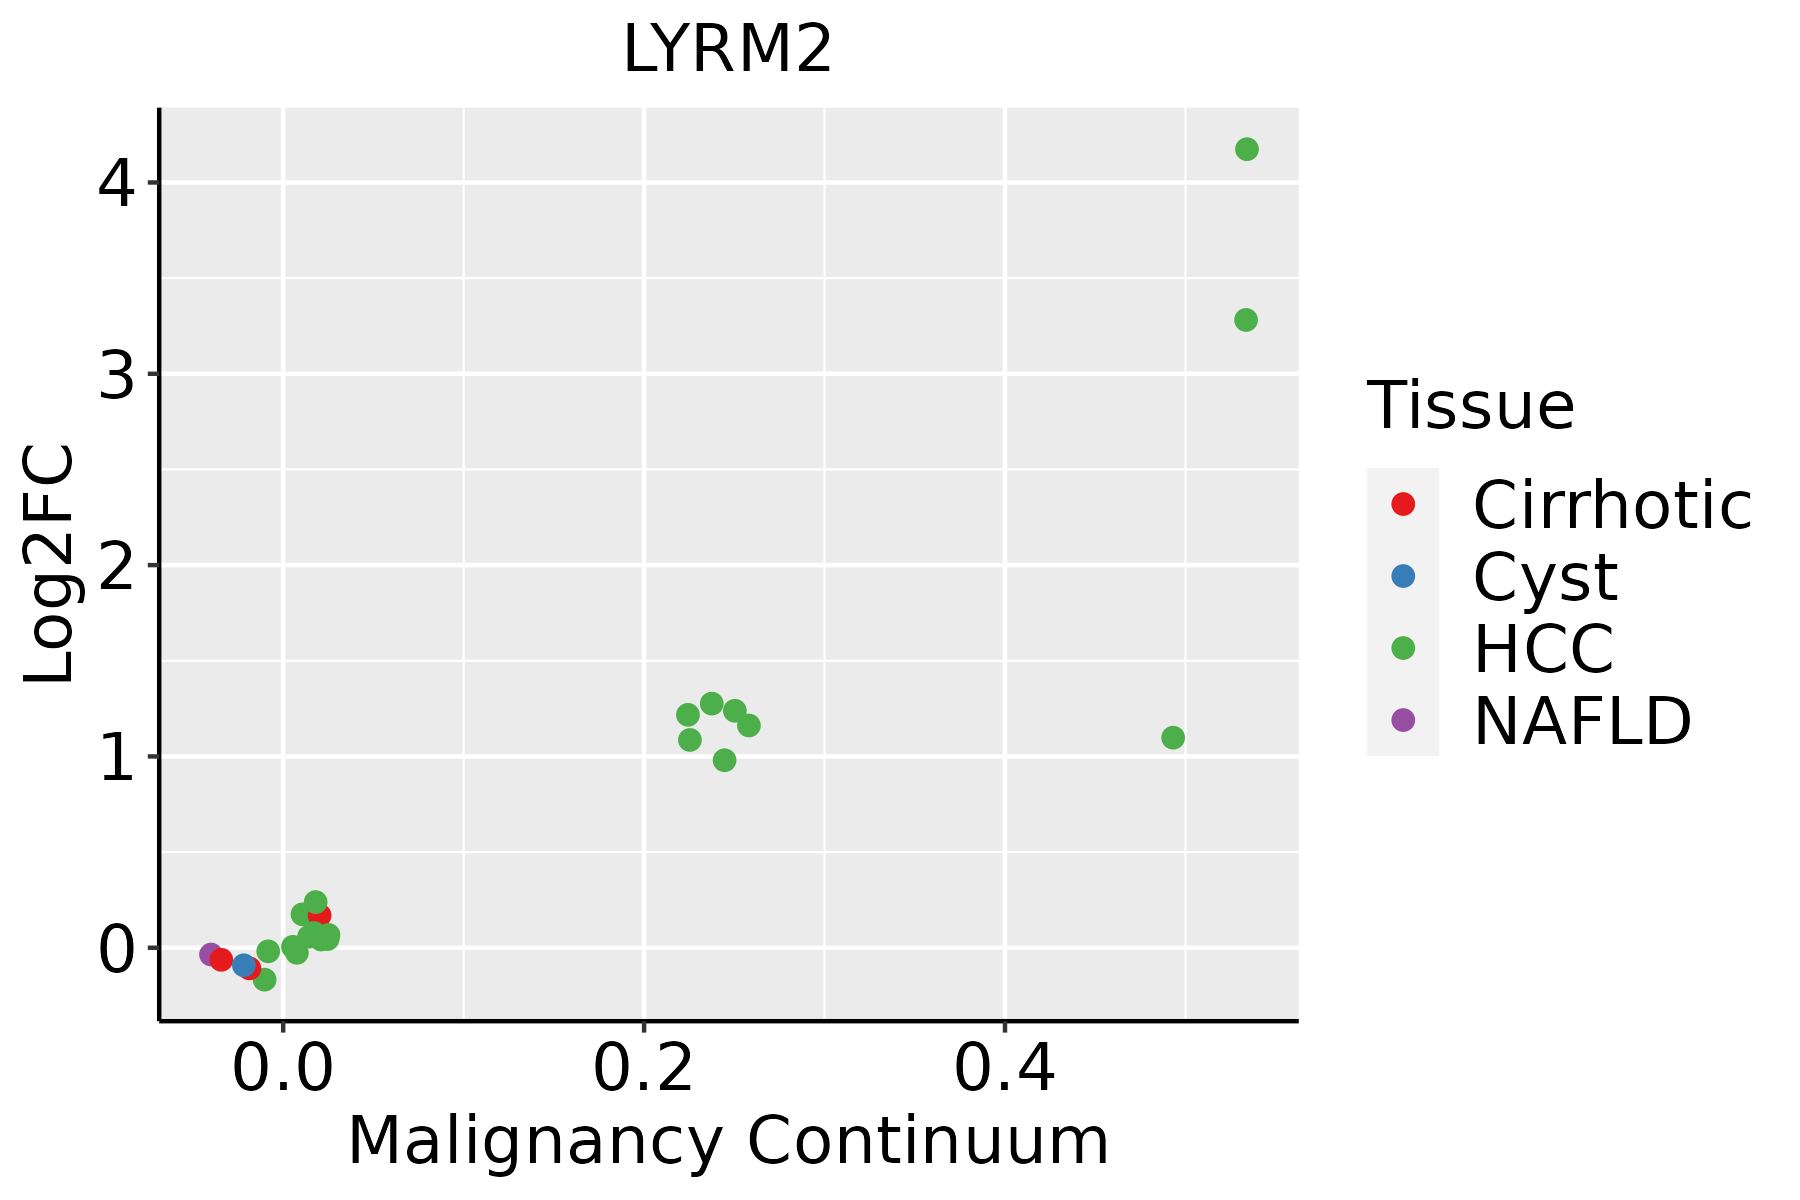 | HCC: Hepatocellular carcinoma |
| NAFLD: Non-alcoholic fatty liver disease | ||
| Oral Cavity | 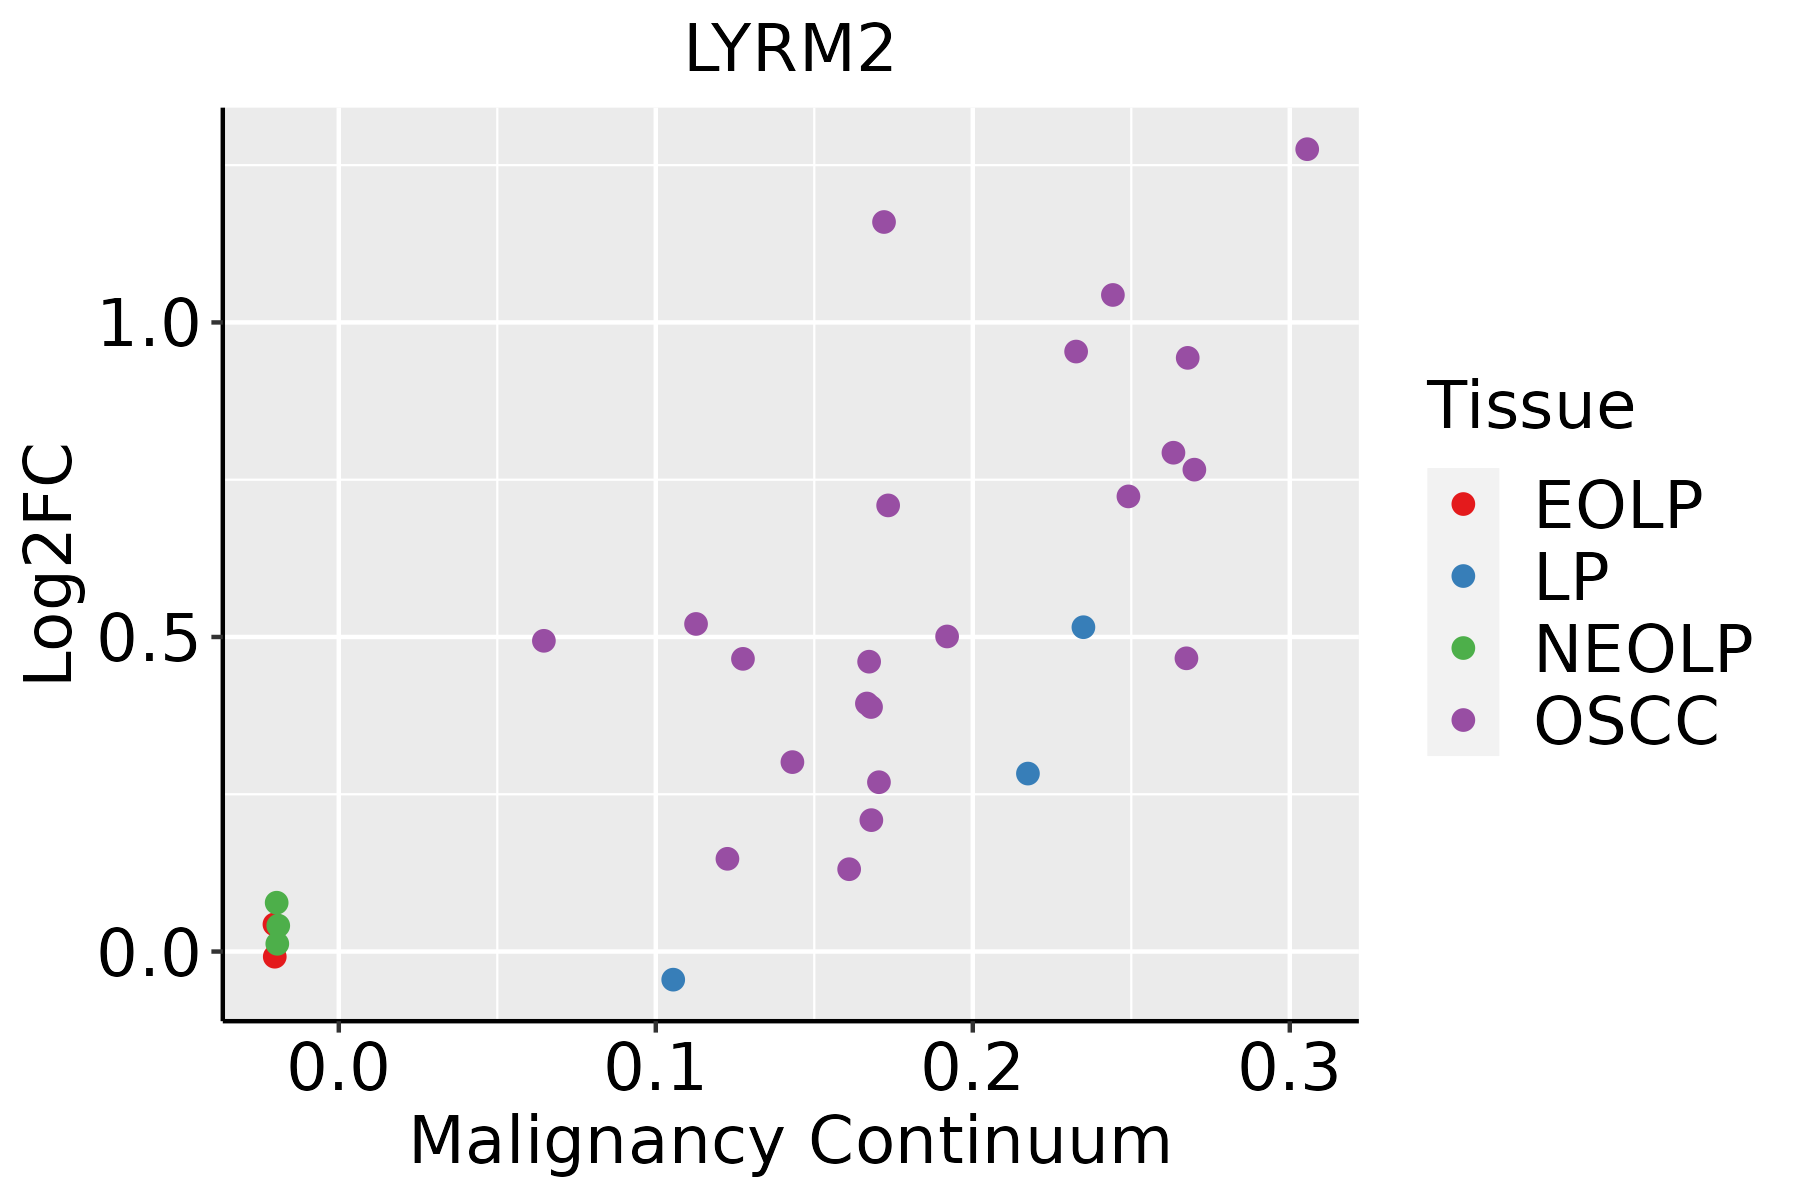 | EOLP: Erosive Oral lichen planus |
| LP: leukoplakia | ||
| NEOLP: Non-erosive oral lichen planus | ||
| OSCC: Oral squamous cell carcinoma | ||
| Skin | 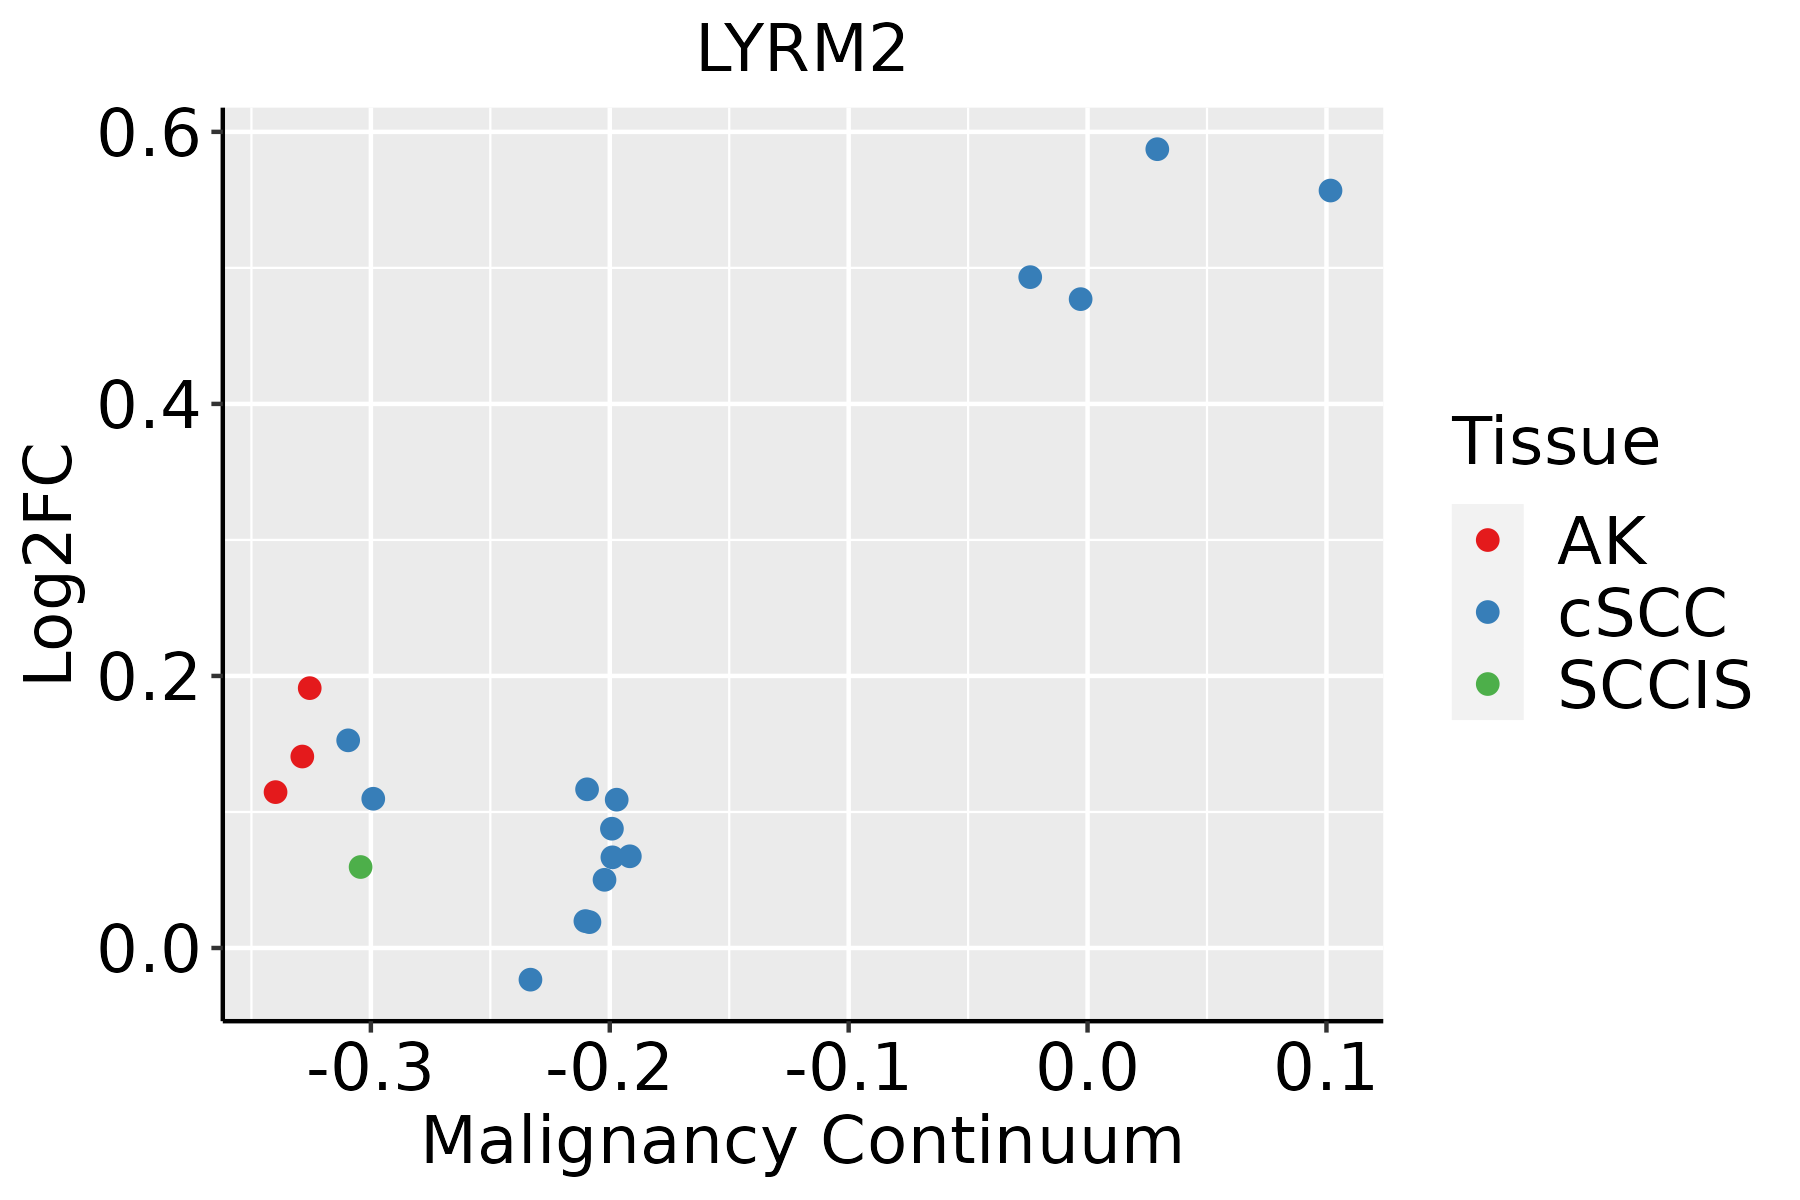 | AK: Actinic keratosis |
| cSCC: Cutaneous squamous cell carcinoma | ||
| SCCIS:squamous cell carcinoma in situ | ||
| Thyroid | 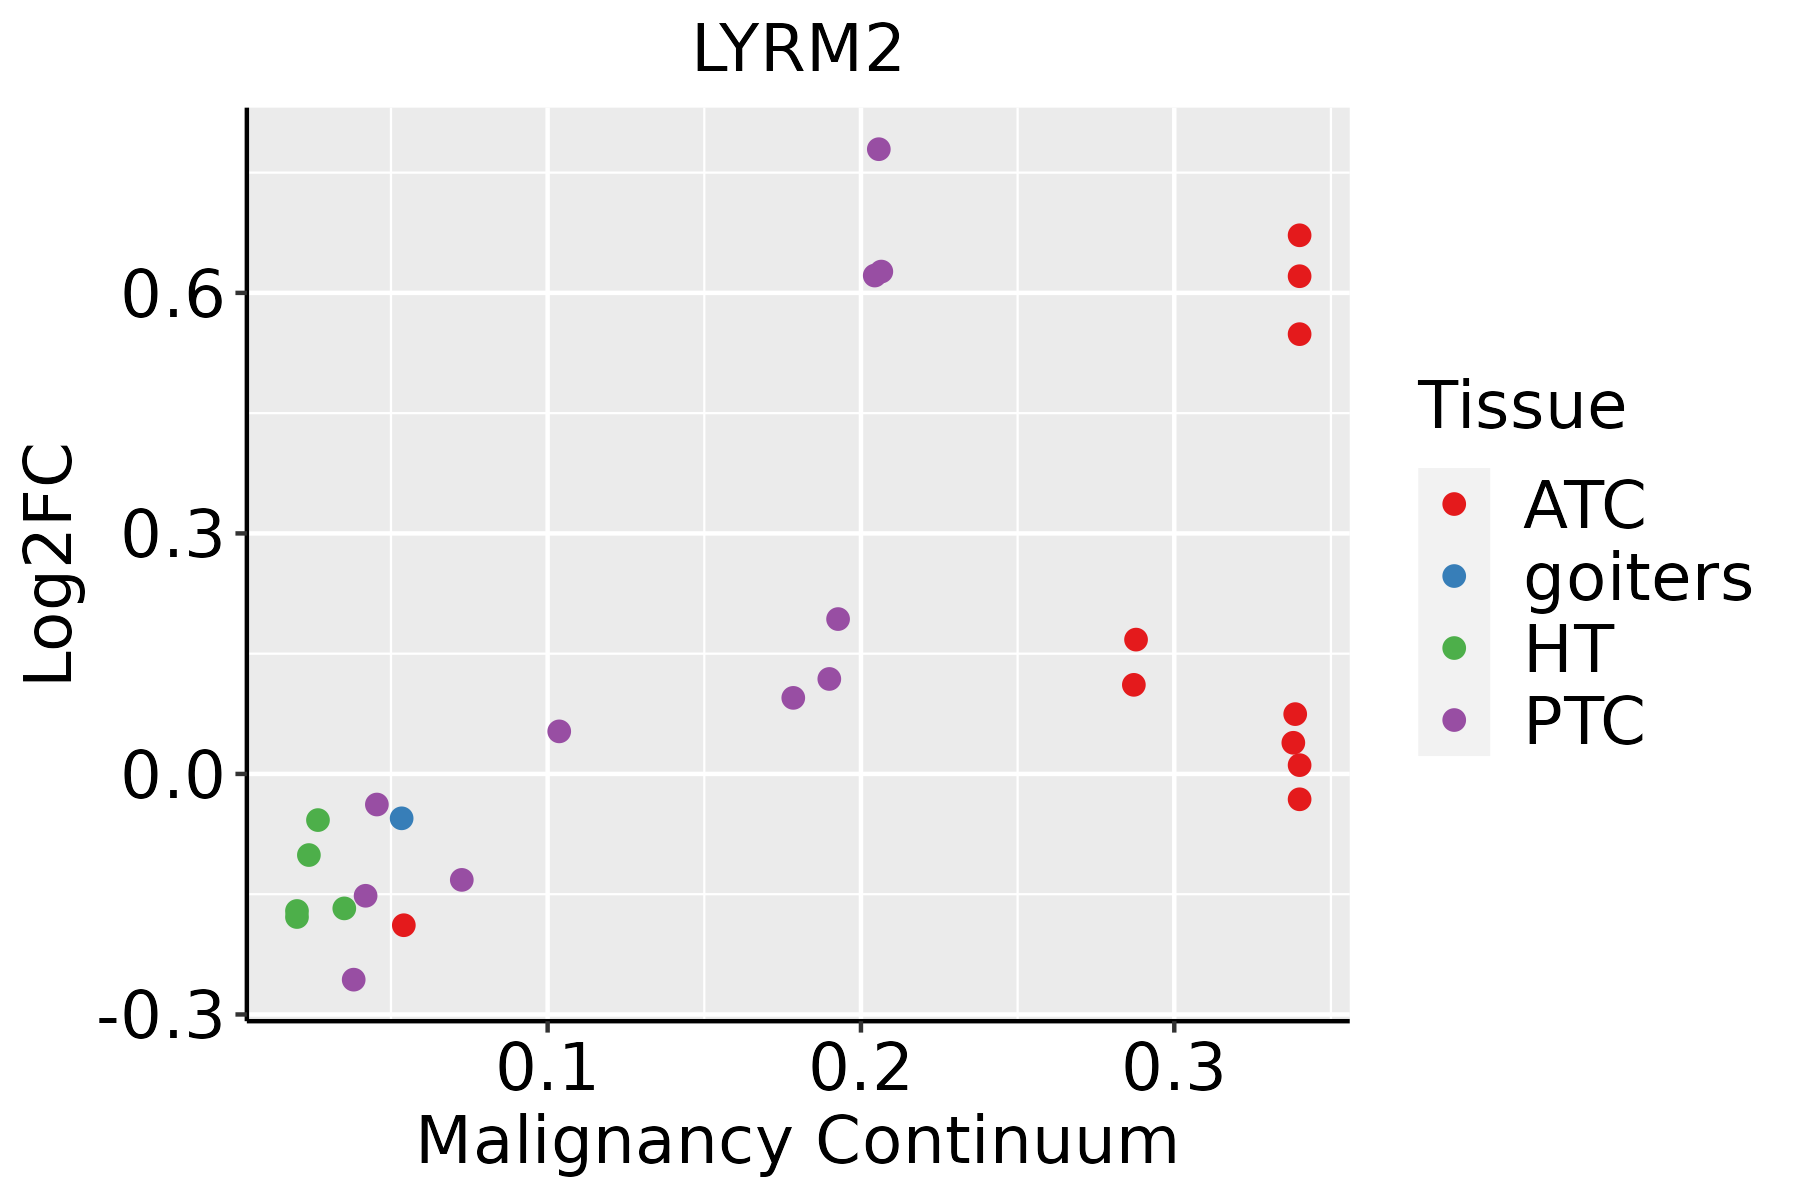 | ATC: Anaplastic thyroid cancer |
| HT: Hashimoto's thyroiditis | ||
| PTC: Papillary thyroid cancer |
| ∗log2FC in expression of this searched gene in stem-like cells from each diseased tissue sample relative to stem-like cells in normal samples in each tissue plotted against the malignancy continuum. Samples are colored based on if they are from different disease stage. |
Top |
Malignant transformation related pathway analysis |
| Find out the enriched GO biological processes and KEGG pathways involved in transition from healthy to precancer to cancer |
| Tissue | Disease Stage | Enriched GO biological Processes |
| Colorectum | AD |  |
| Colorectum | SER |  |
| Colorectum | MSS |  |
| Colorectum | MSI-H |  |
| Colorectum | FAP |  |
| ∗Top 15 enriched GO BP terms are showed in the bar plot of each disease state in each tissue. Each row represents a significant GO biological process which is colored according to the -log10(p.adjust). |
| Page: 1 2 3 4 5 6 7 8 9 |
| GO ID | Tissue | Disease Stage | Description | Gene Ratio | Bg Ratio | pvalue | p.adjust | Count |
| Page: 1 |
| Pathway ID | Tissue | Disease Stage | Description | Gene Ratio | Bg Ratio | pvalue | p.adjust | qvalue | Count |
| Page: 1 |
Top |
Cell-cell communication analysis |
| Identification of potential cell-cell interactions between two cell types and their ligand-receptor pairs for different disease states |
| Ligand | Receptor | LRpair | Pathway | Tissue | Disease Stage |
| Page: 1 |
Top |
Single-cell gene regulatory network inference analysis |
| Find out the significant the regulons (TFs) and the target genes of each regulon across cell types for different disease states |
| TF | Cell Type | Tissue | Disease Stage | Target Gene | RSS | Regulon Activity |
| ∗The dot plots of a searched regulon are shown for all cell subpopulations in each disease state of each tissue based on the regulon specific score inferred using pySCENIC and by calculating the average expression. |
| Page: 1 |
Top |
Somatic mutation of malignant transformation related genes |
| Annotation of somatic variants for genes involved in malignant transformation |
| Hugo Symbol | Variant Class | Variant Classification | dbSNP RS | HGVSc | HGVSp | HGVSp Short | SWISSPROT | BIOTYPE | SIFT | PolyPhen | Tumor Sample Barcode | Tissue | Histology | Sex | Age | Stage | Therapy Types | Drugs | Outcome |
| LYRM2 | insertion | Frame_Shift_Ins | novel | c.244_245insA | p.Thr82AsnfsTer14 | p.T82Nfs*14 | Q9NU23 | protein_coding | TCGA-AA-3695-01 | Colorectum | colon adenocarcinoma | Female | <65 | III/IV | Unknown | Unknown | SD | ||
| LYRM2 | SNV | Missense_Mutation | novel | c.212A>G | p.Gln71Arg | p.Q71R | Q9NU23 | protein_coding | tolerated(0.29) | probably_damaging(0.982) | TCGA-B5-A1MX-01 | Endometrium | uterine corpus endometrioid carcinoma | Female | <65 | I/II | Hormone Therapy | megace | SD |
| LYRM2 | SNV | Missense_Mutation | rs534210657 | c.169N>G | p.Lys57Glu | p.K57E | Q9NU23 | protein_coding | deleterious(0.03) | probably_damaging(0.994) | TCGA-95-7039-01 | Lung | lung adenocarcinoma | Female | <65 | I/II | Unknown | Unknown | PD |
| LYRM2 | SNV | Missense_Mutation | novel | c.186G>T | p.Glu62Asp | p.E62D | Q9NU23 | protein_coding | deleterious(0.01) | possibly_damaging(0.748) | TCGA-37-3789-01 | Lung | lung squamous cell carcinoma | Male | >=65 | I/II | Unknown | Unknown | SD |
| Page: 1 |
Top |
Related drugs of malignant transformation related genes |
| Identification of chemicals and drugs interact with genes involved in malignant transfromation |
| (DGIdb 4.0) |
| Entrez ID | Symbol | Category | Interaction Types | Drug Claim Name | Drug Name | PMIDs |
| Page: 1 |

Copyright 2023-Present -The University of Texas Health Science Center at Houston |