
|
|||||
|
 | |
| |
| |
| |
| |
| |
|
Gene: LYPLAL1 |
Gene summary for LYPLAL1 |
| Gene information | Species | Human | Gene symbol | LYPLAL1 | Gene ID | 127018 |
| Gene name | lysophospholipase like 1 | |
| Gene Alias | Q96AV0 | |
| Cytomap | 1q41 | |
| Gene Type | protein-coding | GO ID | GO:0002084 | UniProtAcc | Q5VWZ2 |
Top |
Malignant transformation analysis |
| Identification of the aberrant gene expression in precancerous and cancerous lesions by comparing the gene expression of stem-like cells in diseased tissues with normal stem cells |
| Entrez ID | Symbol | Replicates | Species | Organ | Tissue | Adj P-value | Log2FC | Malignancy |
| 127018 | LYPLAL1 | LZE2T | Human | Esophagus | ESCC | 1.92e-06 | 9.25e-01 | 0.082 |
| 127018 | LYPLAL1 | LZE4T | Human | Esophagus | ESCC | 6.36e-18 | 5.10e-01 | 0.0811 |
| 127018 | LYPLAL1 | LZE7T | Human | Esophagus | ESCC | 7.35e-18 | 1.14e+00 | 0.0667 |
| 127018 | LYPLAL1 | LZE8T | Human | Esophagus | ESCC | 2.42e-06 | 2.92e-01 | 0.067 |
| 127018 | LYPLAL1 | LZE20T | Human | Esophagus | ESCC | 2.95e-08 | 1.44e-01 | 0.0662 |
| 127018 | LYPLAL1 | LZE22T | Human | Esophagus | ESCC | 2.17e-04 | 3.66e-01 | 0.068 |
| 127018 | LYPLAL1 | LZE24T | Human | Esophagus | ESCC | 3.31e-22 | 5.07e-01 | 0.0596 |
| 127018 | LYPLAL1 | LZE21T | Human | Esophagus | ESCC | 5.36e-07 | 3.54e-01 | 0.0655 |
| 127018 | LYPLAL1 | LZE6T | Human | Esophagus | ESCC | 1.41e-06 | 2.65e-01 | 0.0845 |
| 127018 | LYPLAL1 | P1T-E | Human | Esophagus | ESCC | 3.89e-14 | 3.56e-01 | 0.0875 |
| 127018 | LYPLAL1 | P2T-E | Human | Esophagus | ESCC | 3.73e-29 | 6.14e-01 | 0.1177 |
| 127018 | LYPLAL1 | P4T-E | Human | Esophagus | ESCC | 2.97e-21 | 4.59e-01 | 0.1323 |
| 127018 | LYPLAL1 | P5T-E | Human | Esophagus | ESCC | 3.40e-41 | 8.23e-01 | 0.1327 |
| 127018 | LYPLAL1 | P8T-E | Human | Esophagus | ESCC | 3.56e-26 | 4.72e-01 | 0.0889 |
| 127018 | LYPLAL1 | P9T-E | Human | Esophagus | ESCC | 1.97e-23 | 4.51e-01 | 0.1131 |
| 127018 | LYPLAL1 | P11T-E | Human | Esophagus | ESCC | 4.72e-21 | 7.52e-01 | 0.1426 |
| 127018 | LYPLAL1 | P12T-E | Human | Esophagus | ESCC | 2.54e-33 | 6.14e-01 | 0.1122 |
| 127018 | LYPLAL1 | P15T-E | Human | Esophagus | ESCC | 4.69e-26 | 4.82e-01 | 0.1149 |
| 127018 | LYPLAL1 | P16T-E | Human | Esophagus | ESCC | 2.11e-35 | 6.79e-01 | 0.1153 |
| 127018 | LYPLAL1 | P17T-E | Human | Esophagus | ESCC | 9.59e-13 | 2.98e-01 | 0.1278 |
| Page: 1 2 3 4 5 6 |
| Tissue | Expression Dynamics | Abbreviation |
| Esophagus | 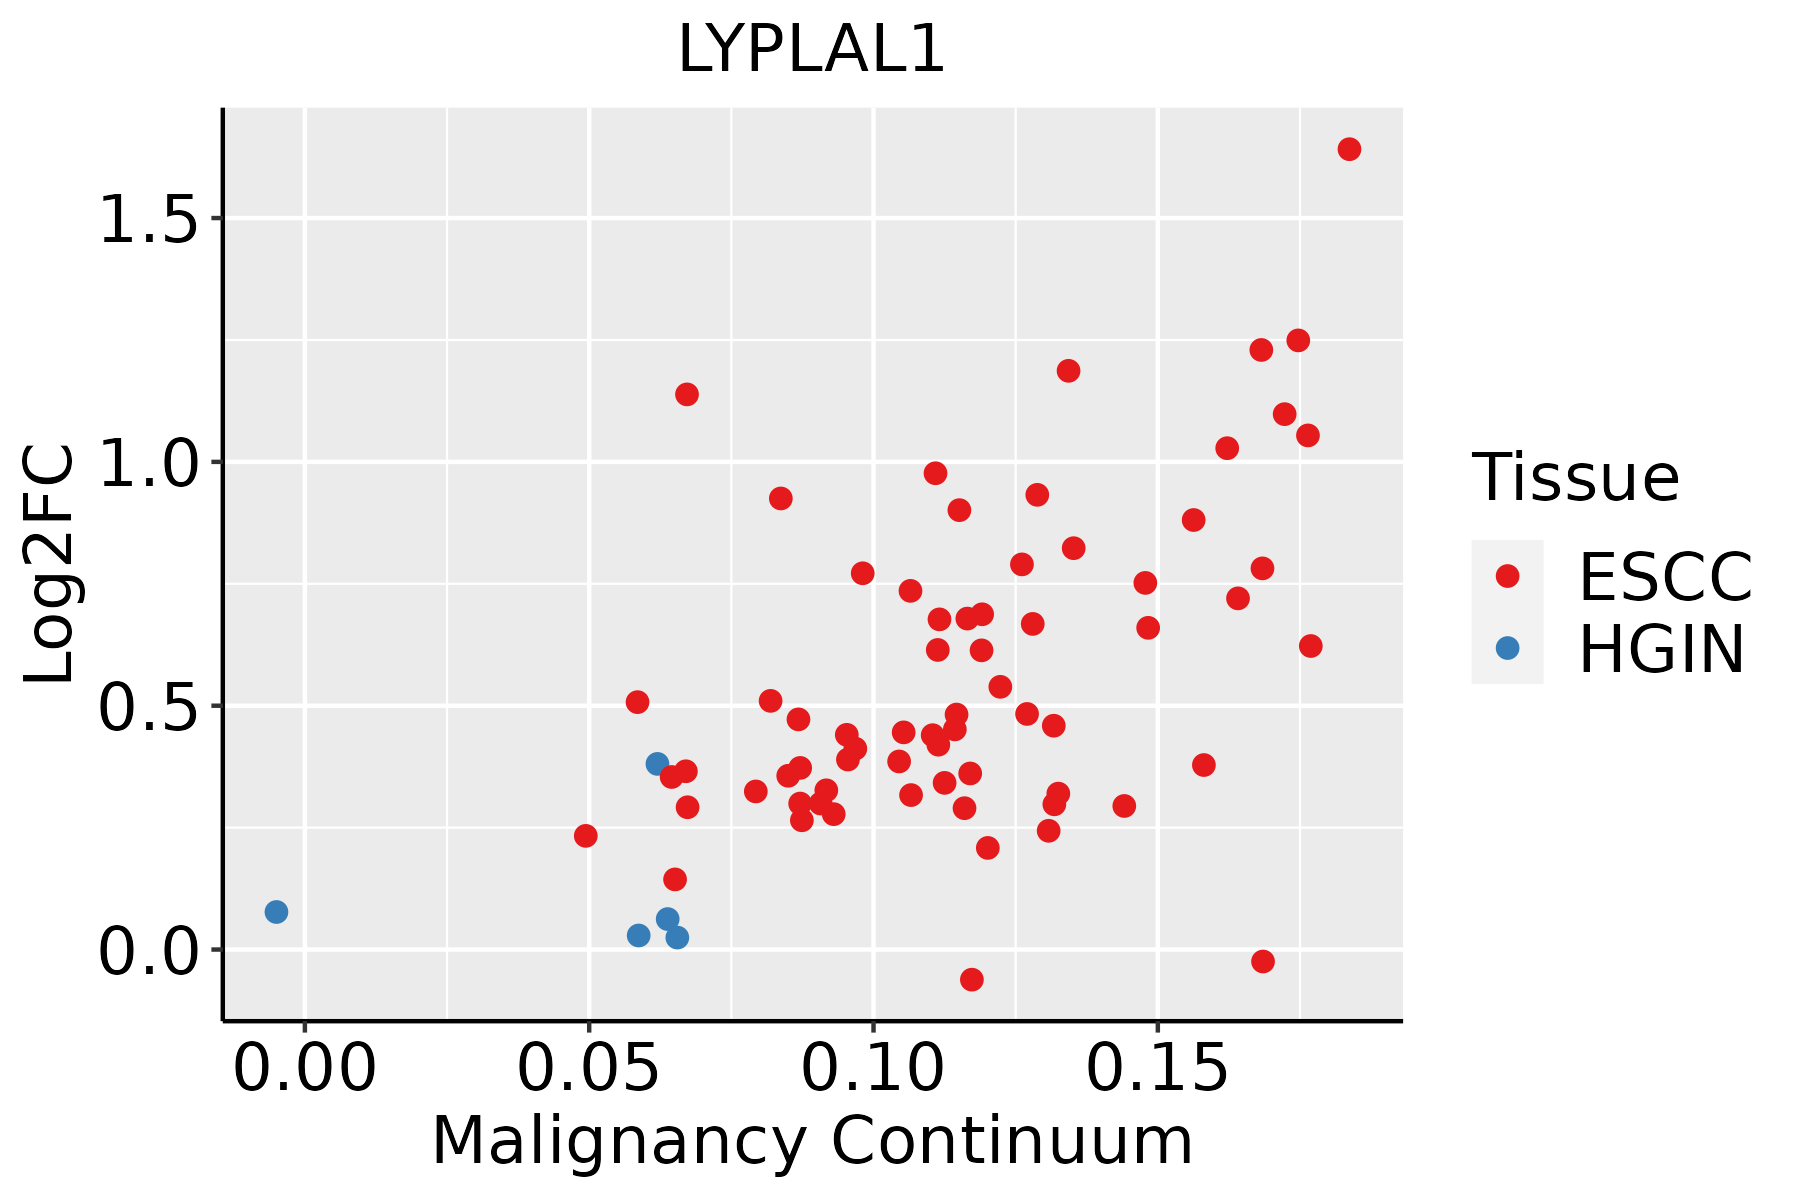 | ESCC: Esophageal squamous cell carcinoma |
| HGIN: High-grade intraepithelial neoplasias | ||
| LGIN: Low-grade intraepithelial neoplasias | ||
| Liver |  | HCC: Hepatocellular carcinoma |
| NAFLD: Non-alcoholic fatty liver disease | ||
| Oral Cavity | 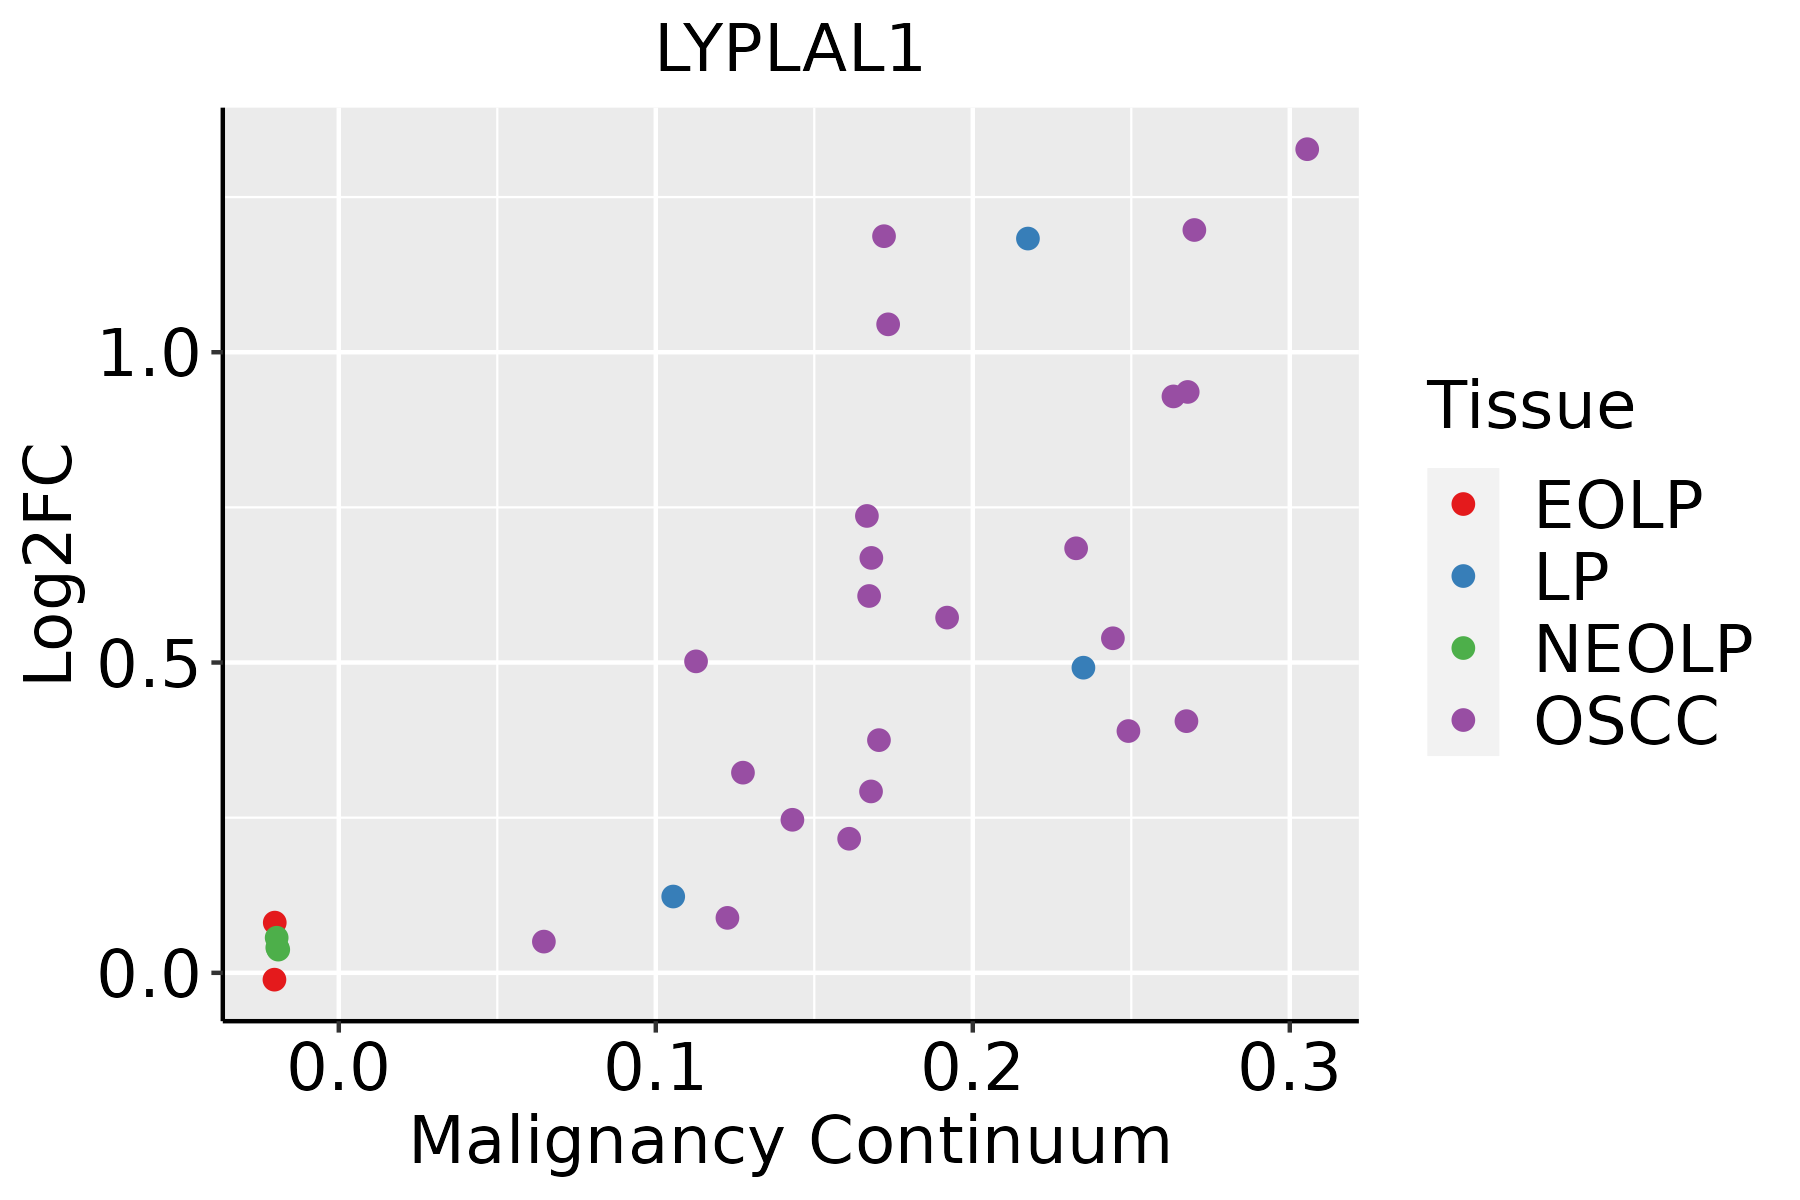 | EOLP: Erosive Oral lichen planus |
| LP: leukoplakia | ||
| NEOLP: Non-erosive oral lichen planus | ||
| OSCC: Oral squamous cell carcinoma | ||
| Prostate |  | BPH: Benign Prostatic Hyperplasia |
| Skin | 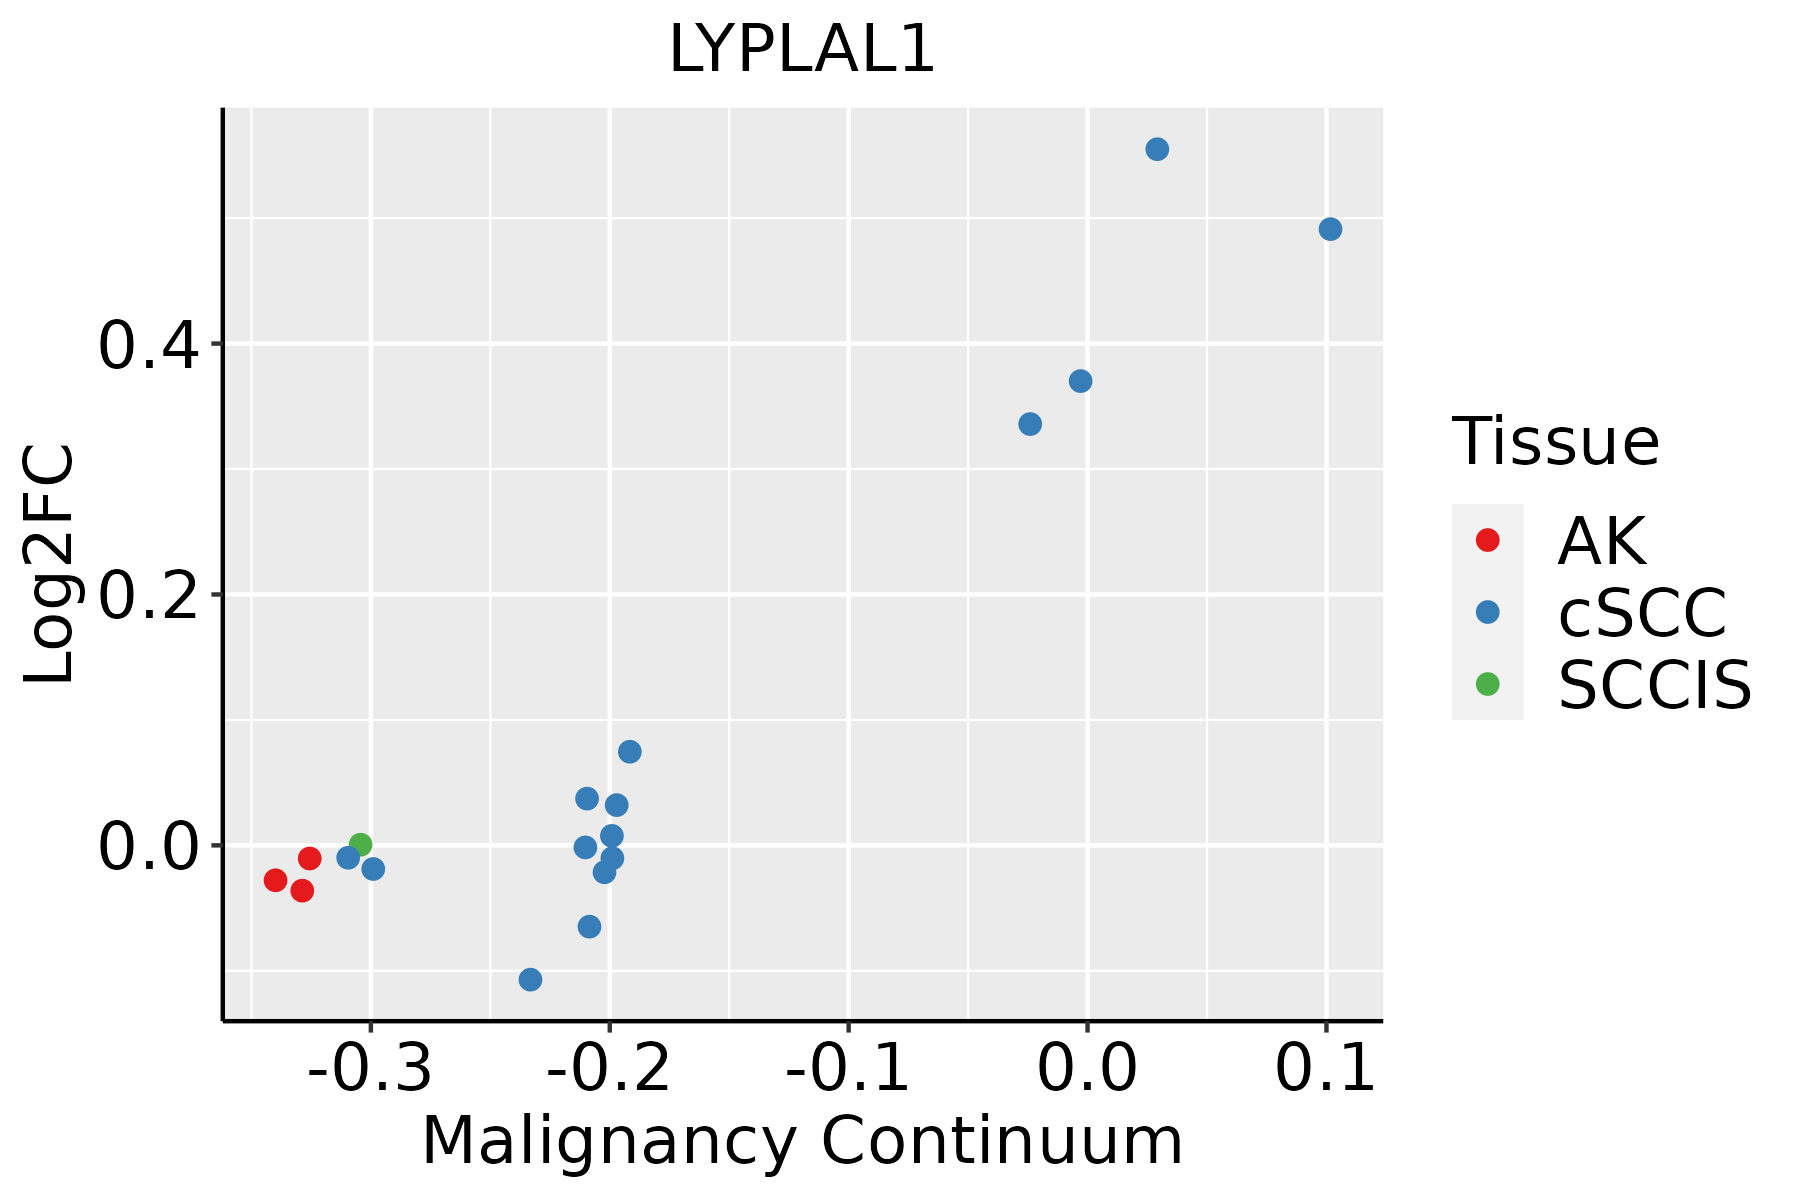 | AK: Actinic keratosis |
| cSCC: Cutaneous squamous cell carcinoma | ||
| SCCIS:squamous cell carcinoma in situ |
| ∗log2FC in expression of this searched gene in stem-like cells from each diseased tissue sample relative to stem-like cells in normal samples in each tissue plotted against the malignancy continuum. Samples are colored based on if they are from different disease stage. |
Top |
Malignant transformation related pathway analysis |
| Find out the enriched GO biological processes and KEGG pathways involved in transition from healthy to precancer to cancer |
| Tissue | Disease Stage | Enriched GO biological Processes |
| Colorectum | AD |  |
| Colorectum | SER |  |
| Colorectum | MSS |  |
| Colorectum | MSI-H |  |
| Colorectum | FAP |  |
| ∗Top 15 enriched GO BP terms are showed in the bar plot of each disease state in each tissue. Each row represents a significant GO biological process which is colored according to the -log10(p.adjust). |
| Page: 1 2 3 4 5 6 7 8 9 |
| GO ID | Tissue | Disease Stage | Description | Gene Ratio | Bg Ratio | pvalue | p.adjust | Count |
| GO:00356015 | Esophagus | ESCC | protein deacylation | 79/8552 | 112/18723 | 8.30e-08 | 1.42e-06 | 79 |
| GO:00987325 | Esophagus | ESCC | macromolecule deacylation | 80/8552 | 116/18723 | 3.19e-07 | 4.50e-06 | 80 |
| GO:00421573 | Esophagus | ESCC | lipoprotein metabolic process | 86/8552 | 135/18723 | 1.78e-05 | 1.57e-04 | 86 |
| GO:00020842 | Esophagus | ESCC | protein depalmitoylation | 9/8552 | 10/18723 | 5.09e-03 | 1.92e-02 | 9 |
| GO:00421593 | Esophagus | ESCC | lipoprotein catabolic process | 12/8552 | 15/18723 | 7.31e-03 | 2.63e-02 | 12 |
| GO:0042157 | Liver | Cirrhotic | lipoprotein metabolic process | 53/4634 | 135/18723 | 1.32e-04 | 1.29e-03 | 53 |
| GO:0035601 | Liver | Cirrhotic | protein deacylation | 39/4634 | 112/18723 | 1.08e-02 | 4.75e-02 | 39 |
| GO:00421571 | Liver | HCC | lipoprotein metabolic process | 86/7958 | 135/18723 | 5.21e-07 | 8.38e-06 | 86 |
| GO:0042159 | Liver | HCC | lipoprotein catabolic process | 13/7958 | 15/18723 | 5.67e-04 | 3.61e-03 | 13 |
| GO:0098732 | Liver | HCC | macromolecule deacylation | 67/7958 | 116/18723 | 6.46e-04 | 3.99e-03 | 67 |
| GO:00356011 | Liver | HCC | protein deacylation | 64/7958 | 112/18723 | 1.23e-03 | 6.83e-03 | 64 |
| GO:0098734 | Liver | HCC | macromolecule depalmitoylation | 11/7958 | 14/18723 | 6.81e-03 | 2.73e-02 | 11 |
| GO:00356014 | Oral cavity | OSCC | protein deacylation | 74/7305 | 112/18723 | 5.88e-09 | 1.26e-07 | 74 |
| GO:00987324 | Oral cavity | OSCC | macromolecule deacylation | 74/7305 | 116/18723 | 5.52e-08 | 1.01e-06 | 74 |
| GO:00421572 | Oral cavity | OSCC | lipoprotein metabolic process | 77/7305 | 135/18723 | 1.61e-05 | 1.60e-04 | 77 |
| GO:00421592 | Oral cavity | OSCC | lipoprotein catabolic process | 11/7305 | 15/18723 | 7.49e-03 | 2.75e-02 | 11 |
| GO:0002084 | Oral cavity | OSCC | protein depalmitoylation | 8/7305 | 10/18723 | 1.03e-02 | 3.53e-02 | 8 |
| GO:004215711 | Oral cavity | LP | lipoprotein metabolic process | 57/4623 | 135/18723 | 5.59e-06 | 1.11e-04 | 57 |
| GO:003560113 | Oral cavity | LP | protein deacylation | 48/4623 | 112/18723 | 1.85e-05 | 3.14e-04 | 48 |
| GO:009873212 | Oral cavity | LP | macromolecule deacylation | 48/4623 | 116/18723 | 5.51e-05 | 7.58e-04 | 48 |
| Page: 1 2 |
| Pathway ID | Tissue | Disease Stage | Description | Gene Ratio | Bg Ratio | pvalue | p.adjust | qvalue | Count |
| Page: 1 |
Top |
Cell-cell communication analysis |
| Identification of potential cell-cell interactions between two cell types and their ligand-receptor pairs for different disease states |
| Ligand | Receptor | LRpair | Pathway | Tissue | Disease Stage |
| Page: 1 |
Top |
Single-cell gene regulatory network inference analysis |
| Find out the significant the regulons (TFs) and the target genes of each regulon across cell types for different disease states |
| TF | Cell Type | Tissue | Disease Stage | Target Gene | RSS | Regulon Activity |
| ∗The dot plots of a searched regulon are shown for all cell subpopulations in each disease state of each tissue based on the regulon specific score inferred using pySCENIC and by calculating the average expression. |
| Page: 1 |
Top |
Somatic mutation of malignant transformation related genes |
| Annotation of somatic variants for genes involved in malignant transformation |
| Hugo Symbol | Variant Class | Variant Classification | dbSNP RS | HGVSc | HGVSp | HGVSp Short | SWISSPROT | BIOTYPE | SIFT | PolyPhen | Tumor Sample Barcode | Tissue | Histology | Sex | Age | Stage | Therapy Types | Drugs | Outcome |
| LYPLAL1 | SNV | Missense_Mutation | c.688N>T | p.Pro230Ser | p.P230S | Q5VWZ2 | protein_coding | deleterious(0) | probably_damaging(0.964) | TCGA-A8-A09Z-01 | Breast | breast invasive carcinoma | Female | >=65 | I/II | Unknown | Unknown | SD | |
| LYPLAL1 | SNV | Missense_Mutation | novel | c.101G>T | p.Gly34Val | p.G34V | Q5VWZ2 | protein_coding | deleterious(0) | probably_damaging(0.999) | TCGA-AC-A3W6-01 | Breast | breast invasive carcinoma | Female | >=65 | III/IV | Unknown | Unknown | SD |
| LYPLAL1 | SNV | Missense_Mutation | novel | c.8N>A | p.Ala3Asp | p.A3D | Q5VWZ2 | protein_coding | deleterious_low_confidence(0.01) | benign(0.247) | TCGA-E9-A295-01 | Breast | breast invasive carcinoma | Female | >=65 | I/II | Hormone Therapy | tamoxiphen | SD |
| LYPLAL1 | SNV | Missense_Mutation | c.61A>T | p.Ser21Cys | p.S21C | Q5VWZ2 | protein_coding | deleterious(0) | possibly_damaging(0.853) | TCGA-C5-A3HD-01 | Cervix | cervical & endocervical cancer | Female | <65 | I/II | Chemotherapy | cisplatin | SD | |
| LYPLAL1 | SNV | Missense_Mutation | c.4N>A | p.Ala2Thr | p.A2T | Q5VWZ2 | protein_coding | deleterious_low_confidence(0.01) | benign(0.166) | TCGA-EA-A411-01 | Cervix | cervical & endocervical cancer | Female | <65 | I/II | Unknown | Unknown | SD | |
| LYPLAL1 | SNV | Missense_Mutation | novel | c.260G>T | p.Cys87Phe | p.C87F | Q5VWZ2 | protein_coding | deleterious(0) | benign(0.216) | TCGA-IR-A3LK-01 | Cervix | cervical & endocervical cancer | Female | >=65 | I/II | Chemotherapy | cisplatin | PD |
| LYPLAL1 | SNV | Missense_Mutation | c.65N>A | p.Ala22Asp | p.A22D | Q5VWZ2 | protein_coding | deleterious(0.01) | possibly_damaging(0.534) | TCGA-A6-6651-01 | Colorectum | colon adenocarcinoma | Female | <65 | III/IV | Ancillary | leucovorin | SD | |
| LYPLAL1 | SNV | Missense_Mutation | c.167N>C | p.Ile56Thr | p.I56T | Q5VWZ2 | protein_coding | deleterious(0.04) | possibly_damaging(0.449) | TCGA-AG-A026-01 | Colorectum | rectum adenocarcinoma | Male | >=65 | I/II | Unknown | Unknown | PD | |
| LYPLAL1 | SNV | Missense_Mutation | novel | c.467N>A | p.Ala156Asp | p.A156D | Q5VWZ2 | protein_coding | tolerated(0.13) | possibly_damaging(0.737) | TCGA-A5-A0G2-01 | Endometrium | uterine corpus endometrioid carcinoma | Female | <65 | III/IV | Unknown | Unknown | SD |
| LYPLAL1 | SNV | Missense_Mutation | novel | c.547N>A | p.Leu183Ile | p.L183I | Q5VWZ2 | protein_coding | tolerated(0.42) | benign(0.164) | TCGA-A5-A2K5-01 | Endometrium | uterine corpus endometrioid carcinoma | Female | >=65 | I/II | Unknown | Unknown | SD |
| Page: 1 2 3 |
Top |
Related drugs of malignant transformation related genes |
| Identification of chemicals and drugs interact with genes involved in malignant transfromation |
| (DGIdb 4.0) |
| Entrez ID | Symbol | Category | Interaction Types | Drug Claim Name | Drug Name | PMIDs |
| Page: 1 |

Copyright 2023-Present -The University of Texas Health Science Center at Houston |