
|
|||||
|
 | |
| |
| |
| |
| |
| |
|
Gene: LYPLA2 |
Gene summary for LYPLA2 |
| Gene information | Species | Human | Gene symbol | LYPLA2 | Gene ID | 11313 |
| Gene name | lysophospholipase 2 | |
| Gene Alias | APT-2 | |
| Cytomap | 1p36.11 | |
| Gene Type | protein-coding | GO ID | GO:0000902 | UniProtAcc | A0A140VJC9 |
Top |
Malignant transformation analysis |
| Identification of the aberrant gene expression in precancerous and cancerous lesions by comparing the gene expression of stem-like cells in diseased tissues with normal stem cells |
| Entrez ID | Symbol | Replicates | Species | Organ | Tissue | Adj P-value | Log2FC | Malignancy |
| 11313 | LYPLA2 | HTA11_3410_2000001011 | Human | Colorectum | AD | 8.65e-14 | 4.02e-01 | 0.0155 |
| 11313 | LYPLA2 | HTA11_2487_2000001011 | Human | Colorectum | SER | 1.01e-25 | 8.49e-01 | -0.1808 |
| 11313 | LYPLA2 | HTA11_2951_2000001011 | Human | Colorectum | AD | 1.83e-04 | 4.36e-01 | 0.0216 |
| 11313 | LYPLA2 | HTA11_1938_2000001011 | Human | Colorectum | AD | 8.54e-24 | 8.53e-01 | -0.0811 |
| 11313 | LYPLA2 | HTA11_78_2000001011 | Human | Colorectum | AD | 3.82e-05 | 3.02e-01 | -0.1088 |
| 11313 | LYPLA2 | HTA11_347_2000001011 | Human | Colorectum | AD | 6.11e-30 | 6.92e-01 | -0.1954 |
| 11313 | LYPLA2 | HTA11_411_2000001011 | Human | Colorectum | SER | 4.28e-10 | 1.23e+00 | -0.2602 |
| 11313 | LYPLA2 | HTA11_2112_2000001011 | Human | Colorectum | SER | 1.56e-12 | 1.04e+00 | -0.2196 |
| 11313 | LYPLA2 | HTA11_3361_2000001011 | Human | Colorectum | AD | 4.78e-14 | 6.34e-01 | -0.1207 |
| 11313 | LYPLA2 | HTA11_83_2000001011 | Human | Colorectum | SER | 5.67e-17 | 8.22e-01 | -0.1526 |
| 11313 | LYPLA2 | HTA11_696_2000001011 | Human | Colorectum | AD | 5.86e-50 | 8.60e-01 | -0.1464 |
| 11313 | LYPLA2 | HTA11_866_2000001011 | Human | Colorectum | AD | 9.91e-19 | 4.26e-01 | -0.1001 |
| 11313 | LYPLA2 | HTA11_1391_2000001011 | Human | Colorectum | AD | 9.45e-39 | 9.08e-01 | -0.059 |
| 11313 | LYPLA2 | HTA11_2992_2000001011 | Human | Colorectum | SER | 1.80e-18 | 1.03e+00 | -0.1706 |
| 11313 | LYPLA2 | HTA11_5212_2000001011 | Human | Colorectum | AD | 1.75e-17 | 8.77e-01 | -0.2061 |
| 11313 | LYPLA2 | HTA11_5216_2000001011 | Human | Colorectum | SER | 4.01e-06 | 5.55e-01 | -0.1462 |
| 11313 | LYPLA2 | HTA11_546_2000001011 | Human | Colorectum | AD | 2.63e-06 | 4.76e-01 | -0.0842 |
| 11313 | LYPLA2 | HTA11_7862_2000001011 | Human | Colorectum | AD | 3.05e-02 | 3.58e-01 | -0.0179 |
| 11313 | LYPLA2 | HTA11_866_3004761011 | Human | Colorectum | AD | 1.14e-21 | 5.64e-01 | 0.096 |
| 11313 | LYPLA2 | HTA11_4255_2000001011 | Human | Colorectum | SER | 4.92e-08 | 6.44e-01 | 0.0446 |
| Page: 1 2 3 4 5 6 7 8 |
| Tissue | Expression Dynamics | Abbreviation |
| Colorectum (GSE201348) |  | FAP: Familial adenomatous polyposis |
| CRC: Colorectal cancer | ||
| Colorectum (HTA11) |  | AD: Adenomas |
| SER: Sessile serrated lesions | ||
| MSI-H: Microsatellite-high colorectal cancer | ||
| MSS: Microsatellite stable colorectal cancer | ||
| Esophagus | 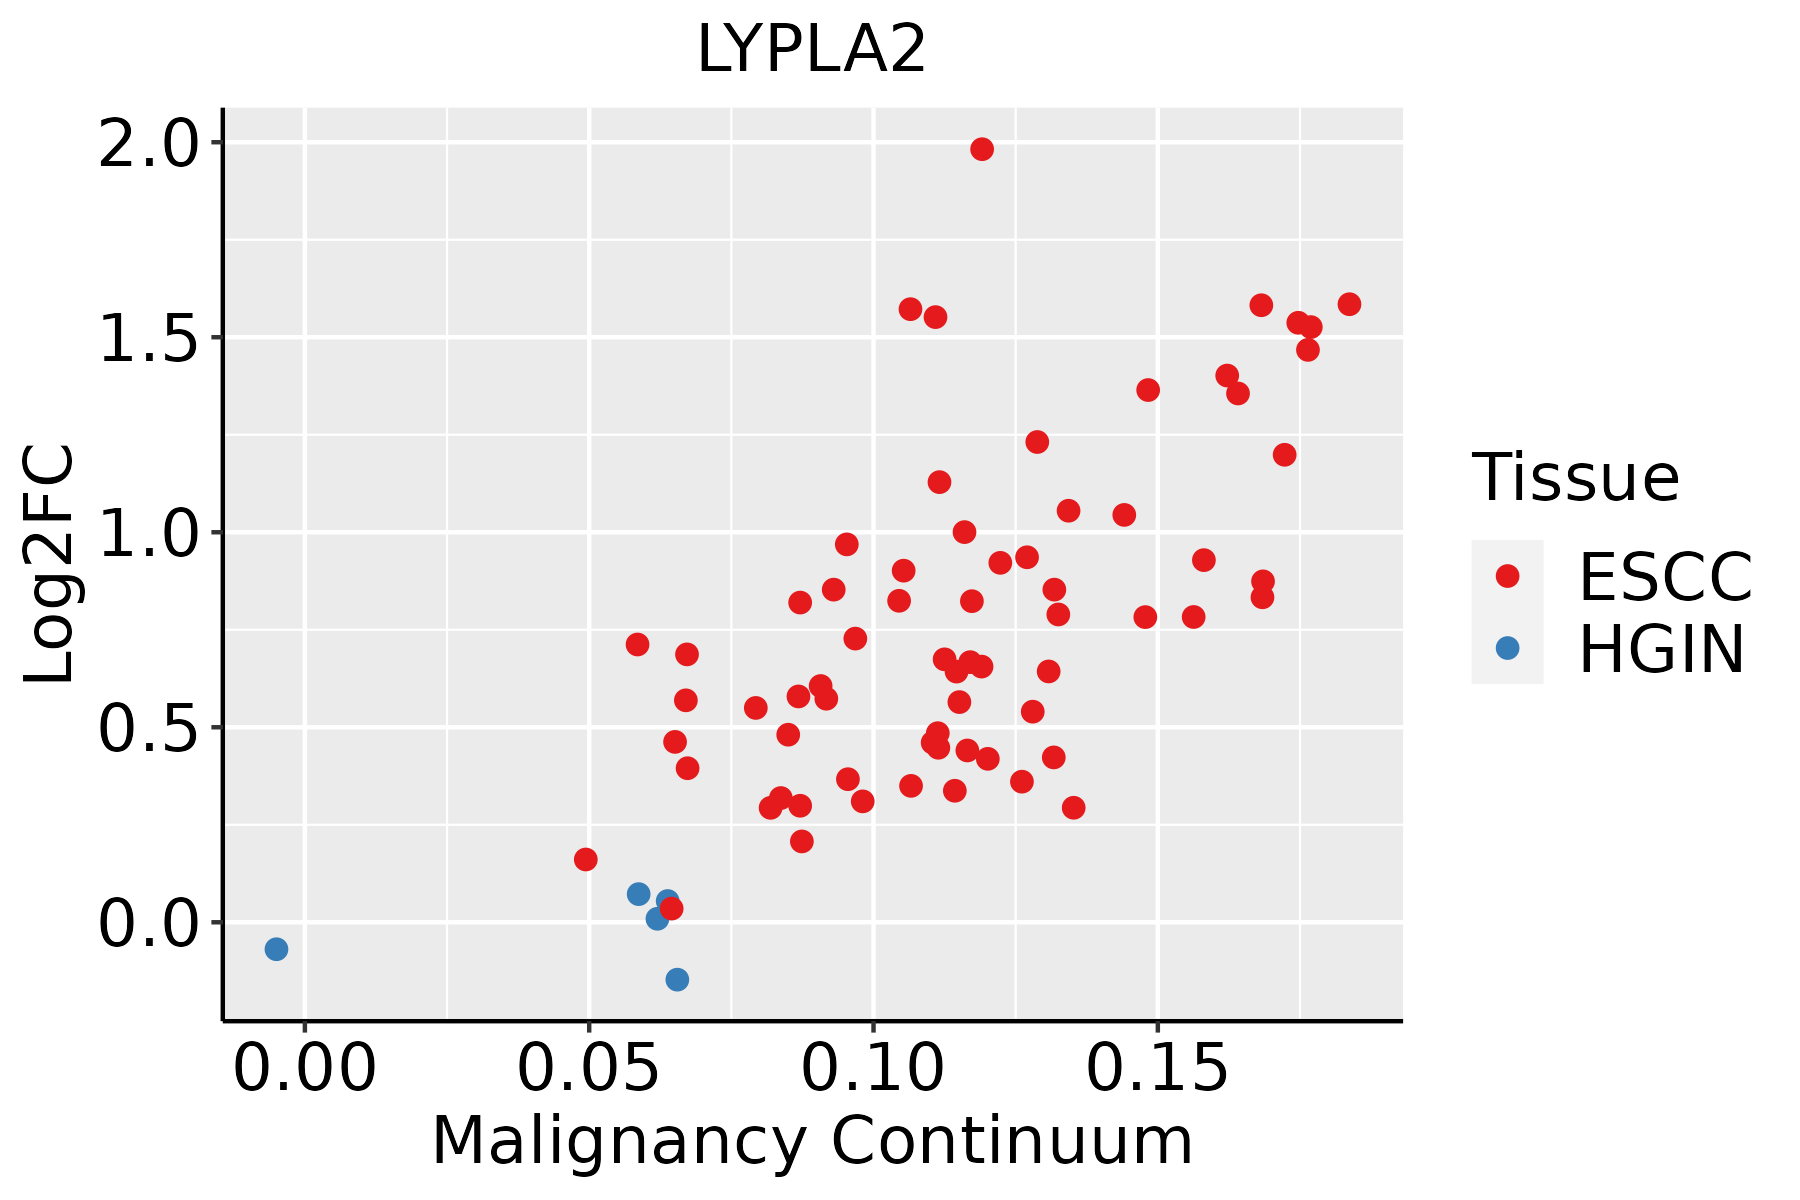 | ESCC: Esophageal squamous cell carcinoma |
| HGIN: High-grade intraepithelial neoplasias | ||
| LGIN: Low-grade intraepithelial neoplasias | ||
| Liver | 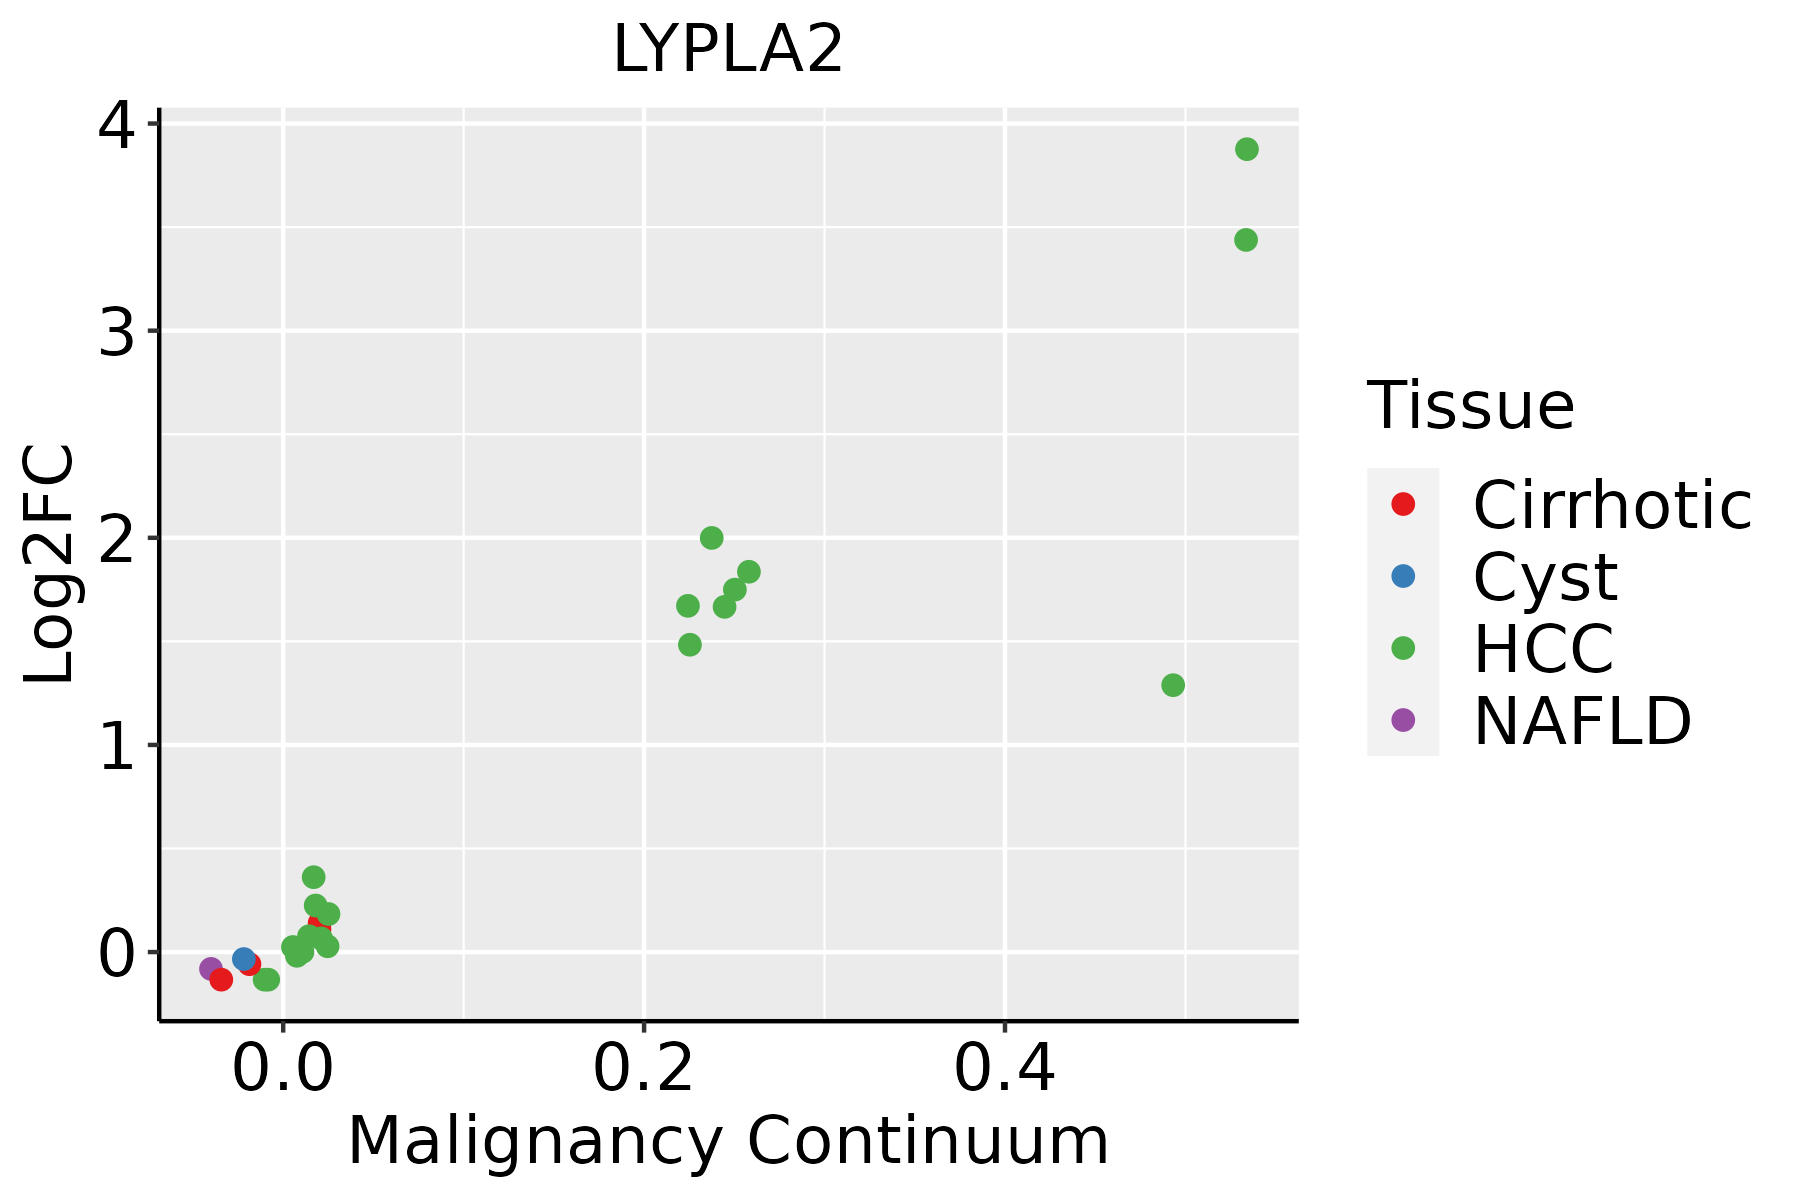 | HCC: Hepatocellular carcinoma |
| NAFLD: Non-alcoholic fatty liver disease | ||
| Oral Cavity | 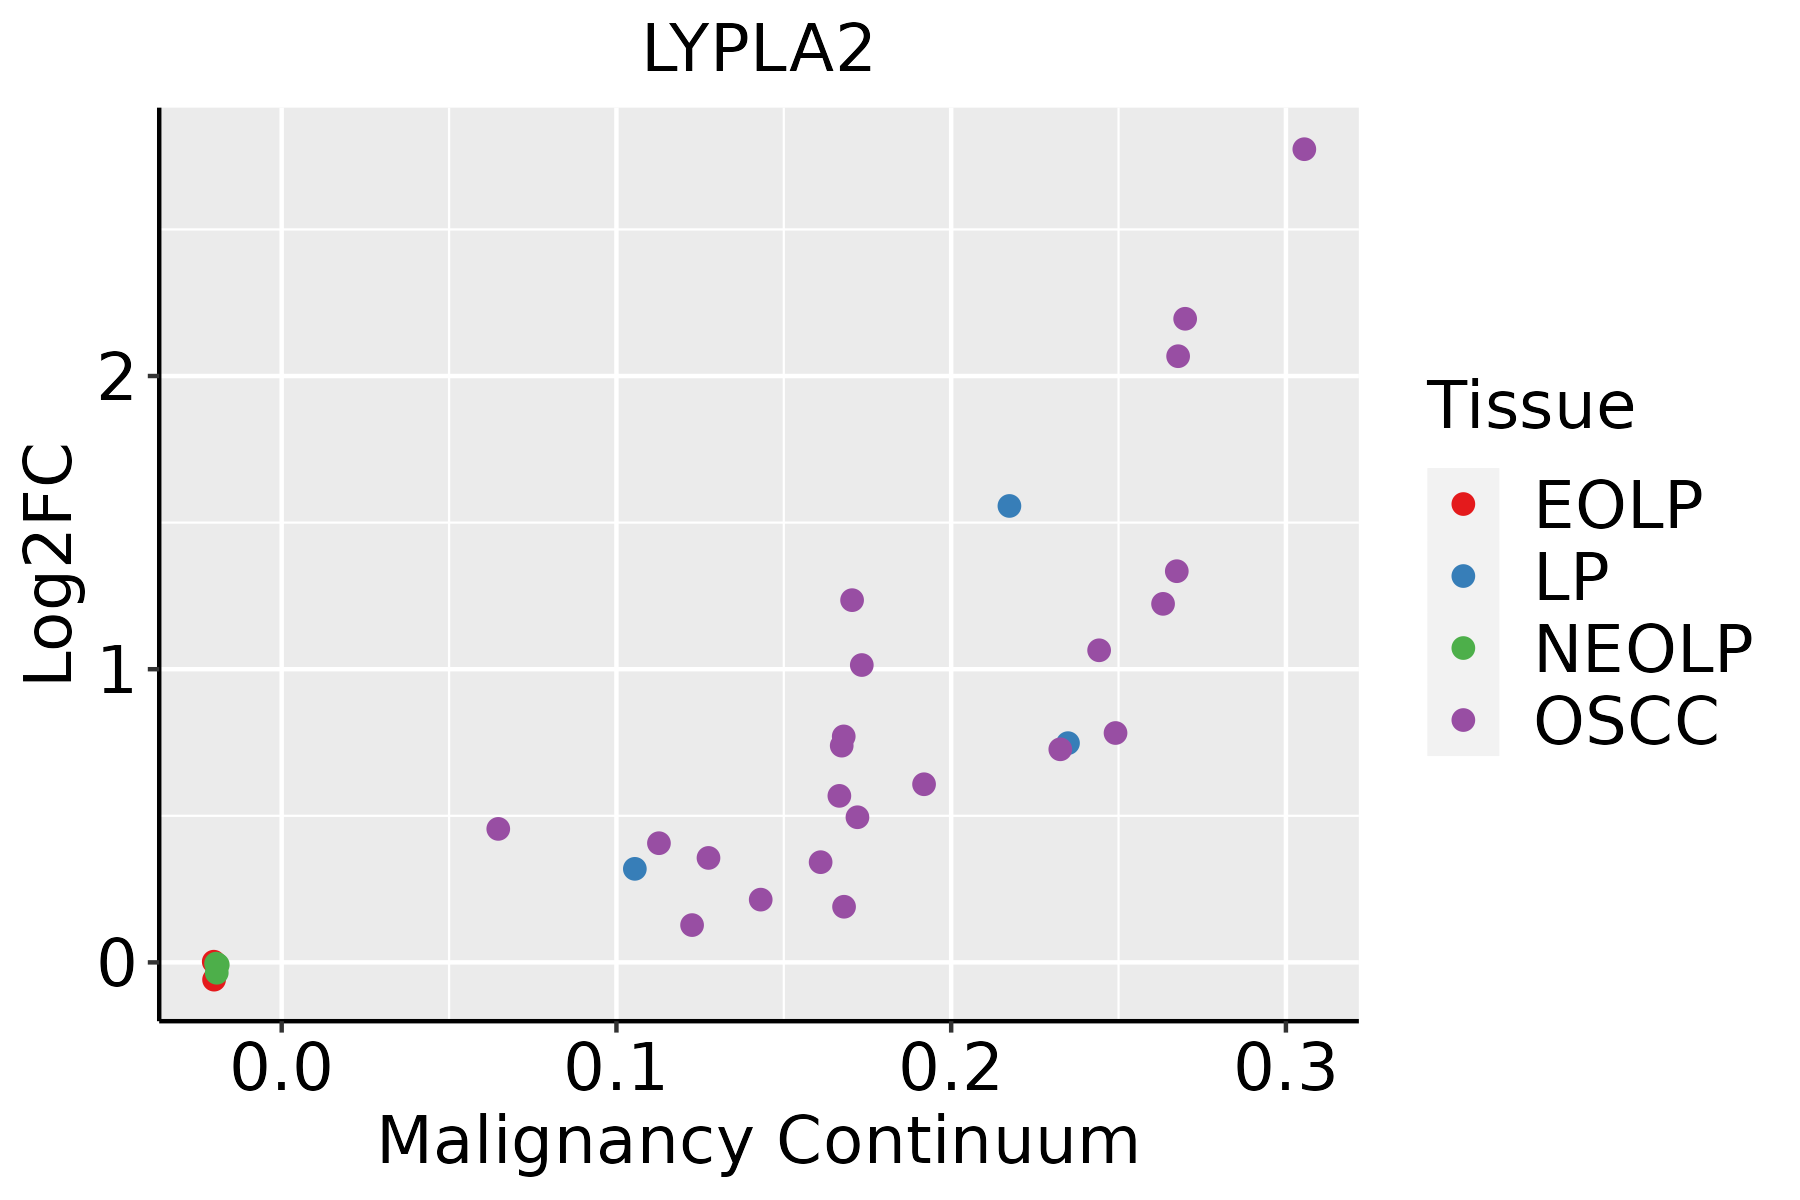 | EOLP: Erosive Oral lichen planus |
| LP: leukoplakia | ||
| NEOLP: Non-erosive oral lichen planus | ||
| OSCC: Oral squamous cell carcinoma | ||
| Skin | 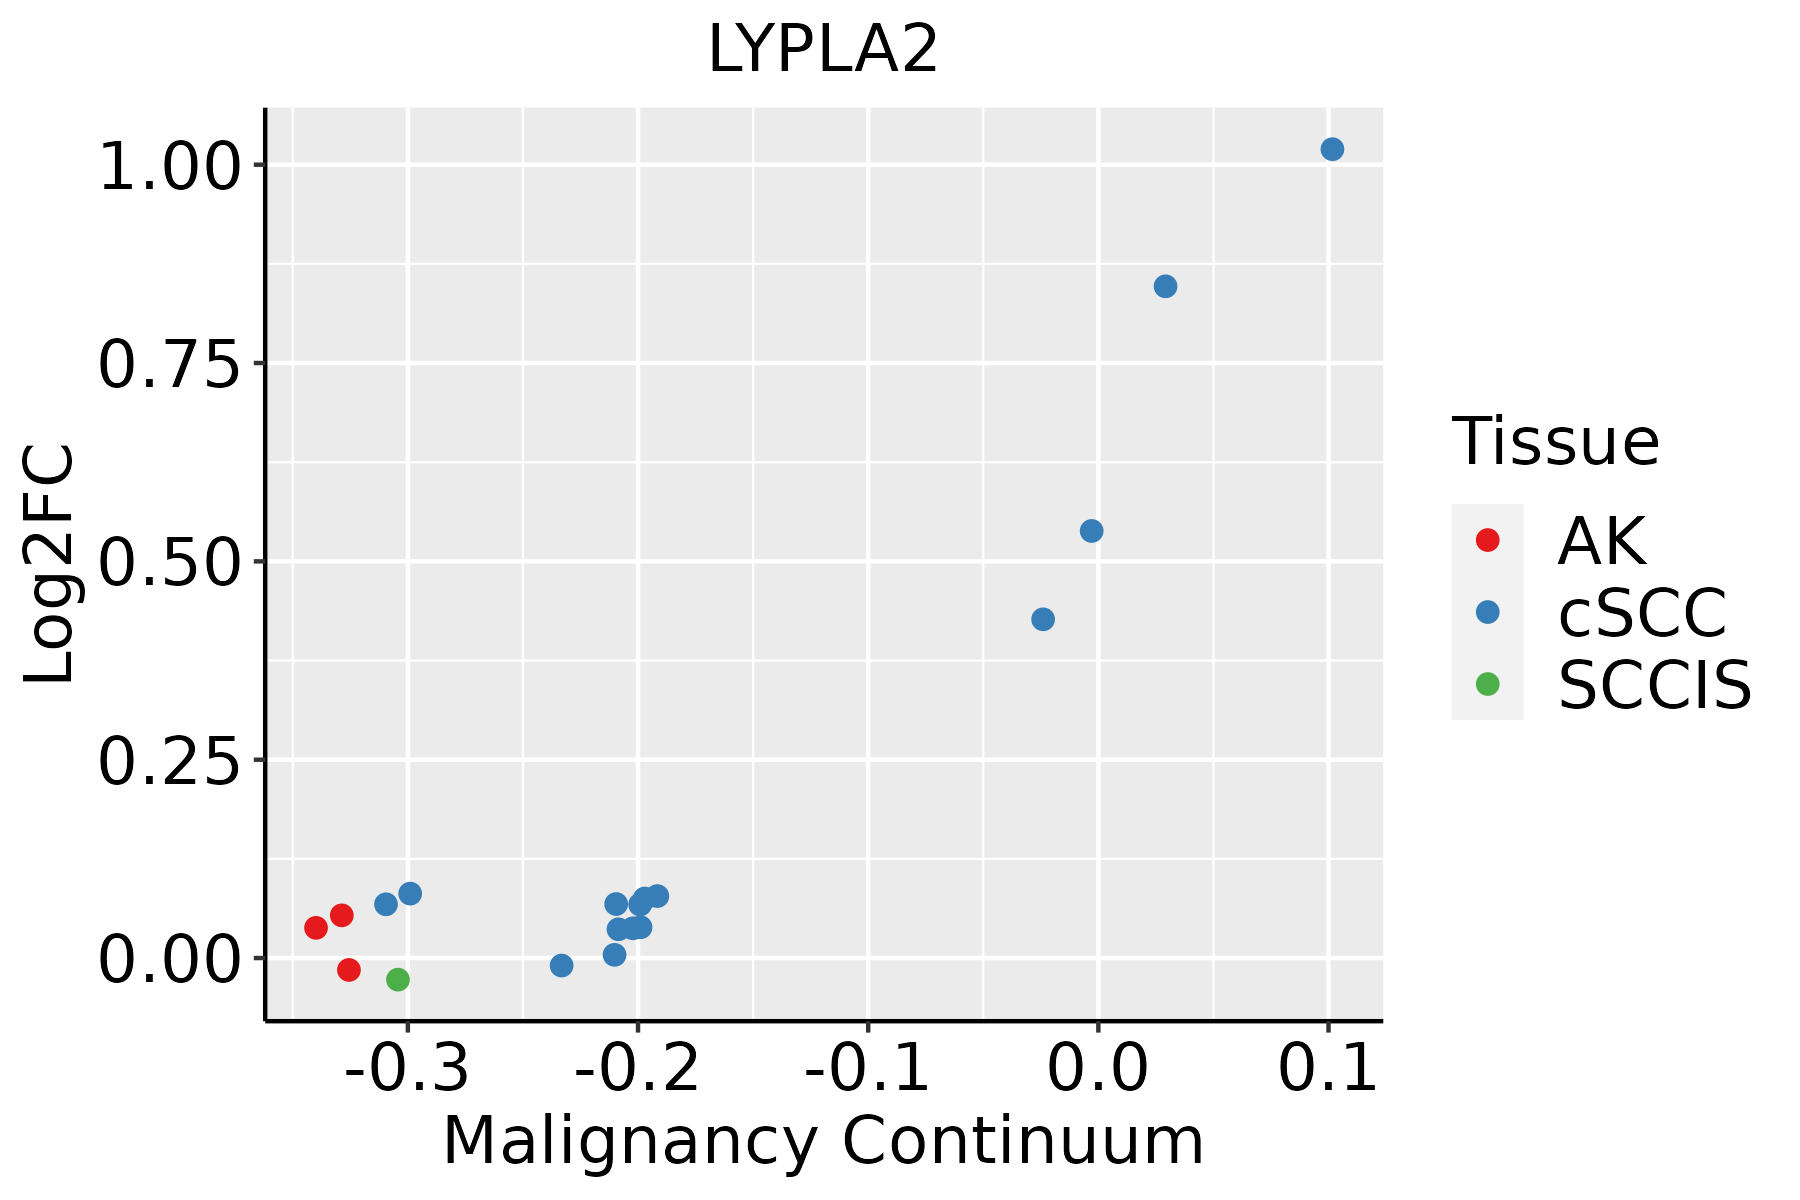 | AK: Actinic keratosis |
| cSCC: Cutaneous squamous cell carcinoma | ||
| SCCIS:squamous cell carcinoma in situ | ||
| Thyroid | 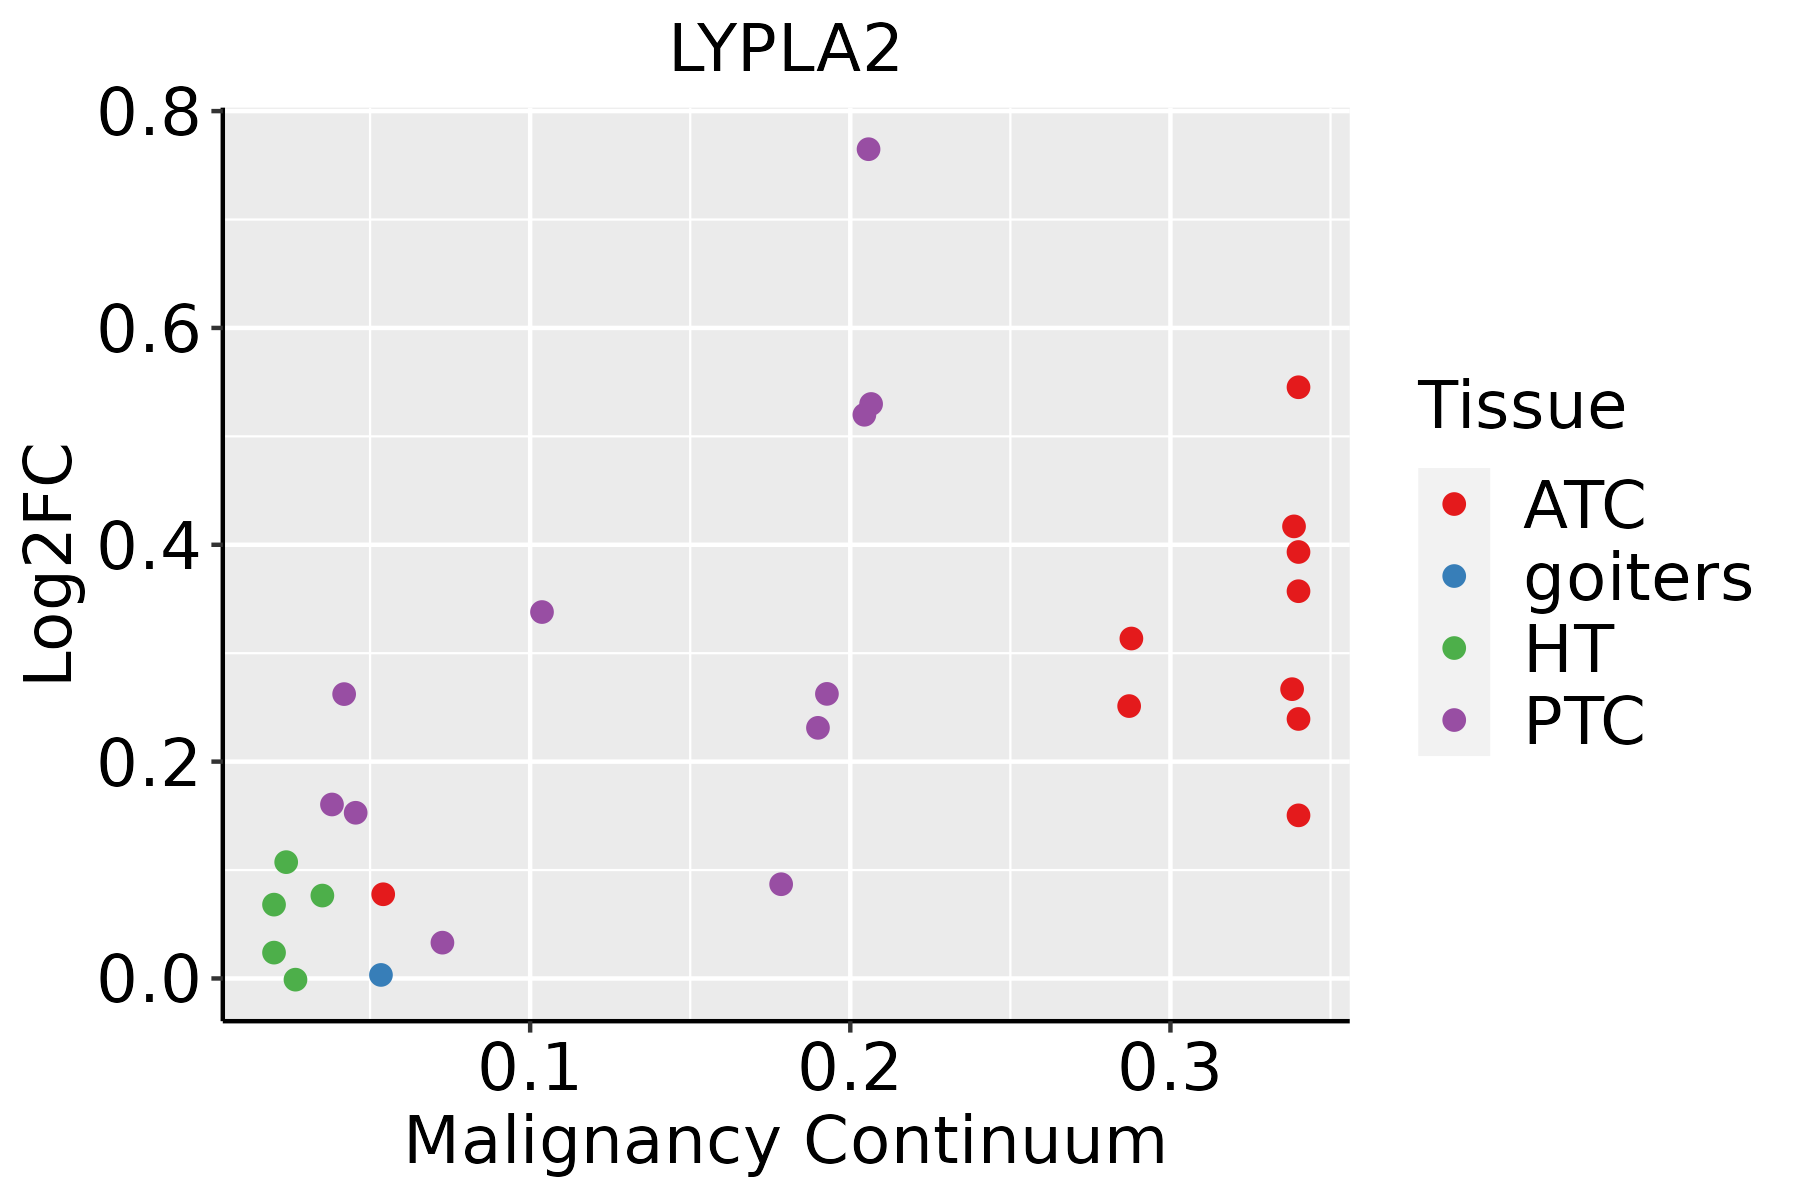 | ATC: Anaplastic thyroid cancer |
| HT: Hashimoto's thyroiditis | ||
| PTC: Papillary thyroid cancer |
| ∗log2FC in expression of this searched gene in stem-like cells from each diseased tissue sample relative to stem-like cells in normal samples in each tissue plotted against the malignancy continuum. Samples are colored based on if they are from different disease stage. |
Top |
Malignant transformation related pathway analysis |
| Find out the enriched GO biological processes and KEGG pathways involved in transition from healthy to precancer to cancer |
| Tissue | Disease Stage | Enriched GO biological Processes |
| Colorectum | AD |  |
| Colorectum | SER |  |
| Colorectum | MSS |  |
| Colorectum | MSI-H |  |
| Colorectum | FAP |  |
| ∗Top 15 enriched GO BP terms are showed in the bar plot of each disease state in each tissue. Each row represents a significant GO biological process which is colored according to the -log10(p.adjust). |
| Page: 1 2 3 4 5 6 7 8 9 |
| GO ID | Tissue | Disease Stage | Description | Gene Ratio | Bg Ratio | pvalue | p.adjust | Count |
| GO:0007409 | Colorectum | AD | axonogenesis | 122/3918 | 418/18723 | 3.36e-05 | 6.15e-04 | 122 |
| GO:0016042 | Colorectum | AD | lipid catabolic process | 97/3918 | 320/18723 | 4.31e-05 | 7.56e-04 | 97 |
| GO:0006631 | Colorectum | AD | fatty acid metabolic process | 114/3918 | 390/18723 | 5.58e-05 | 9.44e-04 | 114 |
| GO:0061564 | Colorectum | AD | axon development | 132/3918 | 467/18723 | 8.40e-05 | 1.31e-03 | 132 |
| GO:0044242 | Colorectum | AD | cellular lipid catabolic process | 66/3918 | 214/18723 | 3.96e-04 | 4.50e-03 | 66 |
| GO:0007411 | Colorectum | AD | axon guidance | 64/3918 | 227/18723 | 5.41e-03 | 3.55e-02 | 64 |
| GO:0097485 | Colorectum | AD | neuron projection guidance | 64/3918 | 228/18723 | 6.02e-03 | 3.78e-02 | 64 |
| GO:00160421 | Colorectum | SER | lipid catabolic process | 77/2897 | 320/18723 | 3.52e-05 | 9.18e-04 | 77 |
| GO:00442421 | Colorectum | SER | cellular lipid catabolic process | 51/2897 | 214/18723 | 8.60e-04 | 1.05e-02 | 51 |
| GO:0046486 | Colorectum | SER | glycerolipid metabolic process | 82/2897 | 392/18723 | 2.26e-03 | 2.17e-02 | 82 |
| GO:00074111 | Colorectum | SER | axon guidance | 51/2897 | 227/18723 | 3.29e-03 | 2.82e-02 | 51 |
| GO:00974851 | Colorectum | SER | neuron projection guidance | 51/2897 | 228/18723 | 3.61e-03 | 3.03e-02 | 51 |
| GO:00615641 | Colorectum | SER | axon development | 94/2897 | 467/18723 | 3.78e-03 | 3.13e-02 | 94 |
| GO:00074091 | Colorectum | SER | axonogenesis | 84/2897 | 418/18723 | 6.20e-03 | 4.49e-02 | 84 |
| GO:00066311 | Colorectum | SER | fatty acid metabolic process | 79/2897 | 390/18723 | 6.34e-03 | 4.56e-02 | 79 |
| GO:00074092 | Colorectum | MSS | axonogenesis | 105/3467 | 418/18723 | 4.32e-04 | 5.23e-03 | 105 |
| GO:00615642 | Colorectum | MSS | axon development | 115/3467 | 467/18723 | 5.33e-04 | 6.00e-03 | 115 |
| GO:00066312 | Colorectum | MSS | fatty acid metabolic process | 95/3467 | 390/18723 | 2.20e-03 | 1.84e-02 | 95 |
| GO:00160422 | Colorectum | MSS | lipid catabolic process | 77/3467 | 320/18723 | 7.43e-03 | 4.71e-02 | 77 |
| GO:00356015 | Esophagus | ESCC | protein deacylation | 79/8552 | 112/18723 | 8.30e-08 | 1.42e-06 | 79 |
| Page: 1 2 3 4 |
| Pathway ID | Tissue | Disease Stage | Description | Gene Ratio | Bg Ratio | pvalue | p.adjust | qvalue | Count |
| Page: 1 |
Top |
Cell-cell communication analysis |
| Identification of potential cell-cell interactions between two cell types and their ligand-receptor pairs for different disease states |
| Ligand | Receptor | LRpair | Pathway | Tissue | Disease Stage |
| Page: 1 |
Top |
Single-cell gene regulatory network inference analysis |
| Find out the significant the regulons (TFs) and the target genes of each regulon across cell types for different disease states |
| TF | Cell Type | Tissue | Disease Stage | Target Gene | RSS | Regulon Activity |
| ∗The dot plots of a searched regulon are shown for all cell subpopulations in each disease state of each tissue based on the regulon specific score inferred using pySCENIC and by calculating the average expression. |
| Page: 1 |
Top |
Somatic mutation of malignant transformation related genes |
| Annotation of somatic variants for genes involved in malignant transformation |
| Hugo Symbol | Variant Class | Variant Classification | dbSNP RS | HGVSc | HGVSp | HGVSp Short | SWISSPROT | BIOTYPE | SIFT | PolyPhen | Tumor Sample Barcode | Tissue | Histology | Sex | Age | Stage | Therapy Types | Drugs | Outcome |
| LYPLA2 | SNV | Missense_Mutation | rs775467458 | c.373N>A | p.Gly125Arg | p.G125R | O95372 | protein_coding | deleterious(0) | possibly_damaging(0.813) | TCGA-EA-A410-01 | Cervix | cervical & endocervical cancer | Female | <65 | I/II | Unknown | Unknown | SD |
| LYPLA2 | SNV | Missense_Mutation | novel | c.349N>A | p.Val117Ile | p.V117I | O95372 | protein_coding | tolerated(1) | benign(0.003) | TCGA-VS-A9UD-01 | Cervix | cervical & endocervical cancer | Female | >=65 | III/IV | Chemotherapy | cisplatin | CR |
| LYPLA2 | SNV | Missense_Mutation | rs777568986 | c.146T>A | p.Leu49His | p.L49H | O95372 | protein_coding | tolerated(0.13) | benign(0.021) | TCGA-A6-5665-01 | Colorectum | colon adenocarcinoma | Female | >=65 | I/II | Unknown | Unknown | PD |
| LYPLA2 | SNV | Missense_Mutation | rs375628913 | c.77N>T | p.Ala26Val | p.A26V | O95372 | protein_coding | tolerated(0.11) | benign(0) | TCGA-AA-A01R-01 | Colorectum | colon adenocarcinoma | Male | <65 | III/IV | Chemotherapy | 5-fluorouracil | PD |
| LYPLA2 | SNV | Missense_Mutation | c.664G>A | p.Glu222Lys | p.E222K | O95372 | protein_coding | tolerated(0.63) | benign(0.026) | TCGA-AZ-6599-01 | Colorectum | colon adenocarcinoma | Male | >=65 | I/II | Unknown | Unknown | SD | |
| LYPLA2 | deletion | Frame_Shift_Del | c.83delN | p.Leu30TyrfsTer35 | p.L30Yfs*35 | O95372 | protein_coding | TCGA-AD-6889-01 | Colorectum | colon adenocarcinoma | Male | >=65 | I/II | Chemotherapy | xeloda | PD | |||
| LYPLA2 | SNV | Missense_Mutation | novel | c.548T>A | p.Phe183Tyr | p.F183Y | O95372 | protein_coding | tolerated(0.09) | benign(0.368) | TCGA-AJ-A3EK-01 | Endometrium | uterine corpus endometrioid carcinoma | Female | <65 | I/II | Chemotherapy | carboplatin | CR |
| LYPLA2 | SNV | Missense_Mutation | novel | c.291N>T | p.Glu97Asp | p.E97D | O95372 | protein_coding | tolerated(0.12) | benign(0.003) | TCGA-AP-A0LM-01 | Endometrium | uterine corpus endometrioid carcinoma | Female | <65 | III/IV | Chemotherapy | cisplatin | SD |
| LYPLA2 | SNV | Missense_Mutation | c.279N>T | p.Lys93Asn | p.K93N | O95372 | protein_coding | tolerated(0.09) | possibly_damaging(0.54) | TCGA-AX-A0J0-01 | Endometrium | uterine corpus endometrioid carcinoma | Female | <65 | I/II | Unknown | Unknown | SD | |
| LYPLA2 | SNV | Missense_Mutation | c.590C>T | p.Pro197Leu | p.P197L | O95372 | protein_coding | deleterious(0) | possibly_damaging(0.74) | TCGA-B5-A11E-01 | Endometrium | uterine corpus endometrioid carcinoma | Female | <65 | I/II | Unknown | Unknown | SD |
| Page: 1 2 |
Top |
Related drugs of malignant transformation related genes |
| Identification of chemicals and drugs interact with genes involved in malignant transfromation |
| (DGIdb 4.0) |
| Entrez ID | Symbol | Category | Interaction Types | Drug Claim Name | Drug Name | PMIDs |
| Page: 1 |

Copyright 2023-Present -The University of Texas Health Science Center at Houston |