
|
|||||
|
 | |
| |
| |
| |
| |
| |
|
Gene: LYPLA1 |
Gene summary for LYPLA1 |
| Gene information | Species | Human | Gene symbol | LYPLA1 | Gene ID | 10434 |
| Gene name | lysophospholipase 1 | |
| Gene Alias | APT-1 | |
| Cytomap | 8q11.23 | |
| Gene Type | protein-coding | GO ID | GO:0002084 | UniProtAcc | B4DP64 |
Top |
Malignant transformation analysis |
| Identification of the aberrant gene expression in precancerous and cancerous lesions by comparing the gene expression of stem-like cells in diseased tissues with normal stem cells |
| Entrez ID | Symbol | Replicates | Species | Organ | Tissue | Adj P-value | Log2FC | Malignancy |
| 10434 | LYPLA1 | GSM4909286 | Human | Breast | IDC | 1.94e-02 | 8.49e-02 | 0.1081 |
| 10434 | LYPLA1 | GSM4909291 | Human | Breast | IDC | 6.20e-10 | 4.85e-01 | 0.1753 |
| 10434 | LYPLA1 | GSM4909293 | Human | Breast | IDC | 1.81e-08 | 4.37e-01 | 0.1581 |
| 10434 | LYPLA1 | GSM4909295 | Human | Breast | IDC | 1.87e-02 | 3.44e-01 | 0.0898 |
| 10434 | LYPLA1 | GSM4909296 | Human | Breast | IDC | 1.45e-03 | -1.20e-01 | 0.1524 |
| 10434 | LYPLA1 | GSM4909297 | Human | Breast | IDC | 1.28e-08 | 5.11e-02 | 0.1517 |
| 10434 | LYPLA1 | GSM4909304 | Human | Breast | IDC | 7.19e-06 | 3.38e-01 | 0.1636 |
| 10434 | LYPLA1 | GSM4909305 | Human | Breast | IDC | 4.21e-04 | 3.39e-01 | 0.0436 |
| 10434 | LYPLA1 | GSM4909306 | Human | Breast | IDC | 7.73e-08 | 4.20e-01 | 0.1564 |
| 10434 | LYPLA1 | GSM4909308 | Human | Breast | IDC | 5.86e-10 | 3.69e-01 | 0.158 |
| 10434 | LYPLA1 | GSM4909311 | Human | Breast | IDC | 2.71e-16 | 1.37e-02 | 0.1534 |
| 10434 | LYPLA1 | GSM4909312 | Human | Breast | IDC | 7.29e-35 | 8.07e-01 | 0.1552 |
| 10434 | LYPLA1 | GSM4909317 | Human | Breast | IDC | 8.61e-70 | 1.20e+00 | 0.1355 |
| 10434 | LYPLA1 | GSM4909318 | Human | Breast | IDC | 4.99e-38 | 1.41e+00 | 0.2031 |
| 10434 | LYPLA1 | GSM4909319 | Human | Breast | IDC | 1.45e-21 | -1.85e-01 | 0.1563 |
| 10434 | LYPLA1 | GSM4909321 | Human | Breast | IDC | 1.21e-10 | 2.24e-01 | 0.1559 |
| 10434 | LYPLA1 | NCCBC11 | Human | Breast | DCIS | 1.94e-02 | 3.60e-01 | 0.1232 |
| 10434 | LYPLA1 | NCCBC14 | Human | Breast | DCIS | 7.79e-03 | 2.64e-02 | 0.2021 |
| 10434 | LYPLA1 | NCCBC2 | Human | Breast | DCIS | 2.28e-02 | 1.37e-01 | 0.1554 |
| 10434 | LYPLA1 | NCCBC5 | Human | Breast | DCIS | 2.83e-03 | -2.91e-02 | 0.2046 |
| Page: 1 2 3 4 5 6 7 8 9 |
| Tissue | Expression Dynamics | Abbreviation |
| Breast |  | IDC: Invasive ductal carcinoma |
| DCIS: Ductal carcinoma in situ | ||
| Precancer(BRCA1-mut): Precancerous lesion from BRCA1 mutation carriers | ||
| Colorectum (GSE201348) |  | FAP: Familial adenomatous polyposis |
| CRC: Colorectal cancer | ||
| Colorectum (HTA11) |  | AD: Adenomas |
| SER: Sessile serrated lesions | ||
| MSI-H: Microsatellite-high colorectal cancer | ||
| MSS: Microsatellite stable colorectal cancer | ||
| Esophagus | 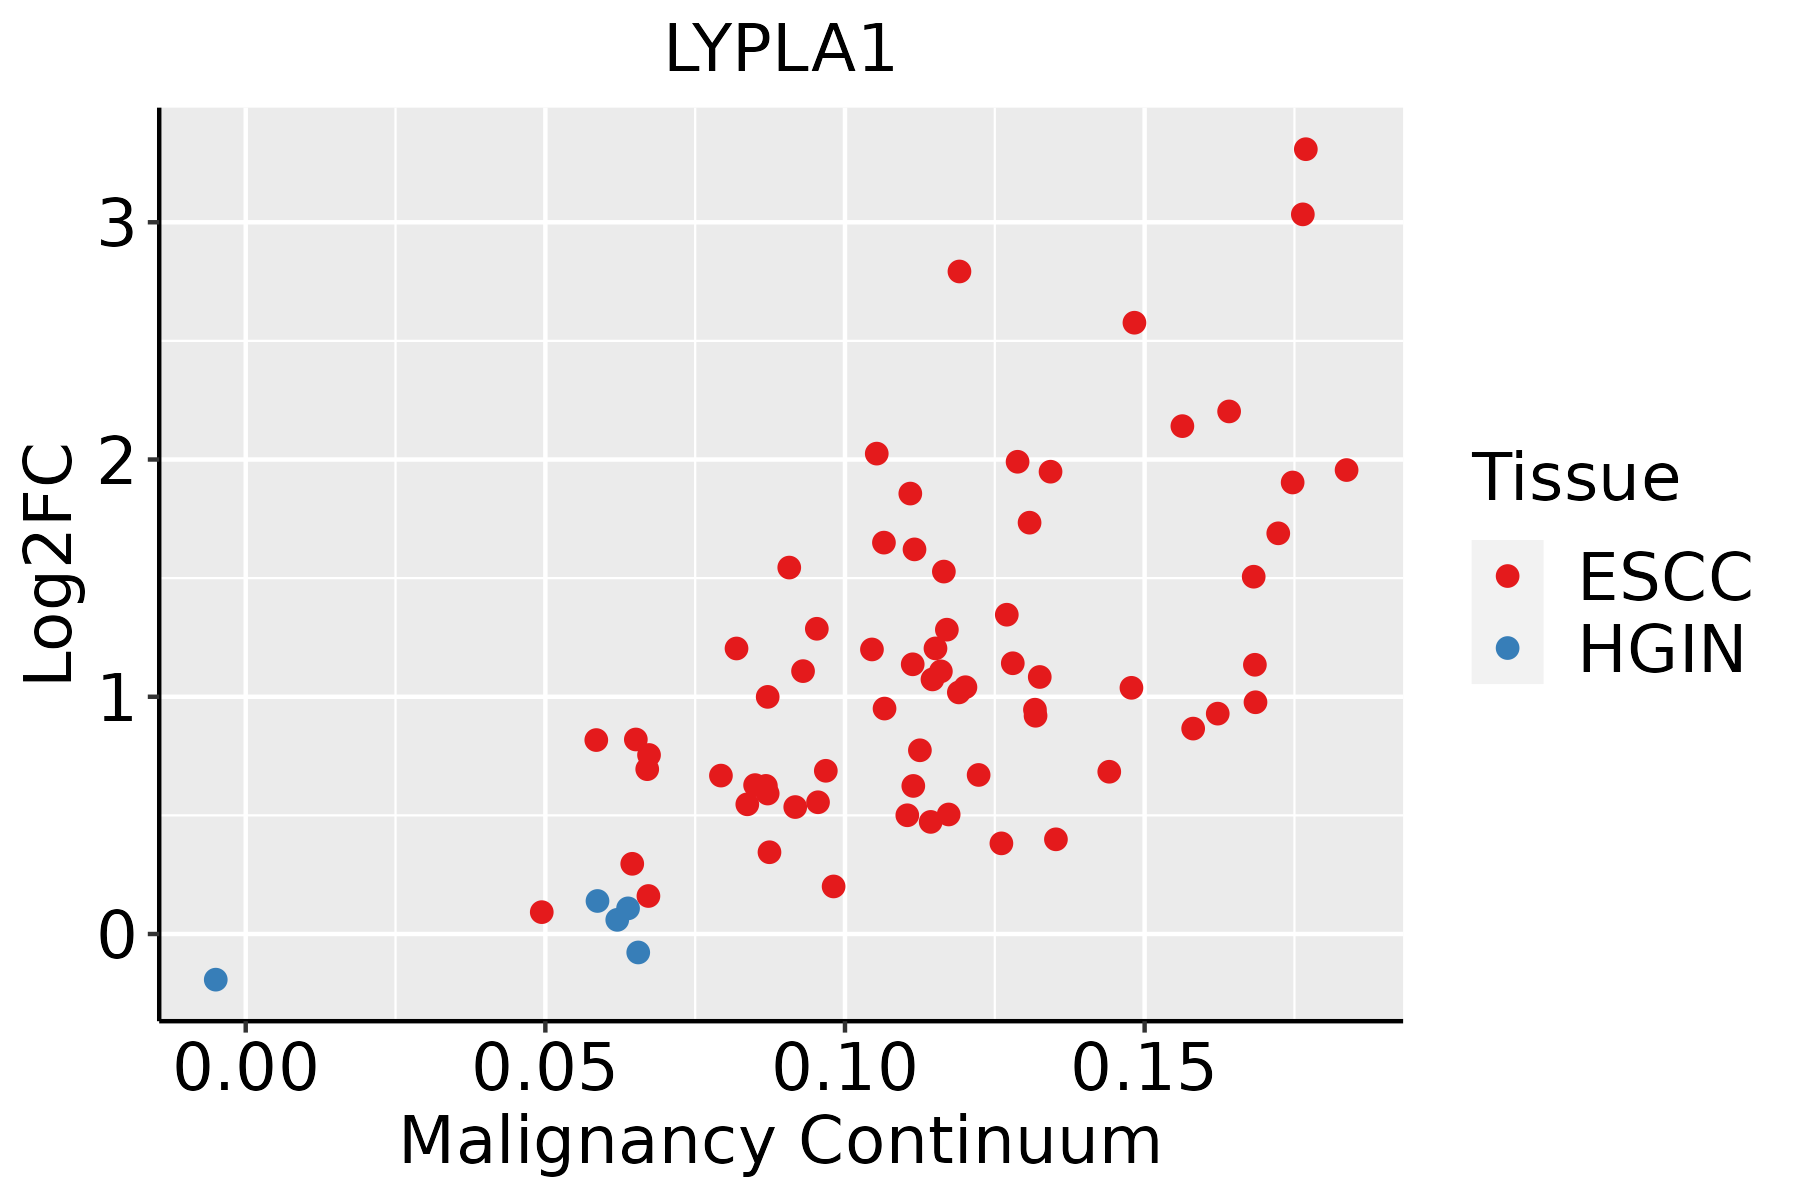 | ESCC: Esophageal squamous cell carcinoma |
| HGIN: High-grade intraepithelial neoplasias | ||
| LGIN: Low-grade intraepithelial neoplasias | ||
| Liver | 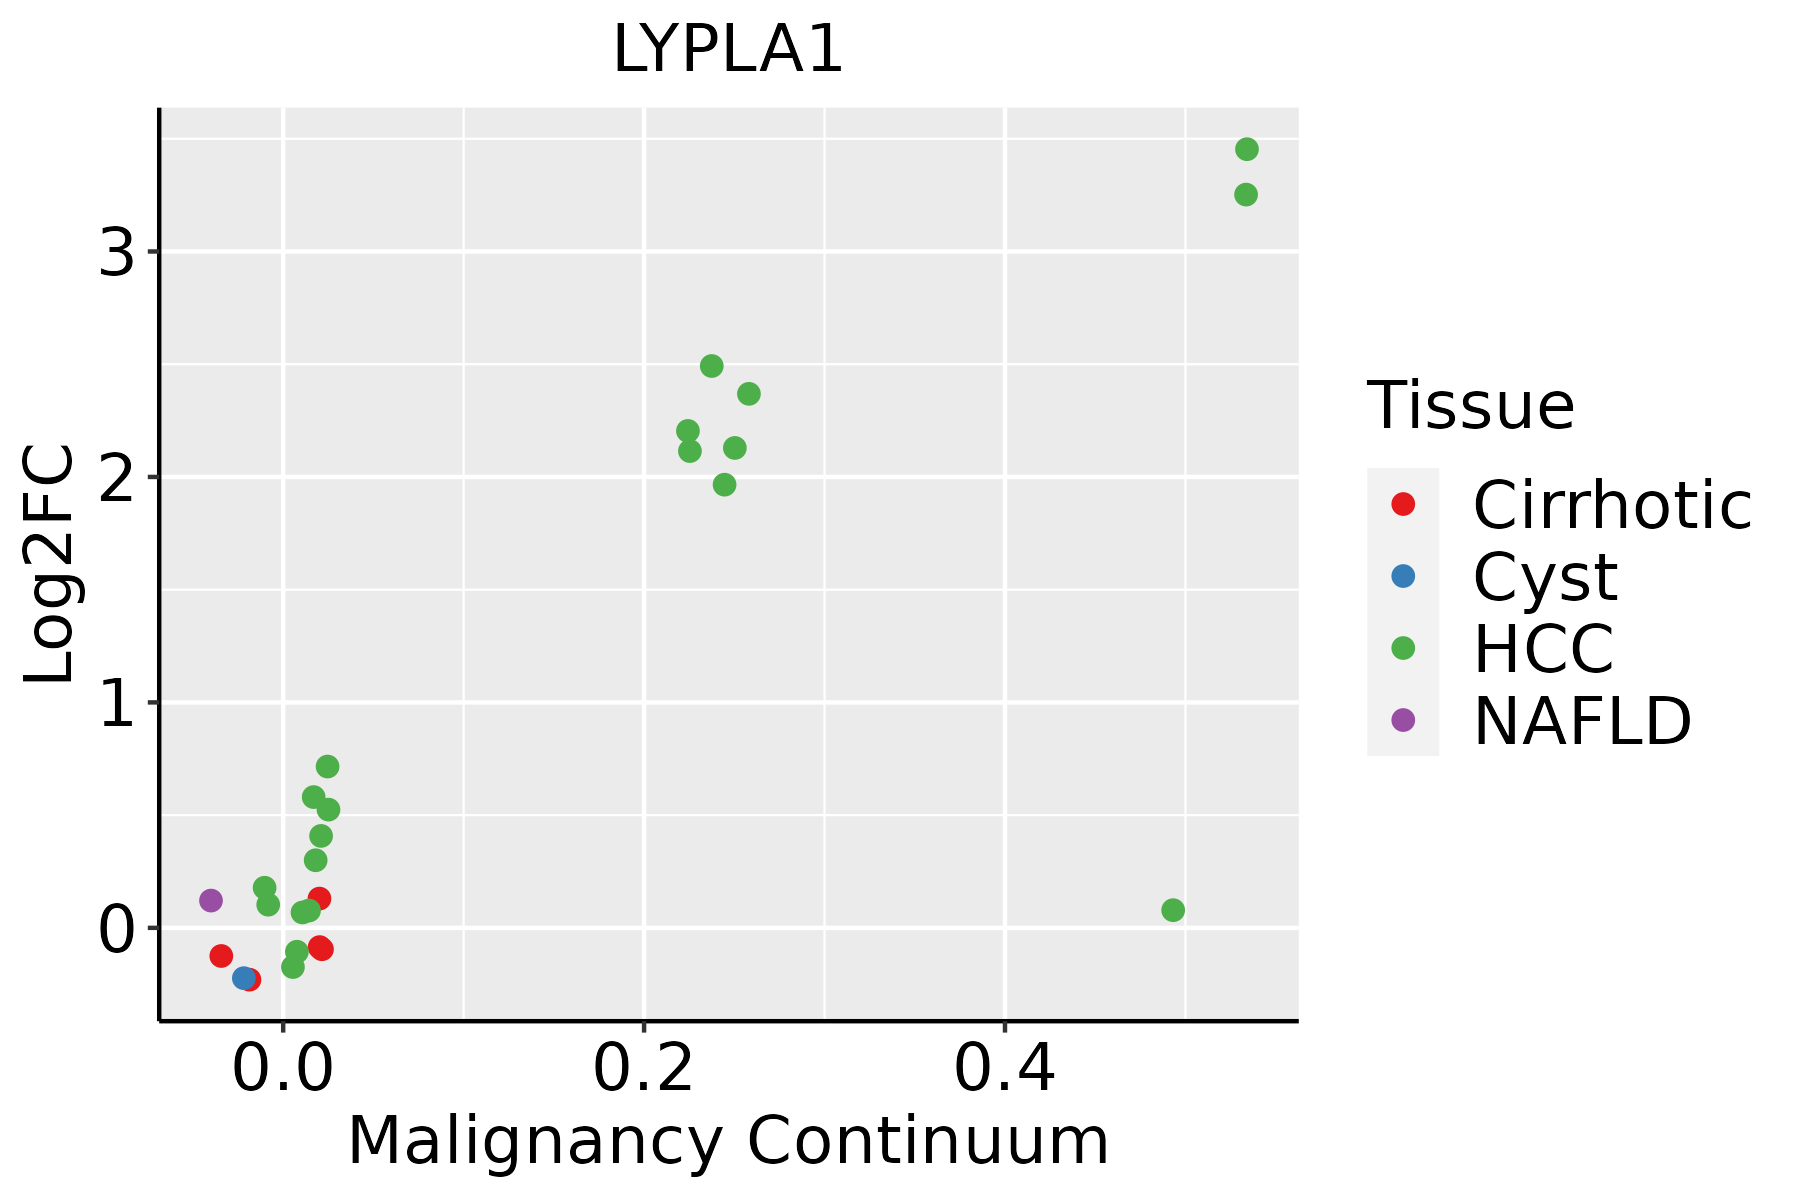 | HCC: Hepatocellular carcinoma |
| NAFLD: Non-alcoholic fatty liver disease | ||
| Oral Cavity | 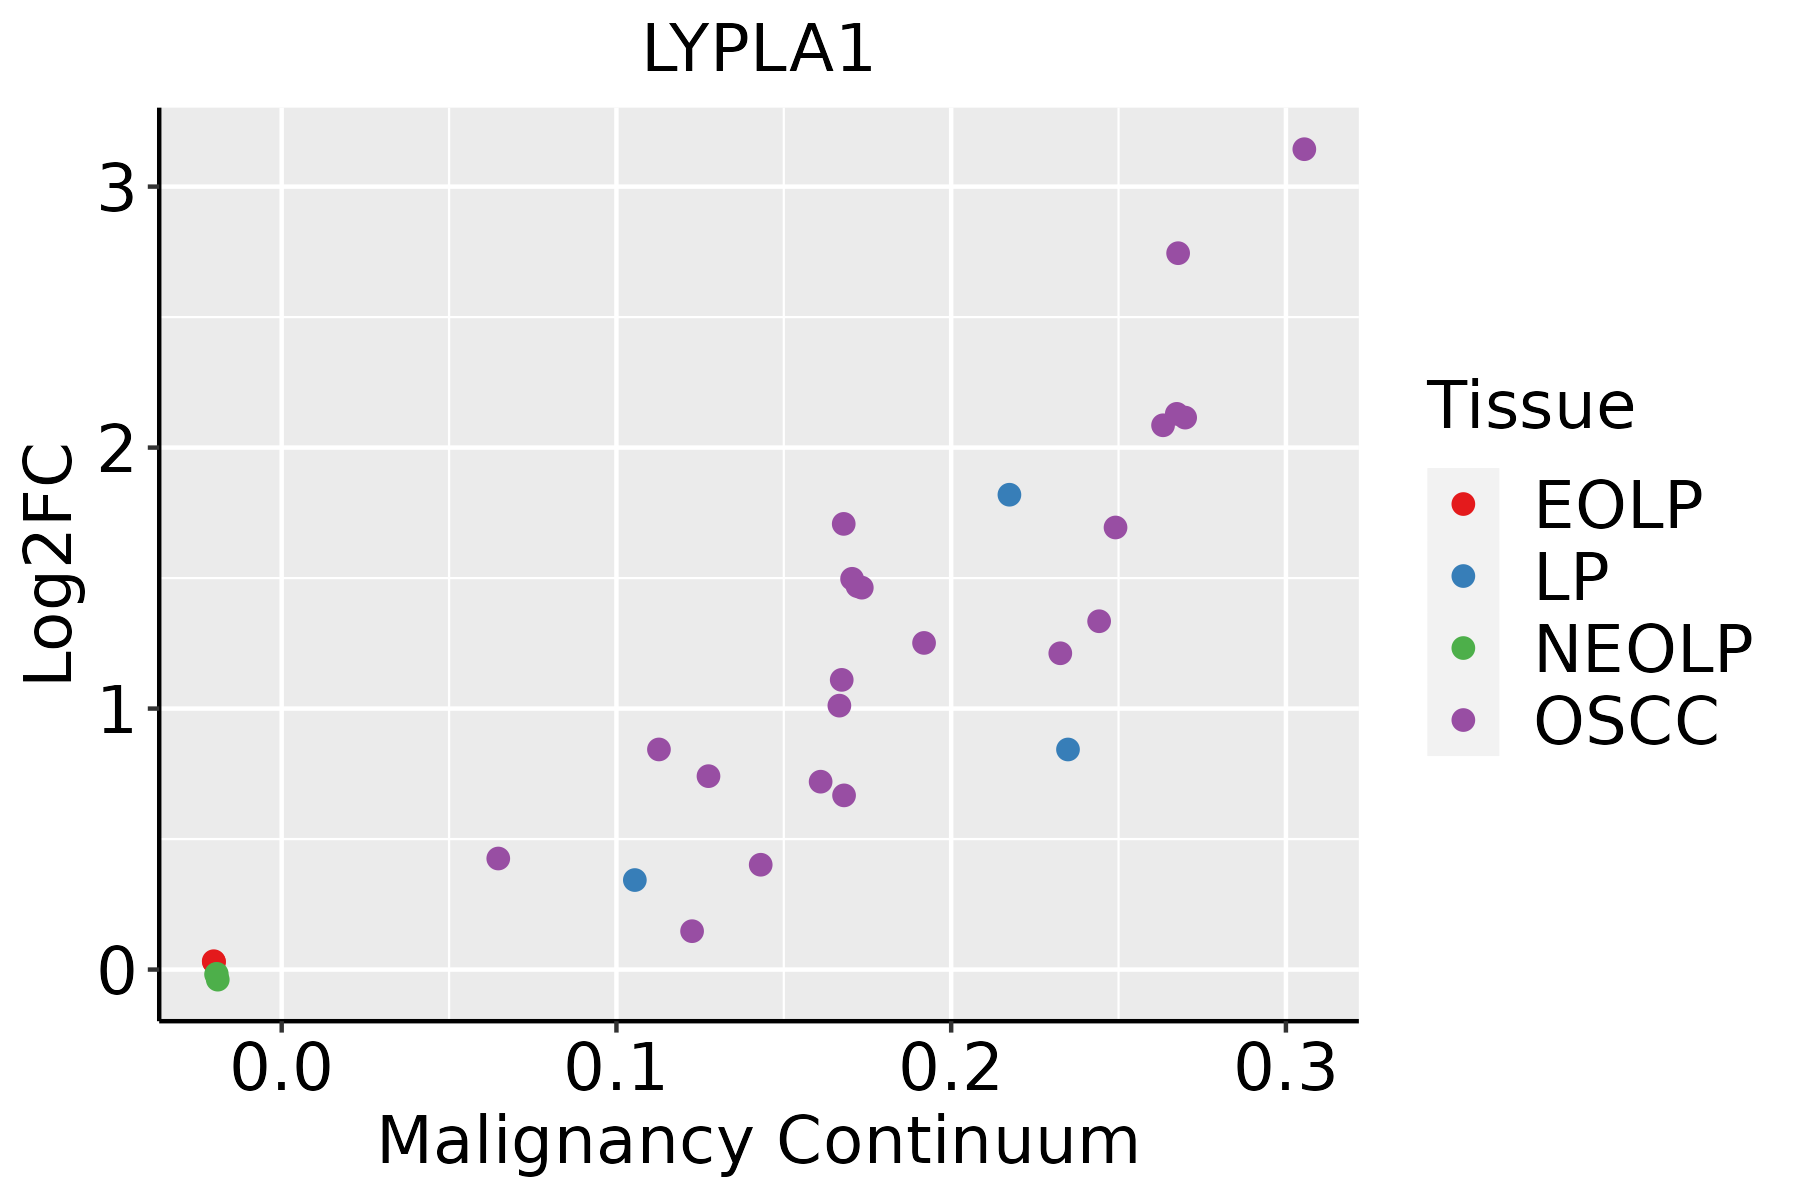 | EOLP: Erosive Oral lichen planus |
| LP: leukoplakia | ||
| NEOLP: Non-erosive oral lichen planus | ||
| OSCC: Oral squamous cell carcinoma | ||
| Prostate | 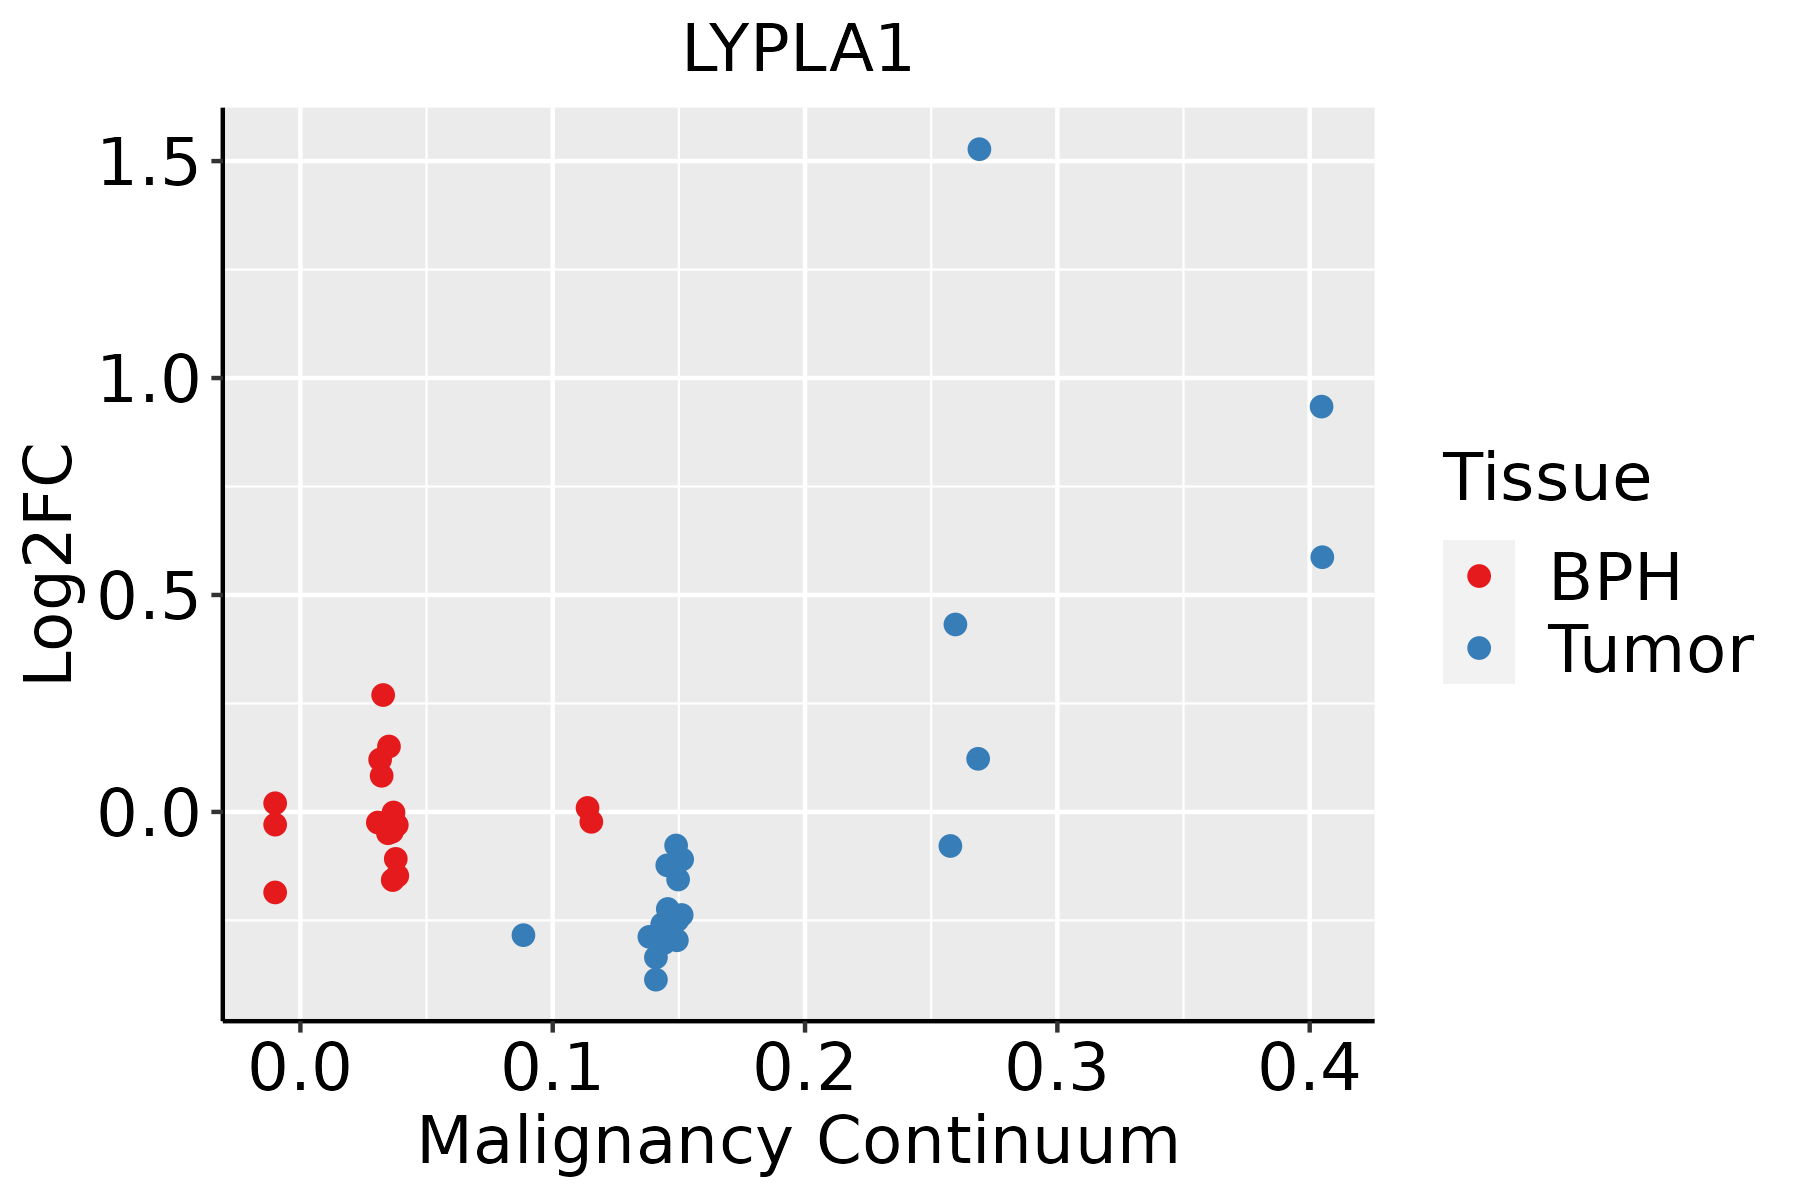 | BPH: Benign Prostatic Hyperplasia |
| Skin | 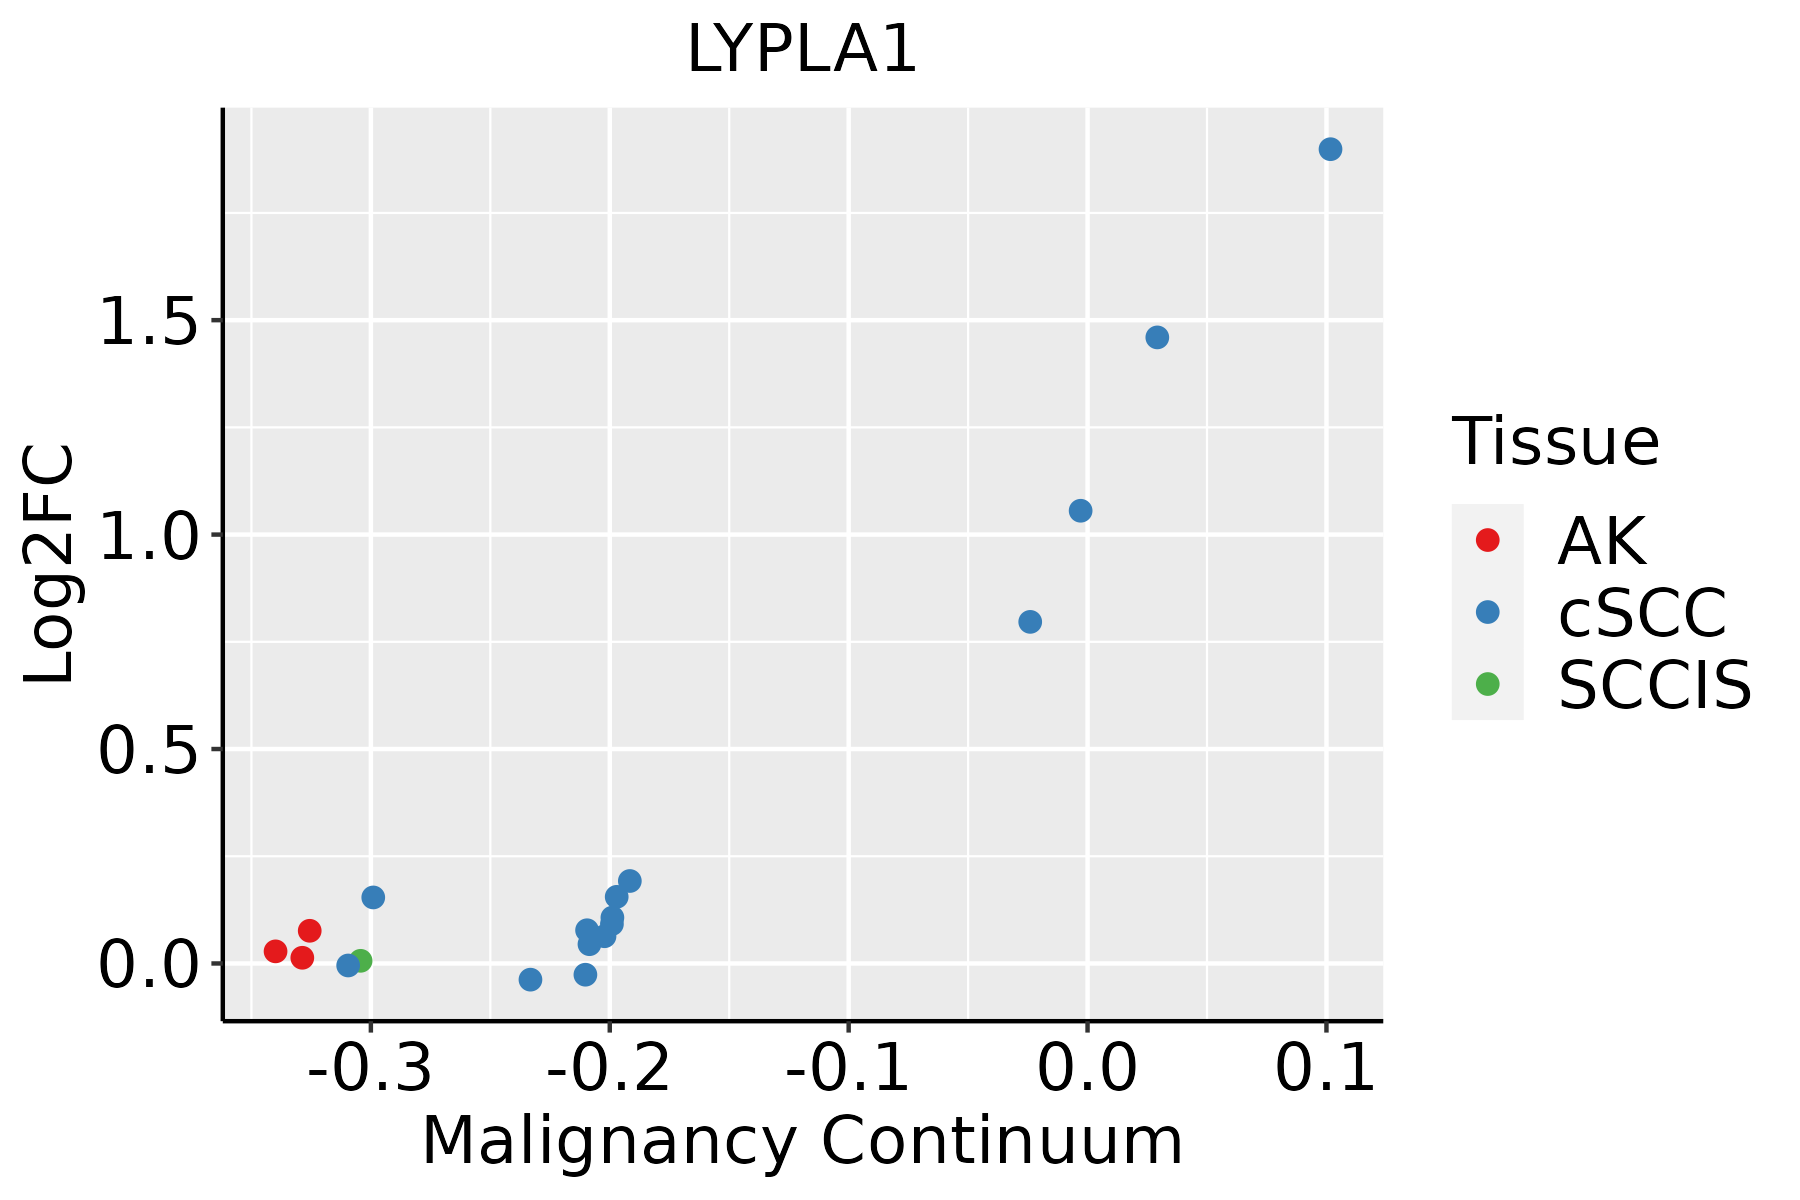 | AK: Actinic keratosis |
| cSCC: Cutaneous squamous cell carcinoma | ||
| SCCIS:squamous cell carcinoma in situ | ||
| Thyroid | 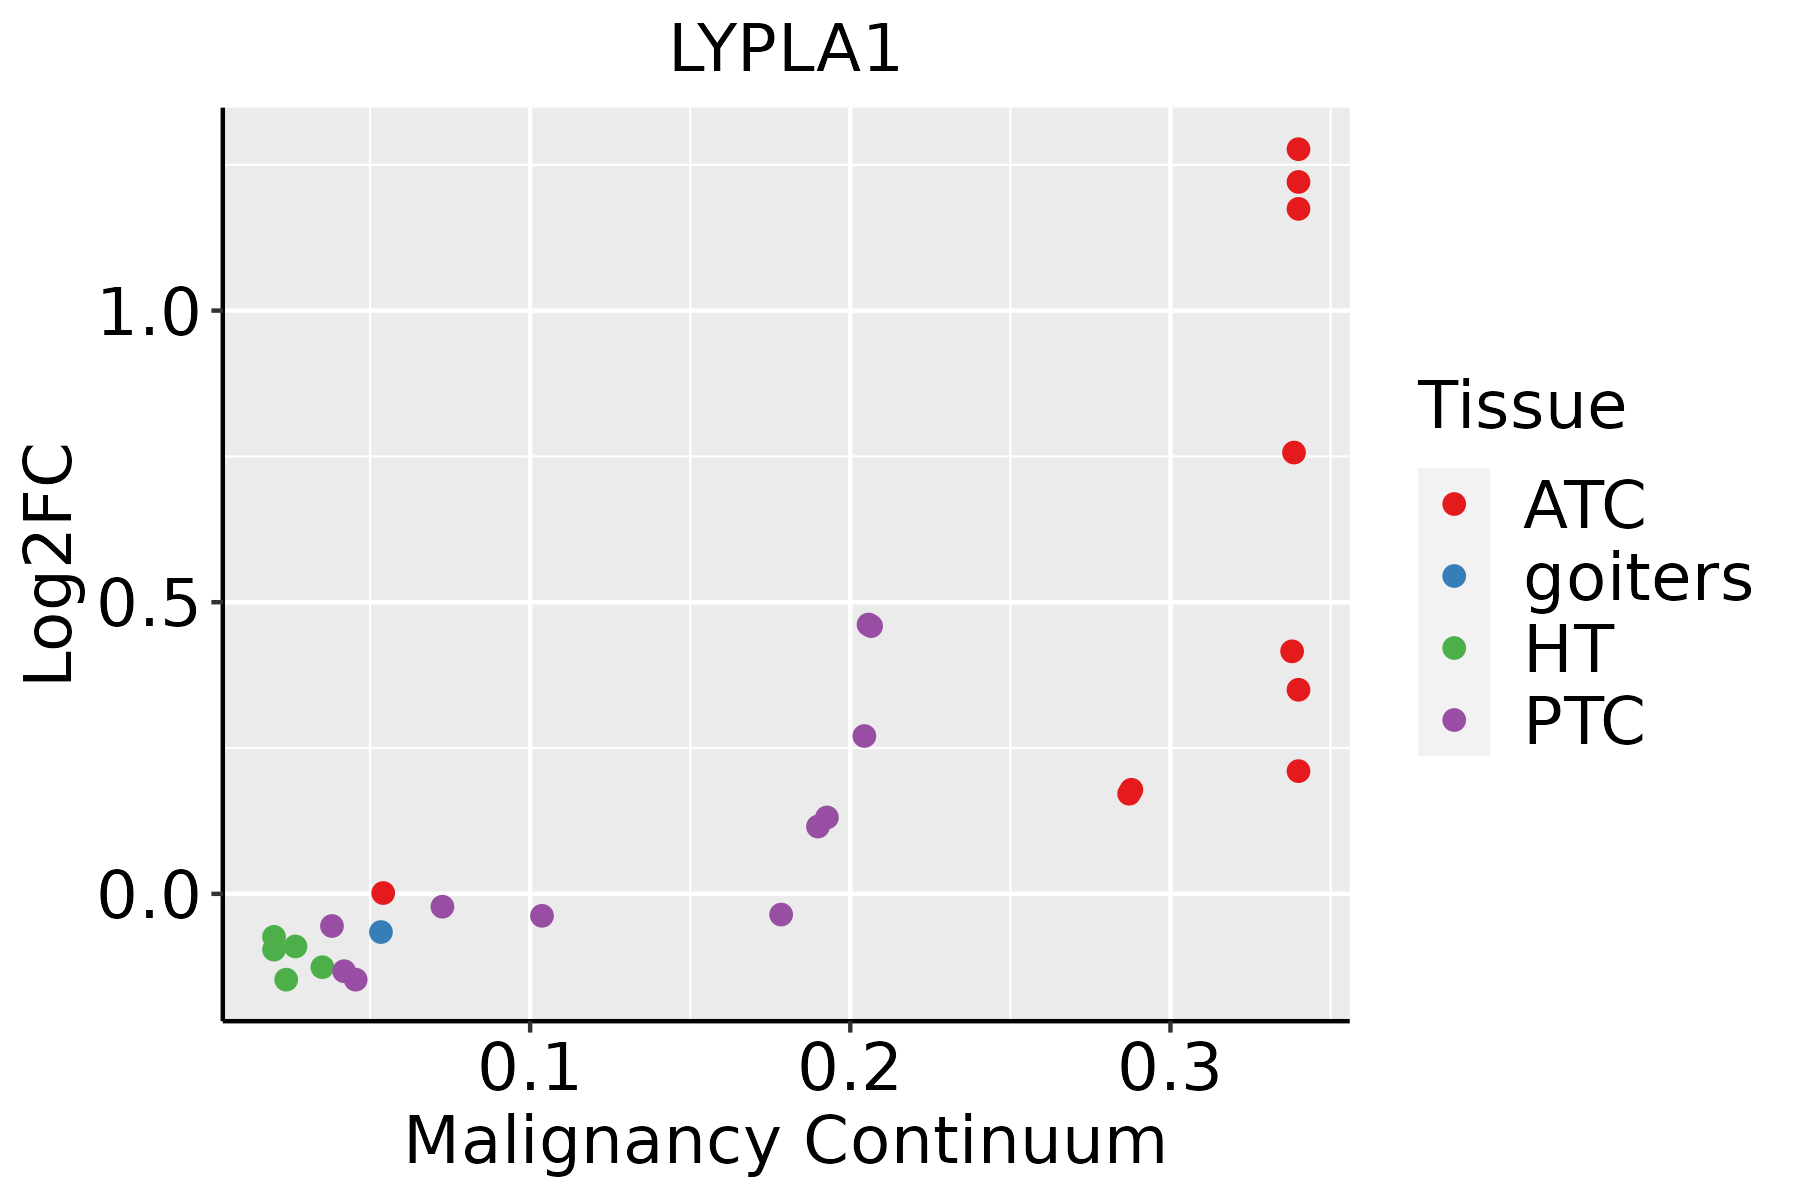 | ATC: Anaplastic thyroid cancer |
| HT: Hashimoto's thyroiditis | ||
| PTC: Papillary thyroid cancer |
| ∗log2FC in expression of this searched gene in stem-like cells from each diseased tissue sample relative to stem-like cells in normal samples in each tissue plotted against the malignancy continuum. Samples are colored based on if they are from different disease stage. |
Top |
Malignant transformation related pathway analysis |
| Find out the enriched GO biological processes and KEGG pathways involved in transition from healthy to precancer to cancer |
| Tissue | Disease Stage | Enriched GO biological Processes |
| Colorectum | AD |  |
| Colorectum | SER |  |
| Colorectum | MSS |  |
| Colorectum | MSI-H |  |
| Colorectum | FAP |  |
| ∗Top 15 enriched GO BP terms are showed in the bar plot of each disease state in each tissue. Each row represents a significant GO biological process which is colored according to the -log10(p.adjust). |
| Page: 1 2 3 4 5 6 7 8 9 |
| GO ID | Tissue | Disease Stage | Description | Gene Ratio | Bg Ratio | pvalue | p.adjust | Count |
| GO:190547513 | Breast | IDC | regulation of protein localization to membrane | 28/1434 | 175/18723 | 1.56e-04 | 2.71e-03 | 28 |
| GO:190307613 | Breast | IDC | regulation of protein localization to plasma membrane | 17/1434 | 104/18723 | 2.28e-03 | 2.09e-02 | 17 |
| GO:190437513 | Breast | IDC | regulation of protein localization to cell periphery | 19/1434 | 125/18723 | 3.06e-03 | 2.60e-02 | 19 |
| GO:00726599 | Breast | IDC | protein localization to plasma membrane | 34/1434 | 284/18723 | 6.33e-03 | 4.47e-02 | 34 |
| GO:190547522 | Breast | DCIS | regulation of protein localization to membrane | 26/1390 | 175/18723 | 5.31e-04 | 6.88e-03 | 26 |
| GO:190307623 | Breast | DCIS | regulation of protein localization to plasma membrane | 16/1390 | 104/18723 | 4.13e-03 | 3.27e-02 | 16 |
| GO:190437522 | Breast | DCIS | regulation of protein localization to cell periphery | 18/1390 | 125/18723 | 5.02e-03 | 3.73e-02 | 18 |
| GO:0072659 | Colorectum | AD | protein localization to plasma membrane | 122/3918 | 284/18723 | 2.86e-17 | 1.49e-14 | 122 |
| GO:1990778 | Colorectum | AD | protein localization to cell periphery | 129/3918 | 333/18723 | 5.51e-14 | 1.15e-11 | 129 |
| GO:0090150 | Colorectum | AD | establishment of protein localization to membrane | 100/3918 | 260/18723 | 6.01e-11 | 6.33e-09 | 100 |
| GO:0048193 | Colorectum | AD | Golgi vesicle transport | 109/3918 | 296/18723 | 1.80e-10 | 1.68e-08 | 109 |
| GO:1905475 | Colorectum | AD | regulation of protein localization to membrane | 73/3918 | 175/18723 | 3.37e-10 | 2.93e-08 | 73 |
| GO:1903076 | Colorectum | AD | regulation of protein localization to plasma membrane | 48/3918 | 104/18723 | 7.17e-09 | 4.36e-07 | 48 |
| GO:1904375 | Colorectum | AD | regulation of protein localization to cell periphery | 54/3918 | 125/18723 | 1.52e-08 | 9.00e-07 | 54 |
| GO:0098876 | Colorectum | AD | vesicle-mediated transport to the plasma membrane | 57/3918 | 136/18723 | 2.30e-08 | 1.27e-06 | 57 |
| GO:0061951 | Colorectum | AD | establishment of protein localization to plasma membrane | 31/3918 | 60/18723 | 1.37e-07 | 6.42e-06 | 31 |
| GO:0006892 | Colorectum | AD | post-Golgi vesicle-mediated transport | 45/3918 | 104/18723 | 2.22e-07 | 9.26e-06 | 45 |
| GO:0043001 | Colorectum | AD | Golgi to plasma membrane protein transport | 21/3918 | 40/18723 | 1.03e-05 | 2.40e-04 | 21 |
| GO:0006893 | Colorectum | AD | Golgi to plasma membrane transport | 27/3918 | 60/18723 | 2.41e-05 | 4.66e-04 | 27 |
| GO:0006631 | Colorectum | AD | fatty acid metabolic process | 114/3918 | 390/18723 | 5.58e-05 | 9.44e-04 | 114 |
| Page: 1 2 3 4 5 6 7 8 9 10 11 12 13 14 15 |
| Pathway ID | Tissue | Disease Stage | Description | Gene Ratio | Bg Ratio | pvalue | p.adjust | qvalue | Count |
| hsa05231 | Colorectum | MSS | Choline metabolism in cancer | 34/1875 | 98/8465 | 2.90e-03 | 1.39e-02 | 8.50e-03 | 34 |
| hsa052311 | Colorectum | MSS | Choline metabolism in cancer | 34/1875 | 98/8465 | 2.90e-03 | 1.39e-02 | 8.50e-03 | 34 |
| hsa052312 | Colorectum | FAP | Choline metabolism in cancer | 29/1404 | 98/8465 | 9.03e-04 | 5.20e-03 | 3.16e-03 | 29 |
| hsa052313 | Colorectum | FAP | Choline metabolism in cancer | 29/1404 | 98/8465 | 9.03e-04 | 5.20e-03 | 3.16e-03 | 29 |
| hsa052314 | Colorectum | CRC | Choline metabolism in cancer | 24/1091 | 98/8465 | 1.21e-03 | 9.84e-03 | 6.67e-03 | 24 |
| hsa052315 | Colorectum | CRC | Choline metabolism in cancer | 24/1091 | 98/8465 | 1.21e-03 | 9.84e-03 | 6.67e-03 | 24 |
| hsa052319 | Esophagus | ESCC | Choline metabolism in cancer | 61/4205 | 98/8465 | 7.97e-03 | 1.92e-02 | 9.84e-03 | 61 |
| hsa0523114 | Esophagus | ESCC | Choline metabolism in cancer | 61/4205 | 98/8465 | 7.97e-03 | 1.92e-02 | 9.84e-03 | 61 |
| hsa052316 | Liver | HCC | Choline metabolism in cancer | 57/4020 | 98/8465 | 2.14e-02 | 4.90e-02 | 2.72e-02 | 57 |
| hsa0523111 | Liver | HCC | Choline metabolism in cancer | 57/4020 | 98/8465 | 2.14e-02 | 4.90e-02 | 2.72e-02 | 57 |
| Page: 1 |
Top |
Cell-cell communication analysis |
| Identification of potential cell-cell interactions between two cell types and their ligand-receptor pairs for different disease states |
| Ligand | Receptor | LRpair | Pathway | Tissue | Disease Stage |
| Page: 1 |
Top |
Single-cell gene regulatory network inference analysis |
| Find out the significant the regulons (TFs) and the target genes of each regulon across cell types for different disease states |
| TF | Cell Type | Tissue | Disease Stage | Target Gene | RSS | Regulon Activity |
| ∗The dot plots of a searched regulon are shown for all cell subpopulations in each disease state of each tissue based on the regulon specific score inferred using pySCENIC and by calculating the average expression. |
| Page: 1 |
Top |
Somatic mutation of malignant transformation related genes |
| Annotation of somatic variants for genes involved in malignant transformation |
| Hugo Symbol | Variant Class | Variant Classification | dbSNP RS | HGVSc | HGVSp | HGVSp Short | SWISSPROT | BIOTYPE | SIFT | PolyPhen | Tumor Sample Barcode | Tissue | Histology | Sex | Age | Stage | Therapy Types | Drugs | Outcome |
| LYPLA1 | SNV | Missense_Mutation | novel | c.494N>T | p.Ser165Phe | p.S165F | O75608 | protein_coding | deleterious(0) | possibly_damaging(0.722) | TCGA-C5-A2LZ-01 | Cervix | cervical & endocervical cancer | Female | >=65 | III/IV | Unknown | Unknown | PD |
| LYPLA1 | SNV | Missense_Mutation | c.229N>T | p.Gly77Trp | p.G77W | O75608 | protein_coding | deleterious(0) | probably_damaging(0.998) | TCGA-AA-3811-01 | Colorectum | colon adenocarcinoma | Female | >=65 | III/IV | Unknown | Unknown | PD | |
| LYPLA1 | SNV | Missense_Mutation | novel | c.335N>T | p.Arg112Ile | p.R112I | O75608 | protein_coding | deleterious(0) | probably_damaging(0.994) | TCGA-CA-6717-01 | Colorectum | colon adenocarcinoma | Male | <65 | I/II | Chemotherapy | oxaliplatin | CR |
| LYPLA1 | SNV | Missense_Mutation | c.260N>T | p.Ser87Phe | p.S87F | O75608 | protein_coding | deleterious(0.04) | benign(0.365) | TCGA-CA-6717-01 | Colorectum | colon adenocarcinoma | Male | <65 | I/II | Chemotherapy | oxaliplatin | CR | |
| LYPLA1 | SNV | Missense_Mutation | rs767257936 | c.554N>T | p.Thr185Met | p.T185M | O75608 | protein_coding | deleterious(0.01) | possibly_damaging(0.681) | TCGA-QG-A5Z2-01 | Colorectum | colon adenocarcinoma | Male | <65 | I/II | Unknown | Unknown | SD |
| LYPLA1 | SNV | Missense_Mutation | novel | c.259N>C | p.Ser87Pro | p.S87P | O75608 | protein_coding | tolerated(0.34) | benign(0) | TCGA-AX-A06F-01 | Endometrium | uterine corpus endometrioid carcinoma | Female | <65 | III/IV | Chemotherapy | carboplatin | SD |
| LYPLA1 | SNV | Missense_Mutation | rs371316608 | c.629N>T | p.Ser210Leu | p.S210L | O75608 | protein_coding | deleterious(0.02) | possibly_damaging(0.676) | TCGA-D1-A17Q-01 | Endometrium | uterine corpus endometrioid carcinoma | Female | <65 | I/II | Unknown | Unknown | SD |
| LYPLA1 | SNV | Missense_Mutation | novel | c.362N>T | p.Gly121Val | p.G121V | O75608 | protein_coding | deleterious(0.01) | probably_damaging(1) | TCGA-DF-A2KU-01 | Endometrium | uterine corpus endometrioid carcinoma | Female | Unknown | I/II | Unknown | Unknown | SD |
| LYPLA1 | SNV | Missense_Mutation | novel | c.20C>T | p.Ser7Leu | p.S7L | O75608 | protein_coding | deleterious(0) | benign(0.095) | TCGA-DD-AAD5-01 | Liver | liver hepatocellular carcinoma | Male | <65 | I/II | Unknown | Unknown | PD |
| LYPLA1 | SNV | Missense_Mutation | c.346N>C | p.Gly116Arg | p.G116R | O75608 | protein_coding | deleterious(0.01) | probably_damaging(1) | TCGA-33-4582-01 | Lung | lung squamous cell carcinoma | Male | <65 | I/II | Unknown | Unknown | PD |
| Page: 1 2 |
Top |
Related drugs of malignant transformation related genes |
| Identification of chemicals and drugs interact with genes involved in malignant transfromation |
| (DGIdb 4.0) |
| Entrez ID | Symbol | Category | Interaction Types | Drug Claim Name | Drug Name | PMIDs |
| Page: 1 |

Copyright 2023-Present -The University of Texas Health Science Center at Houston |