
|
|||||
|
 | |
| |
| |
| |
| |
| |
|
Gene: LYNX1 |
Gene summary for LYNX1 |
| Gene information | Species | Human | Gene symbol | LYNX1 | Gene ID | 66004 |
| Gene name | Ly6/neurotoxin 1 | |
| Gene Alias | LYNX1 | |
| Cytomap | 8q24.3 | |
| Gene Type | protein-coding | GO ID | GO:0007154 | UniProtAcc | P0DP58 |
Top |
Malignant transformation analysis |
| Identification of the aberrant gene expression in precancerous and cancerous lesions by comparing the gene expression of stem-like cells in diseased tissues with normal stem cells |
| Entrez ID | Symbol | Replicates | Species | Organ | Tissue | Adj P-value | Log2FC | Malignancy |
| 66004 | LYNX1 | P4T-E | Human | Esophagus | ESCC | 4.90e-05 | 1.56e-01 | 0.1323 |
| 66004 | LYNX1 | P8T-E | Human | Esophagus | ESCC | 5.03e-16 | 9.32e-01 | 0.0889 |
| 66004 | LYNX1 | P9T-E | Human | Esophagus | ESCC | 4.01e-04 | 1.01e-01 | 0.1131 |
| 66004 | LYNX1 | P28T-E | Human | Esophagus | ESCC | 1.40e-11 | 3.27e-01 | 0.1149 |
| 66004 | LYNX1 | P31T-E | Human | Esophagus | ESCC | 1.21e-10 | 1.92e+00 | 0.1251 |
| 66004 | LYNX1 | P74T-E | Human | Esophagus | ESCC | 1.08e-19 | 1.86e+00 | 0.1479 |
| 66004 | LYNX1 | P75T-E | Human | Esophagus | ESCC | 7.61e-56 | 6.36e+00 | 0.1125 |
| 66004 | LYNX1 | P82T-E | Human | Esophagus | ESCC | 6.28e-04 | 2.79e-01 | 0.1072 |
| 66004 | LYNX1 | HCC1_Meng | Human | Liver | HCC | 2.94e-06 | 5.57e-03 | 0.0246 |
| 66004 | LYNX1 | HCC2_Meng | Human | Liver | HCC | 3.82e-02 | 5.16e-02 | 0.0107 |
| 66004 | LYNX1 | HCC1 | Human | Liver | HCC | 4.10e-02 | 2.31e+00 | 0.5336 |
| 66004 | LYNX1 | HCC2 | Human | Liver | HCC | 2.06e-25 | 4.66e+00 | 0.5341 |
| 66004 | LYNX1 | S014 | Human | Liver | HCC | 1.07e-03 | 2.80e-01 | 0.2254 |
| 66004 | LYNX1 | S015 | Human | Liver | HCC | 7.47e-09 | 3.91e-01 | 0.2375 |
| 66004 | LYNX1 | S027 | Human | Liver | HCC | 6.84e-11 | 7.31e-01 | 0.2446 |
| 66004 | LYNX1 | S028 | Human | Liver | HCC | 6.70e-23 | 8.28e-01 | 0.2503 |
| 66004 | LYNX1 | S029 | Human | Liver | HCC | 2.96e-23 | 8.15e-01 | 0.2581 |
| 66004 | LYNX1 | C21 | Human | Oral cavity | OSCC | 1.71e-03 | 1.70e+00 | 0.2678 |
| 66004 | LYNX1 | LP15 | Human | Oral cavity | LP | 8.57e-04 | 1.40e+00 | 0.2174 |
| 66004 | LYNX1 | SYSMH2 | Human | Oral cavity | OSCC | 2.16e-02 | 7.13e-01 | 0.2326 |
| Page: 1 2 |
| Tissue | Expression Dynamics | Abbreviation |
| Esophagus | 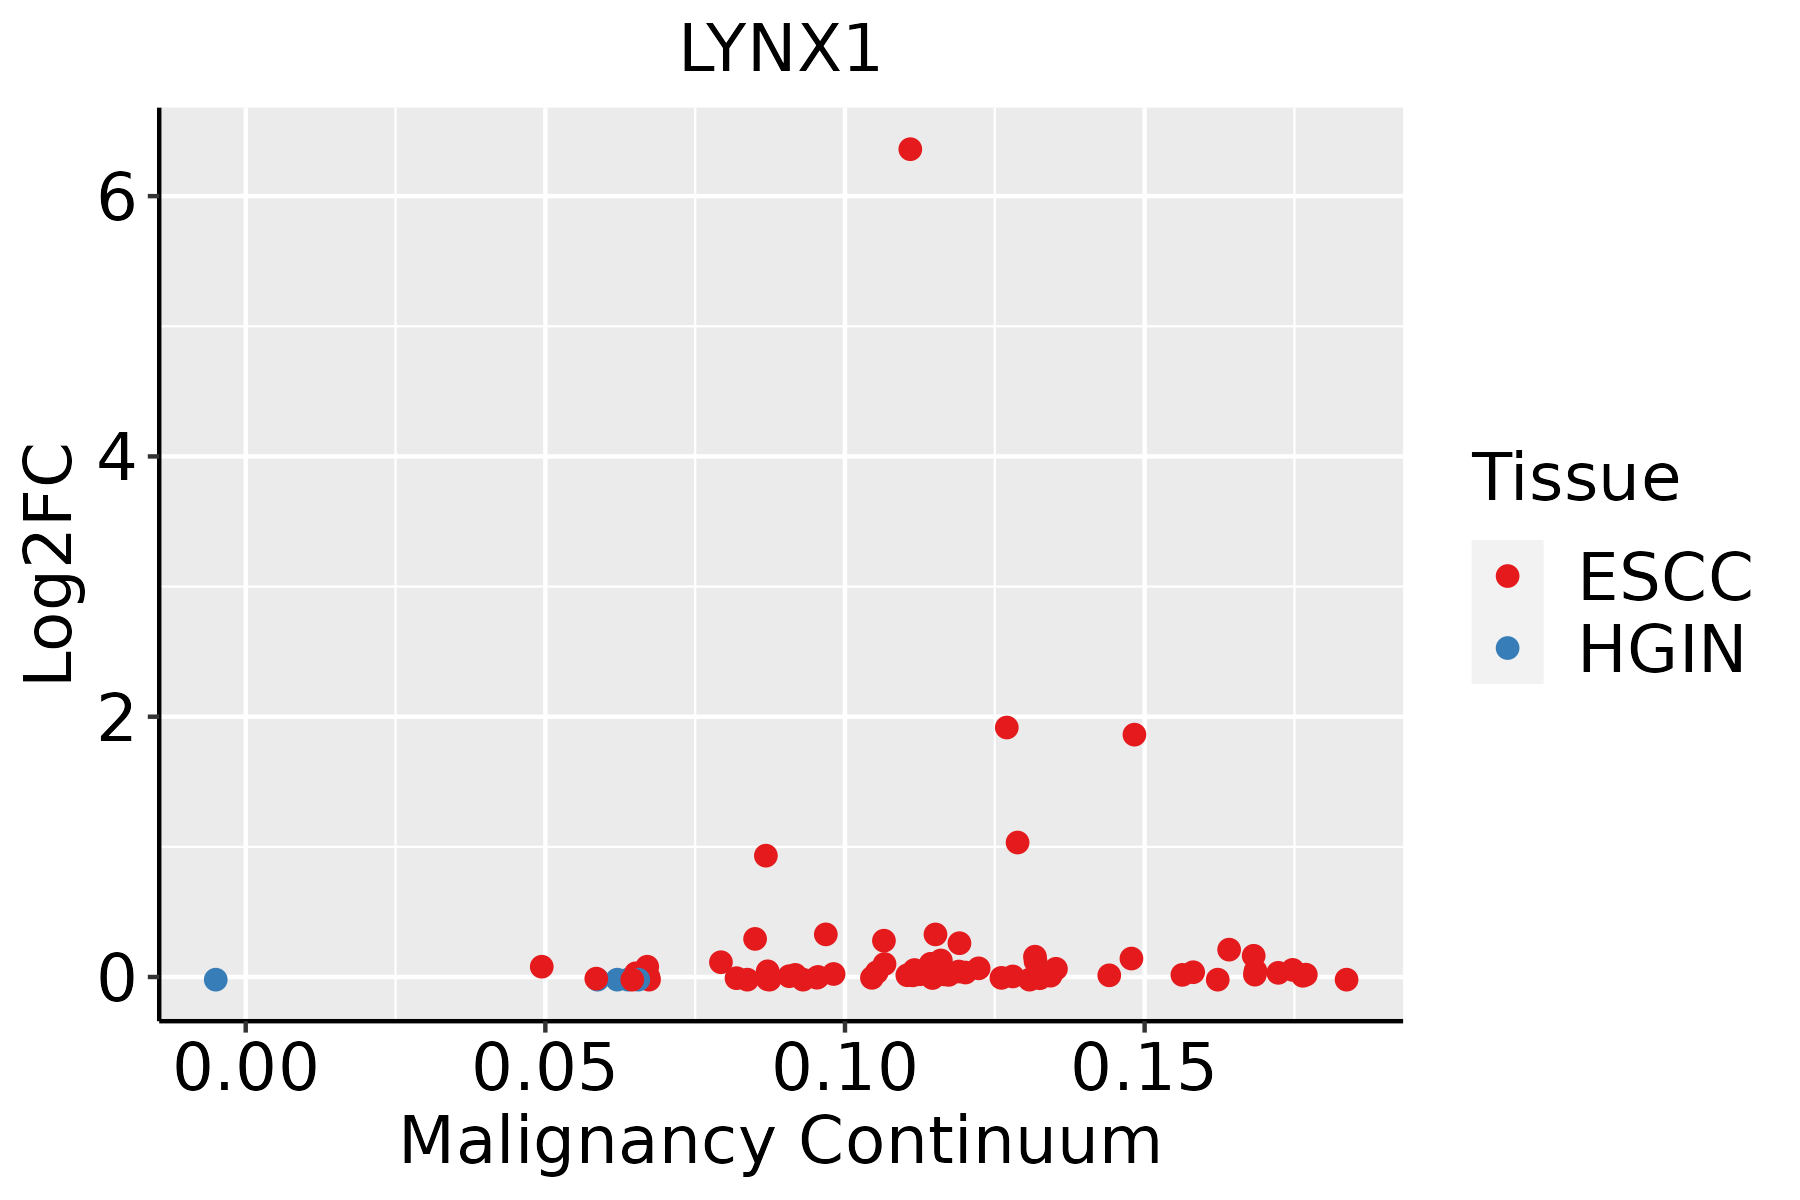 | ESCC: Esophageal squamous cell carcinoma |
| HGIN: High-grade intraepithelial neoplasias | ||
| LGIN: Low-grade intraepithelial neoplasias | ||
| Liver | 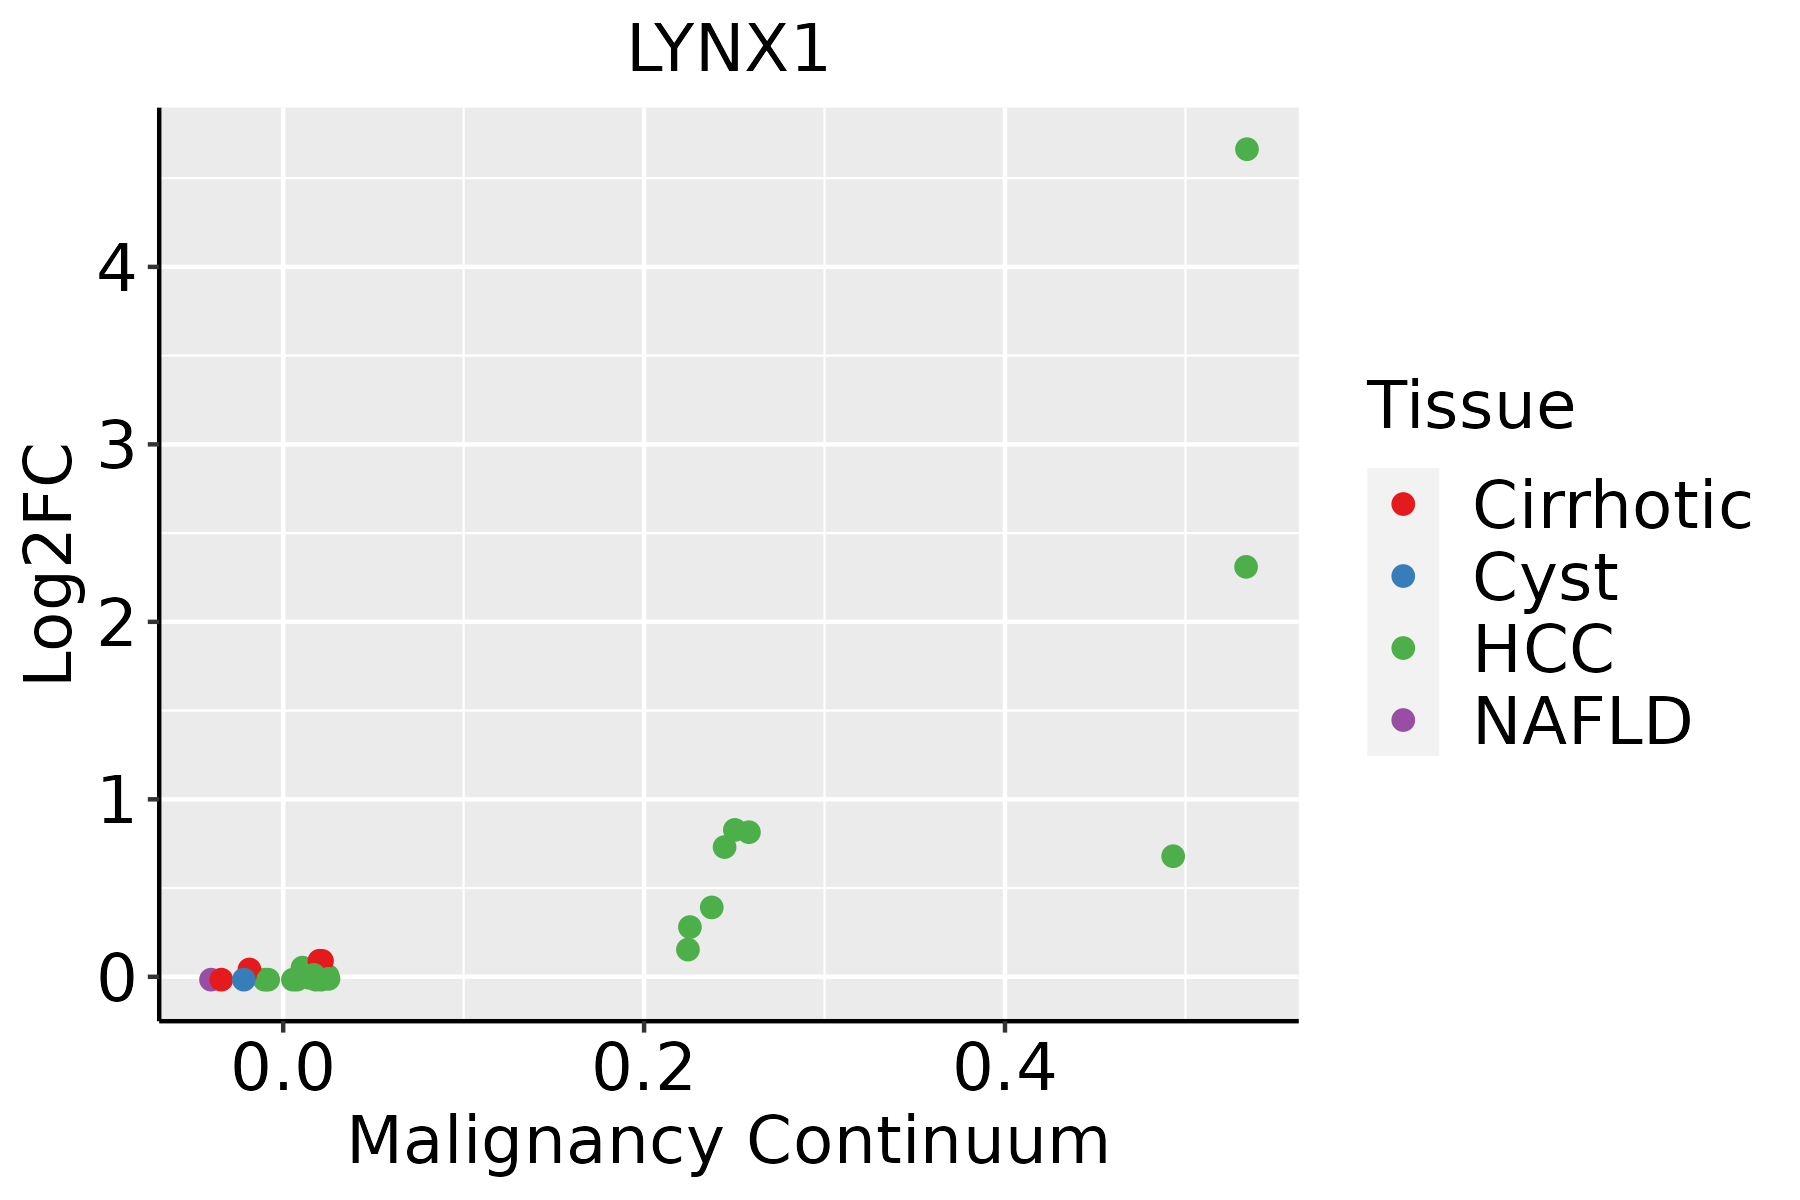 | HCC: Hepatocellular carcinoma |
| NAFLD: Non-alcoholic fatty liver disease | ||
| Oral Cavity | 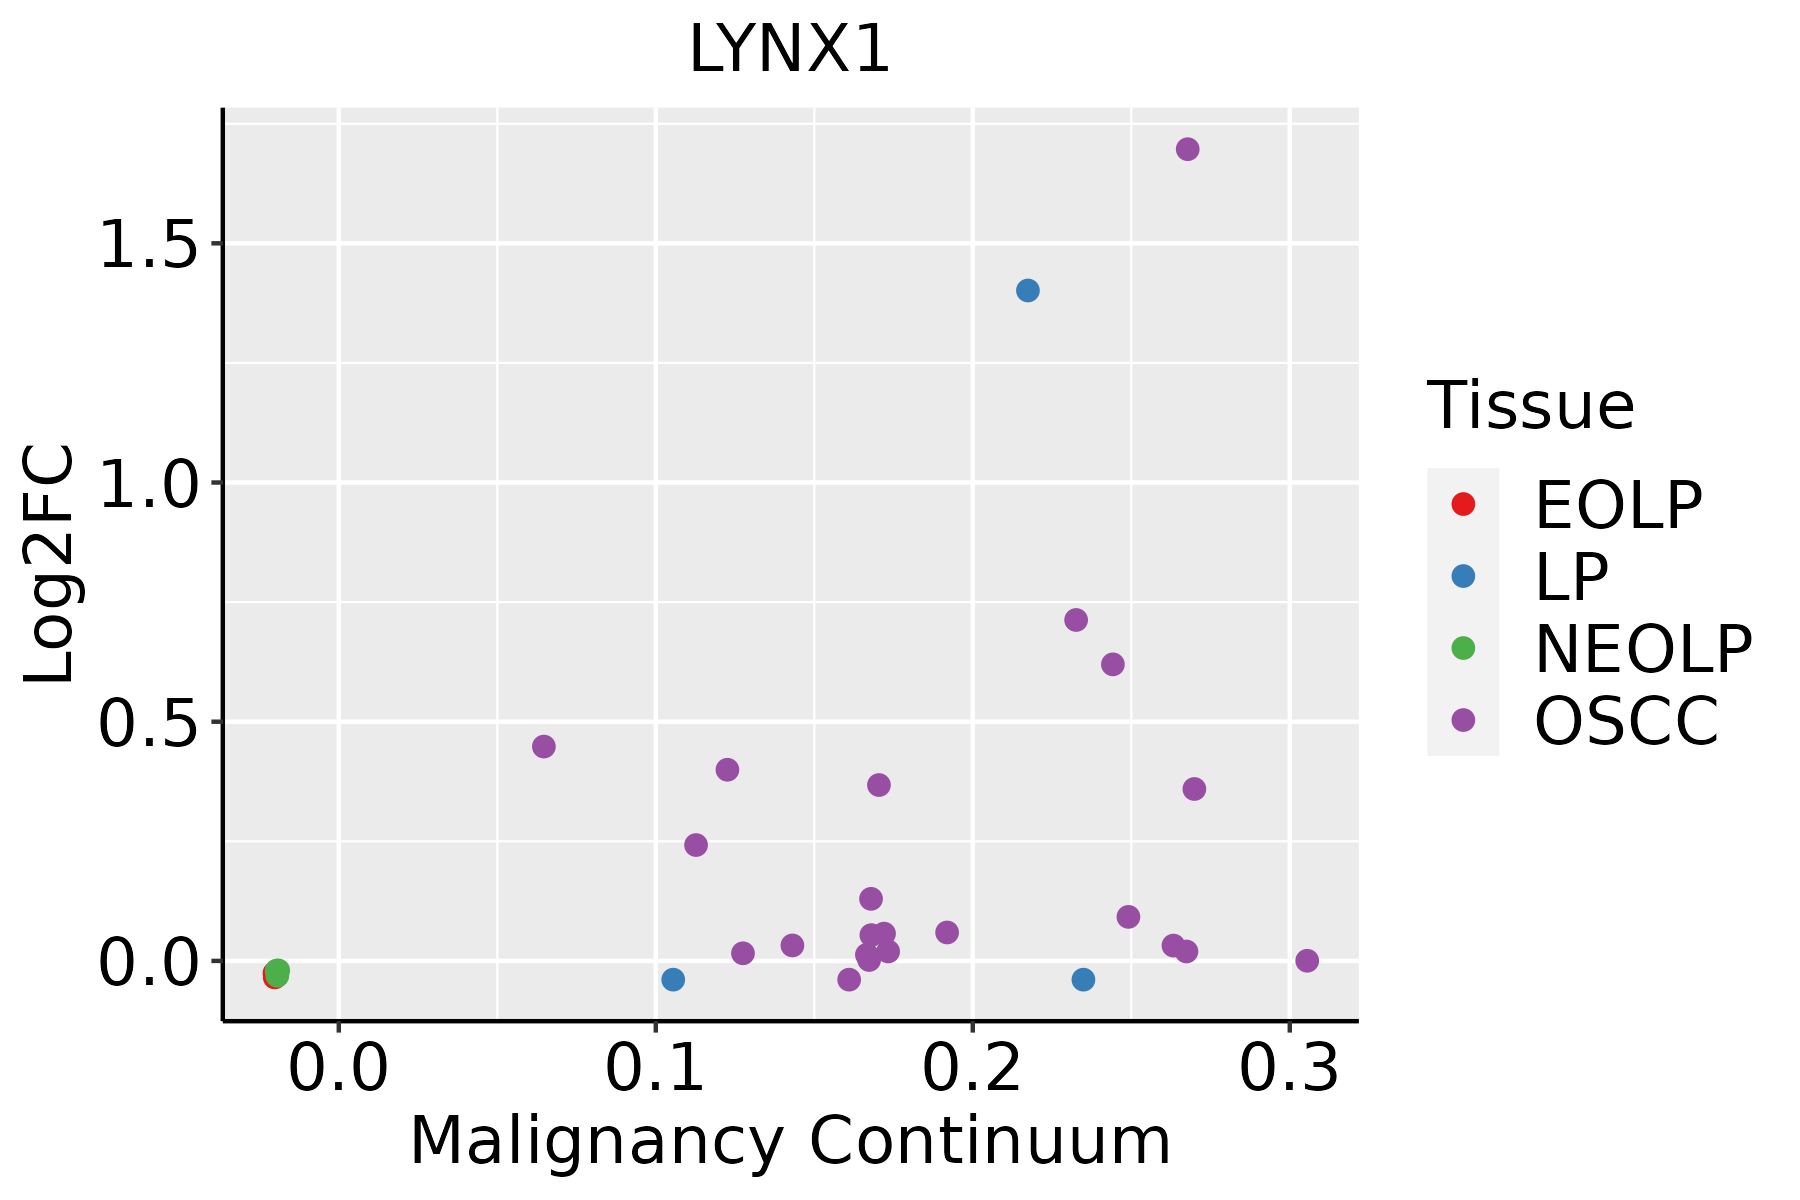 | EOLP: Erosive Oral lichen planus |
| LP: leukoplakia | ||
| NEOLP: Non-erosive oral lichen planus | ||
| OSCC: Oral squamous cell carcinoma |
| ∗log2FC in expression of this searched gene in stem-like cells from each diseased tissue sample relative to stem-like cells in normal samples in each tissue plotted against the malignancy continuum. Samples are colored based on if they are from different disease stage. |
Top |
Malignant transformation related pathway analysis |
| Find out the enriched GO biological processes and KEGG pathways involved in transition from healthy to precancer to cancer |
| Tissue | Disease Stage | Enriched GO biological Processes |
| Colorectum | AD |  |
| Colorectum | SER |  |
| Colorectum | MSS |  |
| Colorectum | MSI-H |  |
| Colorectum | FAP |  |
| ∗Top 15 enriched GO BP terms are showed in the bar plot of each disease state in each tissue. Each row represents a significant GO biological process which is colored according to the -log10(p.adjust). |
| Page: 1 2 3 4 5 6 7 8 9 |
| GO ID | Tissue | Disease Stage | Description | Gene Ratio | Bg Ratio | pvalue | p.adjust | Count |
| Page: 1 |
| Pathway ID | Tissue | Disease Stage | Description | Gene Ratio | Bg Ratio | pvalue | p.adjust | qvalue | Count |
| Page: 1 |
Top |
Cell-cell communication analysis |
| Identification of potential cell-cell interactions between two cell types and their ligand-receptor pairs for different disease states |
| Ligand | Receptor | LRpair | Pathway | Tissue | Disease Stage |
| Page: 1 |
Top |
Single-cell gene regulatory network inference analysis |
| Find out the significant the regulons (TFs) and the target genes of each regulon across cell types for different disease states |
| TF | Cell Type | Tissue | Disease Stage | Target Gene | RSS | Regulon Activity |
| ∗The dot plots of a searched regulon are shown for all cell subpopulations in each disease state of each tissue based on the regulon specific score inferred using pySCENIC and by calculating the average expression. |
| Page: 1 |
Top |
Somatic mutation of malignant transformation related genes |
| Annotation of somatic variants for genes involved in malignant transformation |
| Hugo Symbol | Variant Class | Variant Classification | dbSNP RS | HGVSc | HGVSp | HGVSp Short | SWISSPROT | BIOTYPE | SIFT | PolyPhen | Tumor Sample Barcode | Tissue | Histology | Sex | Age | Stage | Therapy Types | Drugs | Outcome |
| LYNX1 | SNV | Missense_Mutation | novel | c.322N>A | p.Leu108Ile | p.L108I | Q9BZG9 | protein_coding | tolerated(0.21) | benign(0.014) | TCGA-2W-A8YY-01 | Cervix | cervical & endocervical cancer | Female | <65 | I/II | Chemotherapy | cisplatin | CR |
| LYNX1 | SNV | Missense_Mutation | novel | c.226N>A | p.Pro76Thr | p.P76T | Q9BZG9 | protein_coding | tolerated(0.54) | benign(0.042) | TCGA-DS-A7WH-01 | Cervix | cervical & endocervical cancer | Female | <65 | I/II | Chemotherapy | cisplatin | CR |
| LYNX1 | SNV | Missense_Mutation | novel | c.154N>C | p.Thr52Pro | p.T52P | Q9BZG9 | protein_coding | tolerated(0.06) | probably_damaging(0.999) | TCGA-5M-AAT6-01 | Colorectum | colon adenocarcinoma | Female | <65 | III/IV | Unknown | Unknown | PD |
| LYNX1 | SNV | Missense_Mutation | rs148469903 | c.148N>T | p.Arg50Cys | p.R50C | Q9BZG9 | protein_coding | deleterious(0) | probably_damaging(0.998) | TCGA-AA-3947-01 | Colorectum | colon adenocarcinoma | Female | <65 | I/II | Unknown | Unknown | SD |
| LYNX1 | SNV | Missense_Mutation | rs753679195 | c.119C>T | p.Pro40Leu | p.P40L | Q9BZG9 | protein_coding | tolerated(0.12) | probably_damaging(0.999) | TCGA-AA-A02K-01 | Colorectum | colon adenocarcinoma | Male | <65 | III/IV | Chemotherapy | folinic | PD |
| LYNX1 | SNV | Missense_Mutation | rs756554170 | c.218N>G | p.Tyr73Cys | p.Y73C | Q9BZG9 | protein_coding | tolerated(0.06) | probably_damaging(0.988) | TCGA-CK-5916-01 | Colorectum | colon adenocarcinoma | Female | >=65 | I/II | Unknown | Unknown | PD |
| LYNX1 | deletion | Frame_Shift_Del | c.165delN | p.Thr56ProfsTer3 | p.T56Pfs*3 | Q9BZG9 | protein_coding | TCGA-AA-3663-01 | Colorectum | colon adenocarcinoma | Male | <65 | I/II | Unknown | Unknown | SD | |||
| LYNX1 | SNV | Missense_Mutation | rs145430405 | c.250N>A | p.Val84Ile | p.V84I | Q9BZG9 | protein_coding | deleterious(0.01) | possibly_damaging(0.864) | TCGA-A5-A0G1-01 | Endometrium | uterine corpus endometrioid carcinoma | Female | >=65 | I/II | Unknown | Unknown | SD |
| LYNX1 | SNV | Missense_Mutation | rs878949291 | c.212C>T | p.Thr71Ile | p.T71I | Q9BZG9 | protein_coding | deleterious(0) | probably_damaging(0.998) | TCGA-A5-A1OF-01 | Endometrium | uterine corpus endometrioid carcinoma | Female | <65 | I/II | Unknown | Unknown | SD |
| LYNX1 | SNV | Missense_Mutation | c.187N>C | p.Ser63Pro | p.S63P | Q9BZG9 | protein_coding | tolerated(0.09) | probably_damaging(0.998) | TCGA-AP-A059-01 | Endometrium | uterine corpus endometrioid carcinoma | Female | >=65 | I/II | Unknown | Unknown | SD |
| Page: 1 2 3 |
Top |
Related drugs of malignant transformation related genes |
| Identification of chemicals and drugs interact with genes involved in malignant transfromation |
| (DGIdb 4.0) |
| Entrez ID | Symbol | Category | Interaction Types | Drug Claim Name | Drug Name | PMIDs |
| Page: 1 |

Copyright 2023-Present -The University of Texas Health Science Center at Houston |