
|
|||||
|
 | |
| |
| |
| |
| |
| |
|
Gene: LY96 |
Gene summary for LY96 |
| Gene information | Species | Human | Gene symbol | LY96 | Gene ID | 23643 |
| Gene name | lymphocyte antigen 96 | |
| Gene Alias | ESOP-1 | |
| Cytomap | 8q21.11 | |
| Gene Type | protein-coding | GO ID | GO:0001816 | UniProtAcc | Q9Y6Y9 |
Top |
Malignant transformation analysis |
| Identification of the aberrant gene expression in precancerous and cancerous lesions by comparing the gene expression of stem-like cells in diseased tissues with normal stem cells |
| Entrez ID | Symbol | Replicates | Species | Organ | Tissue | Adj P-value | Log2FC | Malignancy |
| 23643 | LY96 | LZE4T | Human | Esophagus | ESCC | 5.17e-11 | 3.48e-01 | 0.0811 |
| 23643 | LY96 | LZE8T | Human | Esophagus | ESCC | 5.64e-09 | 1.60e-01 | 0.067 |
| 23643 | LY96 | LZE24T | Human | Esophagus | ESCC | 9.06e-10 | 1.65e-01 | 0.0596 |
| 23643 | LY96 | P4T-E | Human | Esophagus | ESCC | 1.23e-14 | 3.63e-01 | 0.1323 |
| 23643 | LY96 | P5T-E | Human | Esophagus | ESCC | 8.53e-09 | 2.12e-01 | 0.1327 |
| 23643 | LY96 | P8T-E | Human | Esophagus | ESCC | 3.86e-13 | 2.84e-01 | 0.0889 |
| 23643 | LY96 | P9T-E | Human | Esophagus | ESCC | 1.51e-03 | 2.06e-01 | 0.1131 |
| 23643 | LY96 | P11T-E | Human | Esophagus | ESCC | 2.94e-06 | 3.09e-01 | 0.1426 |
| 23643 | LY96 | P12T-E | Human | Esophagus | ESCC | 2.51e-02 | 9.82e-02 | 0.1122 |
| 23643 | LY96 | P15T-E | Human | Esophagus | ESCC | 3.65e-03 | 1.06e-01 | 0.1149 |
| 23643 | LY96 | P19T-E | Human | Esophagus | ESCC | 3.48e-07 | 3.94e-01 | 0.1662 |
| 23643 | LY96 | P20T-E | Human | Esophagus | ESCC | 4.49e-02 | 2.11e-02 | 0.1124 |
| 23643 | LY96 | P21T-E | Human | Esophagus | ESCC | 1.55e-08 | 1.38e-01 | 0.1617 |
| 23643 | LY96 | P23T-E | Human | Esophagus | ESCC | 2.87e-06 | 1.81e-01 | 0.108 |
| 23643 | LY96 | P26T-E | Human | Esophagus | ESCC | 2.38e-05 | 1.11e-01 | 0.1276 |
| 23643 | LY96 | P27T-E | Human | Esophagus | ESCC | 1.33e-11 | 1.51e-01 | 0.1055 |
| 23643 | LY96 | P31T-E | Human | Esophagus | ESCC | 8.17e-10 | 2.19e-01 | 0.1251 |
| 23643 | LY96 | P37T-E | Human | Esophagus | ESCC | 7.86e-10 | 1.39e-01 | 0.1371 |
| 23643 | LY96 | P38T-E | Human | Esophagus | ESCC | 1.95e-02 | 1.20e-01 | 0.127 |
| 23643 | LY96 | P44T-E | Human | Esophagus | ESCC | 5.20e-05 | 1.75e-01 | 0.1096 |
| Page: 1 2 3 4 |
| Tissue | Expression Dynamics | Abbreviation |
| Esophagus |  | ESCC: Esophageal squamous cell carcinoma |
| HGIN: High-grade intraepithelial neoplasias | ||
| LGIN: Low-grade intraepithelial neoplasias | ||
| Liver | 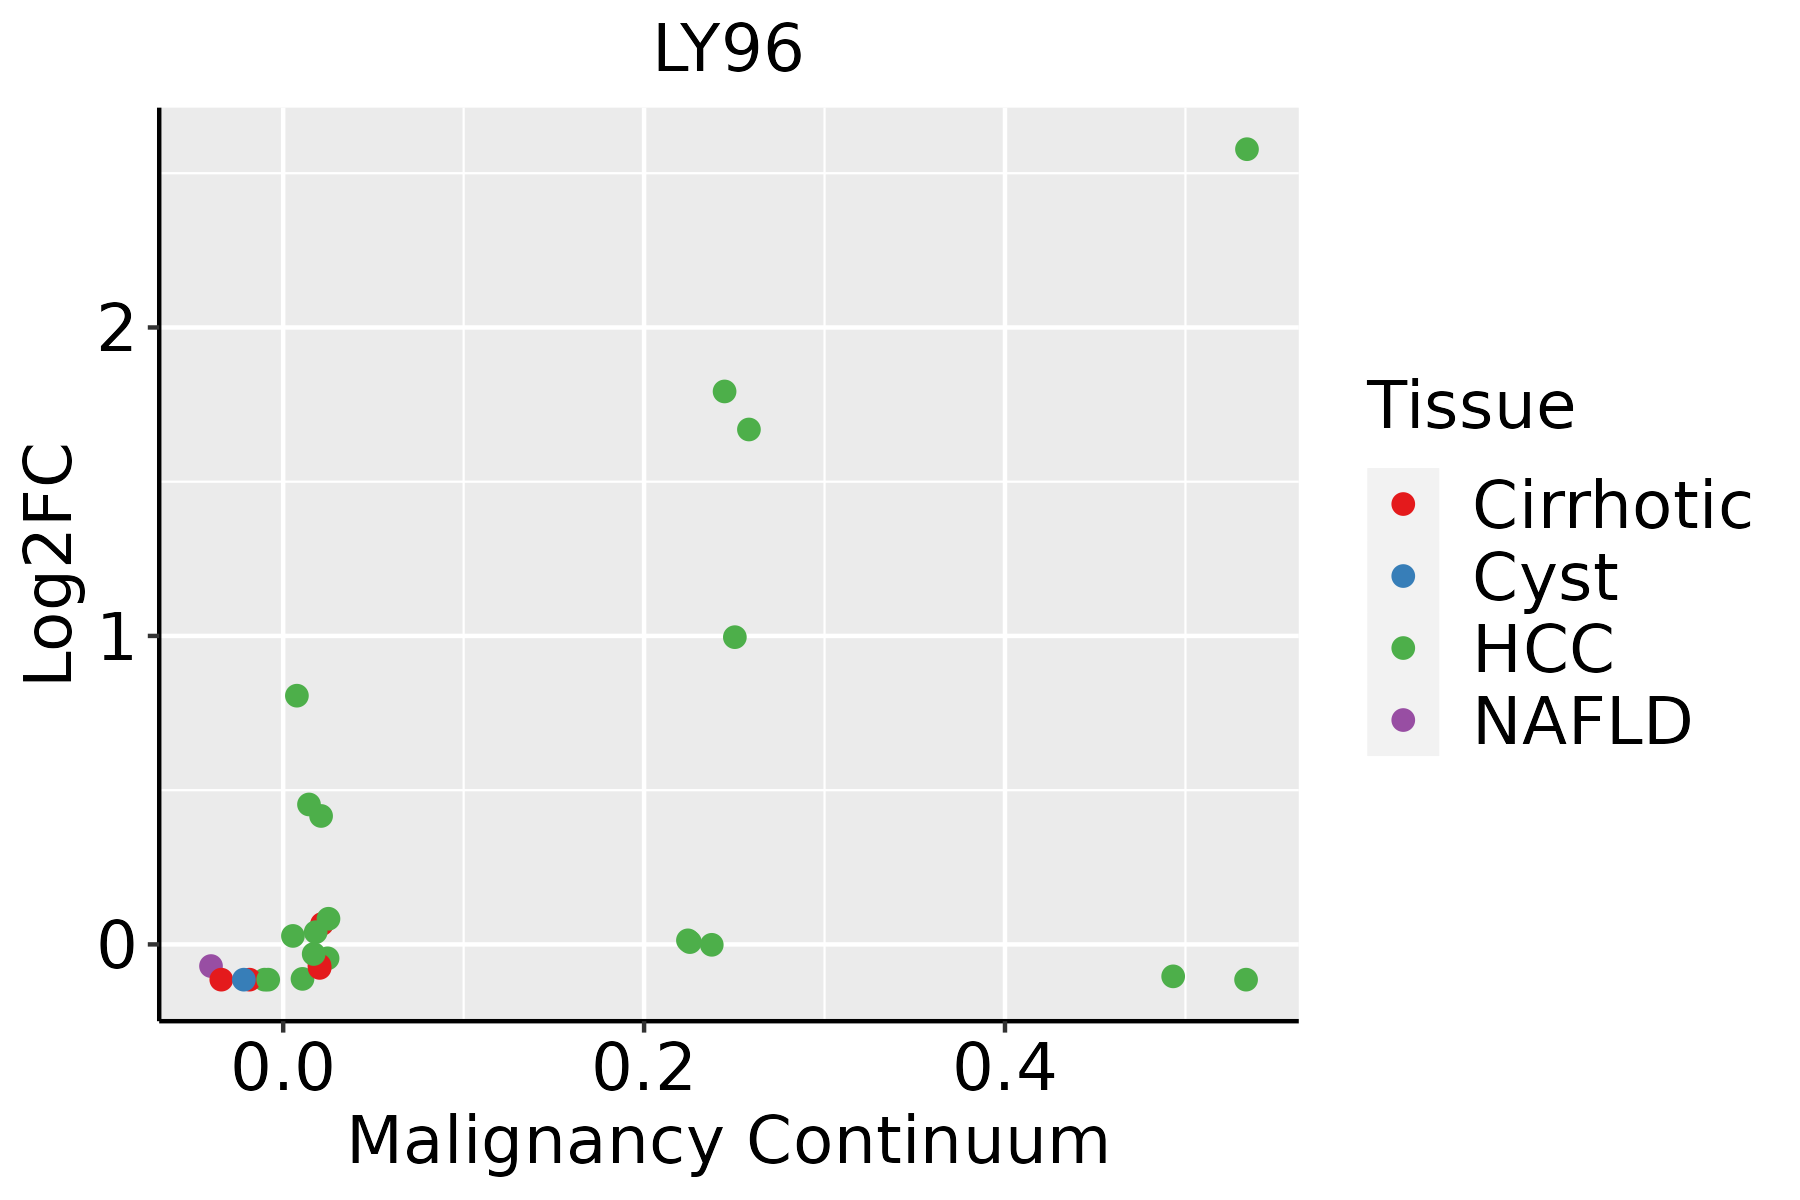 | HCC: Hepatocellular carcinoma |
| NAFLD: Non-alcoholic fatty liver disease | ||
| Oral Cavity |  | EOLP: Erosive Oral lichen planus |
| LP: leukoplakia | ||
| NEOLP: Non-erosive oral lichen planus | ||
| OSCC: Oral squamous cell carcinoma | ||
| Thyroid | 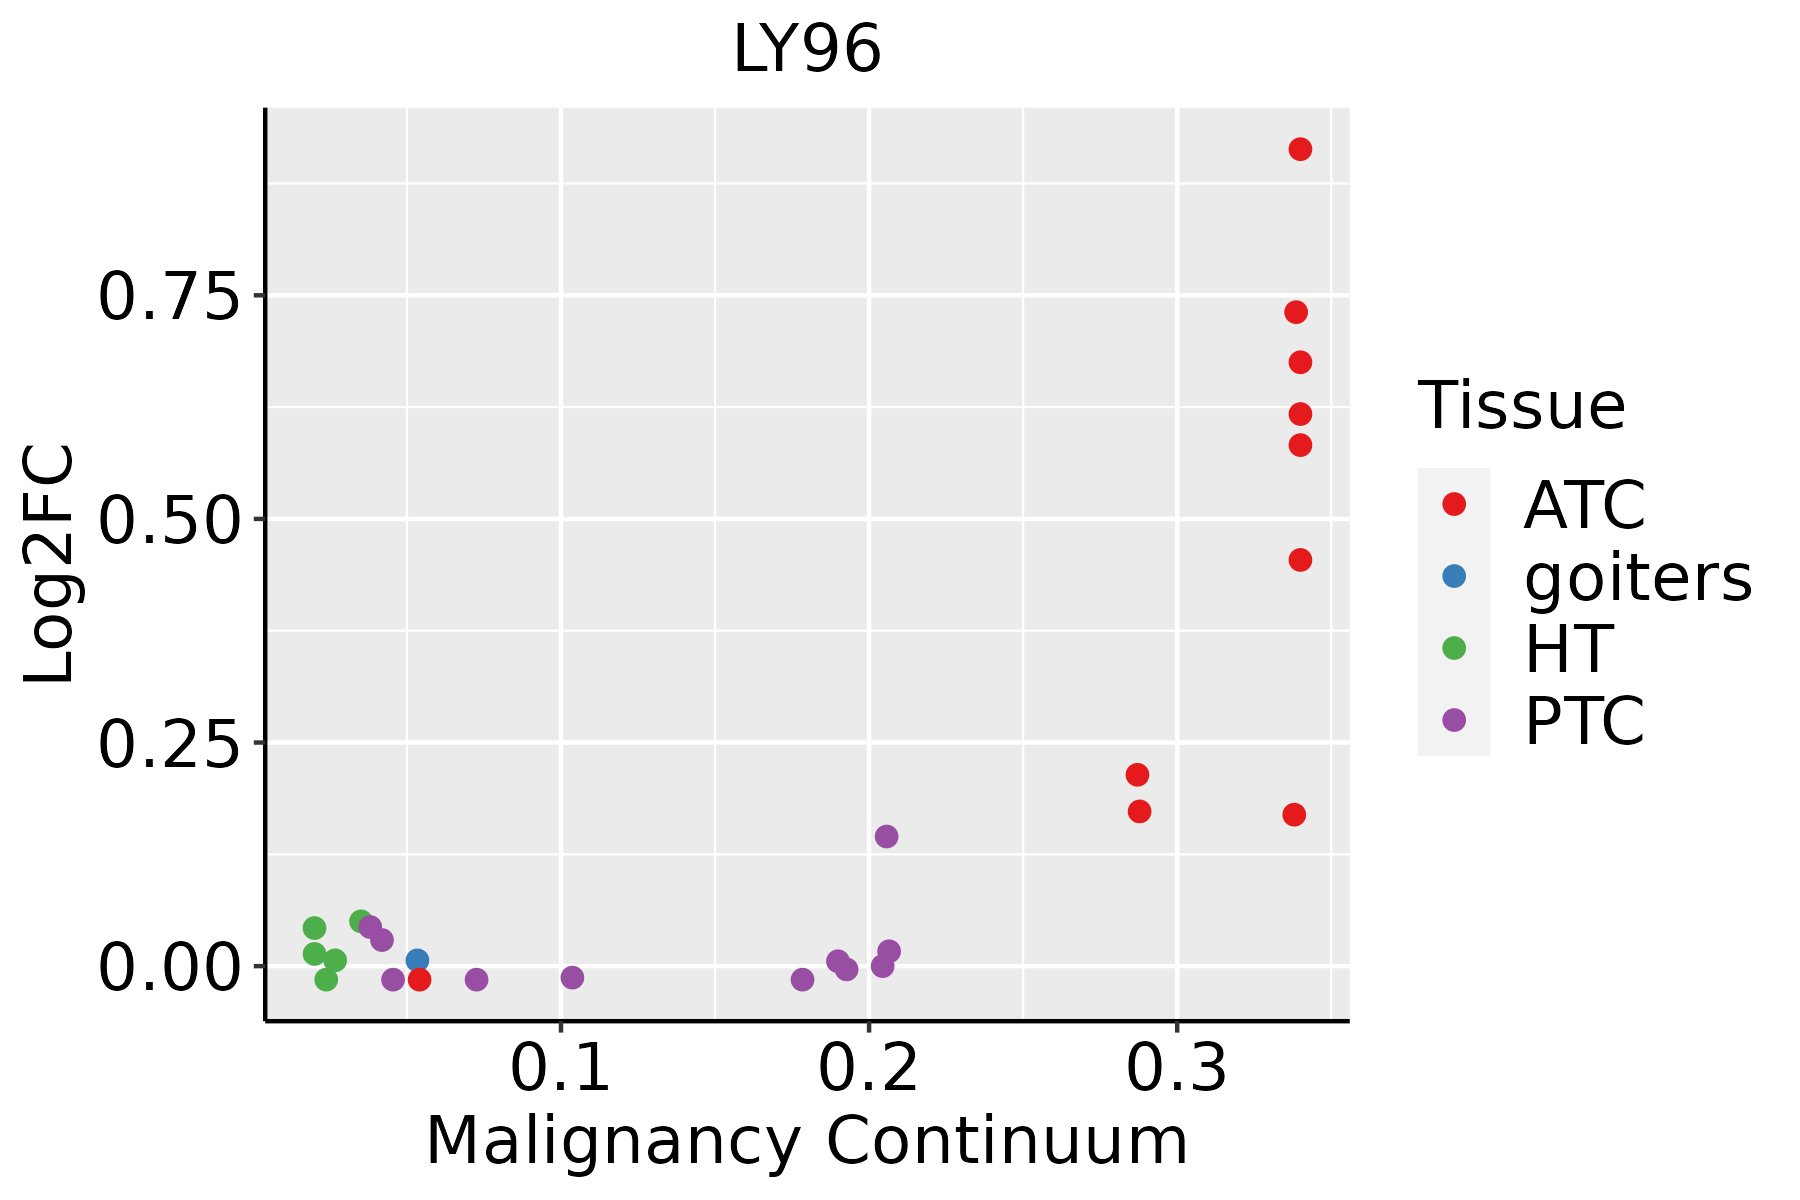 | ATC: Anaplastic thyroid cancer |
| HT: Hashimoto's thyroiditis | ||
| PTC: Papillary thyroid cancer |
| ∗log2FC in expression of this searched gene in stem-like cells from each diseased tissue sample relative to stem-like cells in normal samples in each tissue plotted against the malignancy continuum. Samples are colored based on if they are from different disease stage. |
Top |
Malignant transformation related pathway analysis |
| Find out the enriched GO biological processes and KEGG pathways involved in transition from healthy to precancer to cancer |
| Tissue | Disease Stage | Enriched GO biological Processes |
| Colorectum | AD |  |
| Colorectum | SER |  |
| Colorectum | MSS |  |
| Colorectum | MSI-H |  |
| Colorectum | FAP |  |
| ∗Top 15 enriched GO BP terms are showed in the bar plot of each disease state in each tissue. Each row represents a significant GO biological process which is colored according to the -log10(p.adjust). |
| Page: 1 2 3 4 5 6 7 8 9 |
| GO ID | Tissue | Disease Stage | Description | Gene Ratio | Bg Ratio | pvalue | p.adjust | Count |
| GO:00028318 | Esophagus | ESCC | regulation of response to biotic stimulus | 191/8552 | 327/18723 | 2.12e-06 | 2.45e-05 | 191 |
| GO:003249619 | Esophagus | ESCC | response to lipopolysaccharide | 191/8552 | 343/18723 | 1.11e-04 | 7.73e-04 | 191 |
| GO:000223719 | Esophagus | ESCC | response to molecule of bacterial origin | 194/8552 | 363/18723 | 1.64e-03 | 7.61e-03 | 194 |
| GO:000181916 | Esophagus | ESCC | positive regulation of cytokine production | 244/8552 | 467/18723 | 2.29e-03 | 1.01e-02 | 244 |
| GO:007122215 | Esophagus | ESCC | cellular response to lipopolysaccharide | 113/8552 | 209/18723 | 8.79e-03 | 3.10e-02 | 113 |
| GO:00316633 | Esophagus | ESCC | lipopolysaccharide-mediated signaling pathway | 37/8552 | 60/18723 | 9.17e-03 | 3.19e-02 | 37 |
| GO:007121617 | Esophagus | ESCC | cellular response to biotic stimulus | 131/8552 | 246/18723 | 9.85e-03 | 3.39e-02 | 131 |
| GO:00324966 | Liver | Cirrhotic | response to lipopolysaccharide | 111/4634 | 343/18723 | 8.15e-04 | 5.95e-03 | 111 |
| GO:00321032 | Liver | Cirrhotic | positive regulation of response to external stimulus | 131/4634 | 427/18723 | 2.90e-03 | 1.66e-02 | 131 |
| GO:00022376 | Liver | Cirrhotic | response to molecule of bacterial origin | 113/4634 | 363/18723 | 3.23e-03 | 1.81e-02 | 113 |
| GO:00028311 | Liver | Cirrhotic | regulation of response to biotic stimulus | 101/4634 | 327/18723 | 6.58e-03 | 3.25e-02 | 101 |
| GO:00022211 | Liver | HCC | pattern recognition receptor signaling pathway | 107/7958 | 172/18723 | 1.37e-07 | 2.58e-06 | 107 |
| GO:00028312 | Liver | HCC | regulation of response to biotic stimulus | 173/7958 | 327/18723 | 8.55e-05 | 7.48e-04 | 173 |
| GO:003249611 | Liver | HCC | response to lipopolysaccharide | 174/7958 | 343/18723 | 1.19e-03 | 6.62e-03 | 174 |
| GO:00712166 | Liver | HCC | cellular response to biotic stimulus | 128/7958 | 246/18723 | 1.53e-03 | 8.10e-03 | 128 |
| GO:00712226 | Liver | HCC | cellular response to lipopolysaccharide | 110/7958 | 209/18723 | 1.92e-03 | 9.77e-03 | 110 |
| GO:000223711 | Liver | HCC | response to molecule of bacterial origin | 181/7958 | 363/18723 | 2.58e-03 | 1.24e-02 | 181 |
| GO:0002224 | Liver | HCC | toll-like receptor signaling pathway | 67/7958 | 121/18723 | 2.87e-03 | 1.34e-02 | 67 |
| GO:0031663 | Liver | HCC | lipopolysaccharide-mediated signaling pathway | 36/7958 | 60/18723 | 4.68e-03 | 2.01e-02 | 36 |
| GO:00712196 | Liver | HCC | cellular response to molecule of bacterial origin | 113/7958 | 221/18723 | 5.73e-03 | 2.38e-02 | 113 |
| Page: 1 2 3 |
| Pathway ID | Tissue | Disease Stage | Description | Gene Ratio | Bg Ratio | pvalue | p.adjust | qvalue | Count |
| hsa05132211 | Esophagus | ESCC | Salmonella infection | 191/4205 | 249/8465 | 6.51e-19 | 5.45e-17 | 2.79e-17 | 191 |
| hsa05417211 | Esophagus | ESCC | Lipid and atherosclerosis | 143/4205 | 215/8465 | 3.30e-07 | 2.45e-06 | 1.26e-06 | 143 |
| hsa0514525 | Esophagus | ESCC | Toxoplasmosis | 76/4205 | 112/8465 | 6.83e-05 | 2.90e-04 | 1.48e-04 | 76 |
| hsa040645 | Esophagus | ESCC | NF-kappa B signaling pathway | 67/4205 | 104/8465 | 1.62e-03 | 4.89e-03 | 2.50e-03 | 67 |
| hsa051339 | Esophagus | ESCC | Pertussis | 48/4205 | 76/8465 | 1.21e-02 | 2.77e-02 | 1.42e-02 | 48 |
| hsa05132310 | Esophagus | ESCC | Salmonella infection | 191/4205 | 249/8465 | 6.51e-19 | 5.45e-17 | 2.79e-17 | 191 |
| hsa05417310 | Esophagus | ESCC | Lipid and atherosclerosis | 143/4205 | 215/8465 | 3.30e-07 | 2.45e-06 | 1.26e-06 | 143 |
| hsa05145111 | Esophagus | ESCC | Toxoplasmosis | 76/4205 | 112/8465 | 6.83e-05 | 2.90e-04 | 1.48e-04 | 76 |
| hsa0406412 | Esophagus | ESCC | NF-kappa B signaling pathway | 67/4205 | 104/8465 | 1.62e-03 | 4.89e-03 | 2.50e-03 | 67 |
| hsa0513314 | Esophagus | ESCC | Pertussis | 48/4205 | 76/8465 | 1.21e-02 | 2.77e-02 | 1.42e-02 | 48 |
| hsa0513222 | Liver | Cirrhotic | Salmonella infection | 121/2530 | 249/8465 | 2.47e-10 | 5.13e-09 | 3.16e-09 | 121 |
| hsa0514512 | Liver | Cirrhotic | Toxoplasmosis | 47/2530 | 112/8465 | 4.16e-03 | 1.63e-02 | 1.00e-02 | 47 |
| hsa0513232 | Liver | Cirrhotic | Salmonella infection | 121/2530 | 249/8465 | 2.47e-10 | 5.13e-09 | 3.16e-09 | 121 |
| hsa0514513 | Liver | Cirrhotic | Toxoplasmosis | 47/2530 | 112/8465 | 4.16e-03 | 1.63e-02 | 1.00e-02 | 47 |
| hsa0513242 | Liver | HCC | Salmonella infection | 178/4020 | 249/8465 | 5.90e-15 | 1.98e-13 | 1.10e-13 | 178 |
| hsa049362 | Liver | HCC | Alcoholic liver disease | 89/4020 | 142/8465 | 1.73e-04 | 8.53e-04 | 4.75e-04 | 89 |
| hsa0514521 | Liver | HCC | Toxoplasmosis | 70/4020 | 112/8465 | 9.25e-04 | 3.52e-03 | 1.96e-03 | 70 |
| hsa051332 | Liver | HCC | Pertussis | 48/4020 | 76/8465 | 4.17e-03 | 1.27e-02 | 7.06e-03 | 48 |
| hsa0541742 | Liver | HCC | Lipid and atherosclerosis | 118/4020 | 215/8465 | 1.66e-02 | 3.92e-02 | 2.18e-02 | 118 |
| hsa0513252 | Liver | HCC | Salmonella infection | 178/4020 | 249/8465 | 5.90e-15 | 1.98e-13 | 1.10e-13 | 178 |
| Page: 1 2 3 |
Top |
Cell-cell communication analysis |
| Identification of potential cell-cell interactions between two cell types and their ligand-receptor pairs for different disease states |
| Ligand | Receptor | LRpair | Pathway | Tissue | Disease Stage |
| Page: 1 |
Top |
Single-cell gene regulatory network inference analysis |
| Find out the significant the regulons (TFs) and the target genes of each regulon across cell types for different disease states |
| TF | Cell Type | Tissue | Disease Stage | Target Gene | RSS | Regulon Activity |
| ∗The dot plots of a searched regulon are shown for all cell subpopulations in each disease state of each tissue based on the regulon specific score inferred using pySCENIC and by calculating the average expression. |
| Page: 1 |
Top |
Somatic mutation of malignant transformation related genes |
| Annotation of somatic variants for genes involved in malignant transformation |
| Hugo Symbol | Variant Class | Variant Classification | dbSNP RS | HGVSc | HGVSp | HGVSp Short | SWISSPROT | BIOTYPE | SIFT | PolyPhen | Tumor Sample Barcode | Tissue | Histology | Sex | Age | Stage | Therapy Types | Drugs | Outcome |
| LY96 | SNV | Missense_Mutation | c.363N>A | p.Phe121Leu | p.F121L | Q9Y6Y9 | protein_coding | tolerated(0.4) | possibly_damaging(0.525) | TCGA-C5-A1MK-01 | Cervix | cervical & endocervical cancer | Female | >=65 | III/IV | Chemotherapy | carboplatin | PD | |
| LY96 | SNV | Missense_Mutation | rs868086563 | c.353N>T | p.Ser118Leu | p.S118L | Q9Y6Y9 | protein_coding | tolerated(0.09) | benign(0.042) | TCGA-UC-A7PD-01 | Cervix | cervical & endocervical cancer | Female | <65 | I/II | Unknown | Unknown | PD |
| LY96 | SNV | Missense_Mutation | c.268N>T | p.Arg90Cys | p.R90C | Q9Y6Y9 | protein_coding | deleterious(0.02) | probably_damaging(0.999) | TCGA-AA-3930-01 | Colorectum | colon adenocarcinoma | Male | >=65 | III/IV | Chemotherapy | capecitabine | PD | |
| LY96 | SNV | Missense_Mutation | novel | c.104N>G | p.Thr35Ser | p.T35S | Q9Y6Y9 | protein_coding | tolerated(0.36) | benign(0.034) | TCGA-AA-3947-01 | Colorectum | colon adenocarcinoma | Female | <65 | I/II | Unknown | Unknown | SD |
| LY96 | SNV | Missense_Mutation | c.373A>C | p.Lys125Gln | p.K125Q | Q9Y6Y9 | protein_coding | tolerated(0.28) | benign(0.033) | TCGA-AA-A00N-01 | Colorectum | colon adenocarcinoma | Male | >=65 | I/II | Unknown | Unknown | PD | |
| LY96 | insertion | Frame_Shift_Ins | novel | c.22dupT | p.Ser8PhefsTer10 | p.S8Ffs*10 | Q9Y6Y9 | protein_coding | TCGA-NH-A8F7-06 | Colorectum | NA | NA | NA | NA | NA | NA | NA | ||
| LY96 | SNV | Missense_Mutation | novel | c.208N>A | p.Asp70Asn | p.D70N | Q9Y6Y9 | protein_coding | deleterious(0.04) | possibly_damaging(0.679) | TCGA-A5-A0G1-01 | Endometrium | uterine corpus endometrioid carcinoma | Female | >=65 | I/II | Unknown | Unknown | SD |
| LY96 | SNV | Missense_Mutation | c.373N>C | p.Lys125Gln | p.K125Q | Q9Y6Y9 | protein_coding | tolerated(0.28) | benign(0.033) | TCGA-BS-A0TC-01 | Endometrium | uterine corpus endometrioid carcinoma | Female | >=65 | I/II | Unknown | Unknown | SD | |
| LY96 | SNV | Missense_Mutation | c.268N>T | p.Arg90Cys | p.R90C | Q9Y6Y9 | protein_coding | deleterious(0.02) | probably_damaging(0.999) | TCGA-D1-A101-01 | Endometrium | uterine corpus endometrioid carcinoma | Female | <65 | I/II | Unknown | Unknown | SD | |
| LY96 | SNV | Missense_Mutation | c.373N>C | p.Lys125Gln | p.K125Q | Q9Y6Y9 | protein_coding | tolerated(0.28) | benign(0.033) | TCGA-D1-A16X-01 | Endometrium | uterine corpus endometrioid carcinoma | Female | <65 | I/II | Unknown | Unknown | SD |
| Page: 1 2 3 |
Top |
Related drugs of malignant transformation related genes |
| Identification of chemicals and drugs interact with genes involved in malignant transfromation |
| (DGIdb 4.0) |
| Entrez ID | Symbol | Category | Interaction Types | Drug Claim Name | Drug Name | PMIDs |
| 23643 | LY96 | DRUGGABLE GENOME | antagonist | CHEMBL3301672 | ERITORAN TETRASODIUM | |
| 23643 | LY96 | DRUGGABLE GENOME | agonist | 315661222 | ||
| 23643 | LY96 | DRUGGABLE GENOME | Tumor necrosis factor alpha (TNF-alpha) inhibitors | 28696418 | ||
| 23643 | LY96 | DRUGGABLE GENOME | inhibitor | 315661112 |
| Page: 1 |

Copyright 2023-Present -The University of Texas Health Science Center at Houston |