
|
|||||
|
 | |
| |
| |
| |
| |
| |
|
Gene: LY6K |
Gene summary for LY6K |
| Gene information | Species | Human | Gene symbol | LY6K | Gene ID | 54742 |
| Gene name | lymphocyte antigen 6 family member K | |
| Gene Alias | CT97 | |
| Cytomap | 8q24.3 | |
| Gene Type | protein-coding | GO ID | GO:0000003 | UniProtAcc | Q17RY6 |
Top |
Malignant transformation analysis |
| Identification of the aberrant gene expression in precancerous and cancerous lesions by comparing the gene expression of stem-like cells in diseased tissues with normal stem cells |
| Entrez ID | Symbol | Replicates | Species | Organ | Tissue | Adj P-value | Log2FC | Malignancy |
| 54742 | LY6K | GSM4909281 | Human | Breast | IDC | 7.57e-17 | 5.60e-01 | 0.21 |
| 54742 | LY6K | GSM4909282 | Human | Breast | IDC | 3.04e-26 | 7.00e-01 | -0.0288 |
| 54742 | LY6K | GSM4909286 | Human | Breast | IDC | 4.78e-10 | 2.37e-01 | 0.1081 |
| 54742 | LY6K | GSM4909294 | Human | Breast | IDC | 3.51e-04 | -1.28e-01 | 0.2022 |
| 54742 | LY6K | GSM4909297 | Human | Breast | IDC | 1.57e-03 | -1.21e-01 | 0.1517 |
| 54742 | LY6K | GSM4909301 | Human | Breast | IDC | 1.57e-03 | -1.28e-01 | 0.1577 |
| 54742 | LY6K | GSM4909311 | Human | Breast | IDC | 1.00e-07 | 3.35e-01 | 0.1534 |
| 54742 | LY6K | GSM4909312 | Human | Breast | IDC | 4.56e-16 | 6.63e-01 | 0.1552 |
| 54742 | LY6K | GSM4909315 | Human | Breast | IDC | 1.57e-03 | -1.28e-01 | 0.21 |
| 54742 | LY6K | GSM4909321 | Human | Breast | IDC | 3.51e-04 | -1.28e-01 | 0.1559 |
| 54742 | LY6K | brca3 | Human | Breast | Precancer | 2.22e-05 | 2.38e-01 | -0.0263 |
| 54742 | LY6K | NCCBC3 | Human | Breast | DCIS | 1.57e-03 | -1.28e-01 | 0.1198 |
| 54742 | LY6K | DCIS2 | Human | Breast | DCIS | 1.46e-04 | -5.84e-02 | 0.0085 |
| 54742 | LY6K | Tumor | Human | Cervix | CC | 1.60e-42 | 7.70e-01 | 0.1241 |
| 54742 | LY6K | sample1 | Human | Cervix | CC | 5.68e-08 | 5.44e-01 | 0.0959 |
| 54742 | LY6K | sample3 | Human | Cervix | CC | 2.95e-66 | 8.15e-01 | 0.1387 |
| 54742 | LY6K | T1 | Human | Cervix | CC | 1.13e-12 | 4.93e-01 | 0.0918 |
| 54742 | LY6K | T3 | Human | Cervix | CC | 6.12e-55 | 8.22e-01 | 0.1389 |
| 54742 | LY6K | LZE2T | Human | Esophagus | ESCC | 9.09e-08 | 1.11e+00 | 0.082 |
| 54742 | LY6K | LZE5T | Human | Esophagus | ESCC | 1.88e-05 | 7.05e-01 | 0.0514 |
| Page: 1 2 3 4 5 6 |
| Tissue | Expression Dynamics | Abbreviation |
| Breast |  | IDC: Invasive ductal carcinoma |
| DCIS: Ductal carcinoma in situ | ||
| Precancer(BRCA1-mut): Precancerous lesion from BRCA1 mutation carriers | ||
| Cervix |  | CC: Cervix cancer |
| HSIL_HPV: HPV-infected high-grade squamous intraepithelial lesions | ||
| N_HPV: HPV-infected normal cervix | ||
| Esophagus | 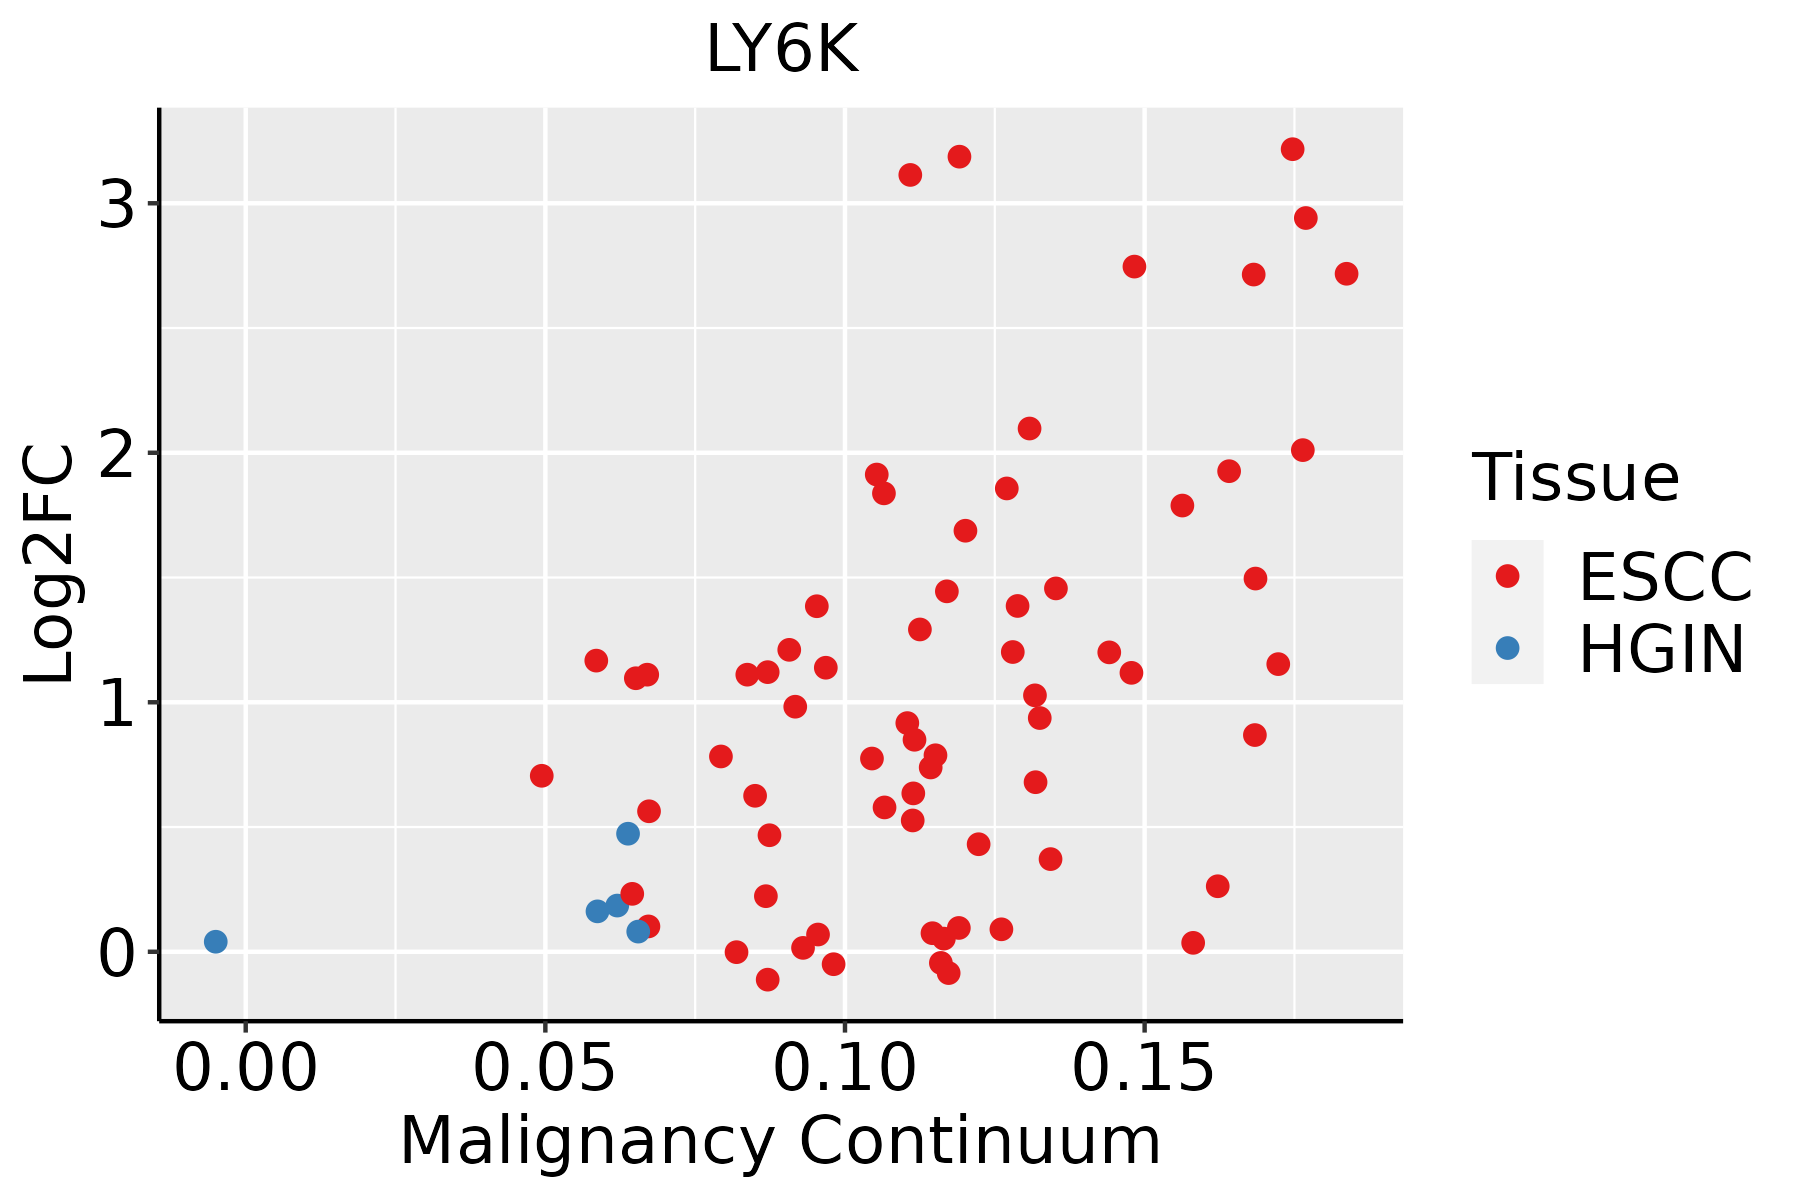 | ESCC: Esophageal squamous cell carcinoma |
| HGIN: High-grade intraepithelial neoplasias | ||
| LGIN: Low-grade intraepithelial neoplasias | ||
| Liver | 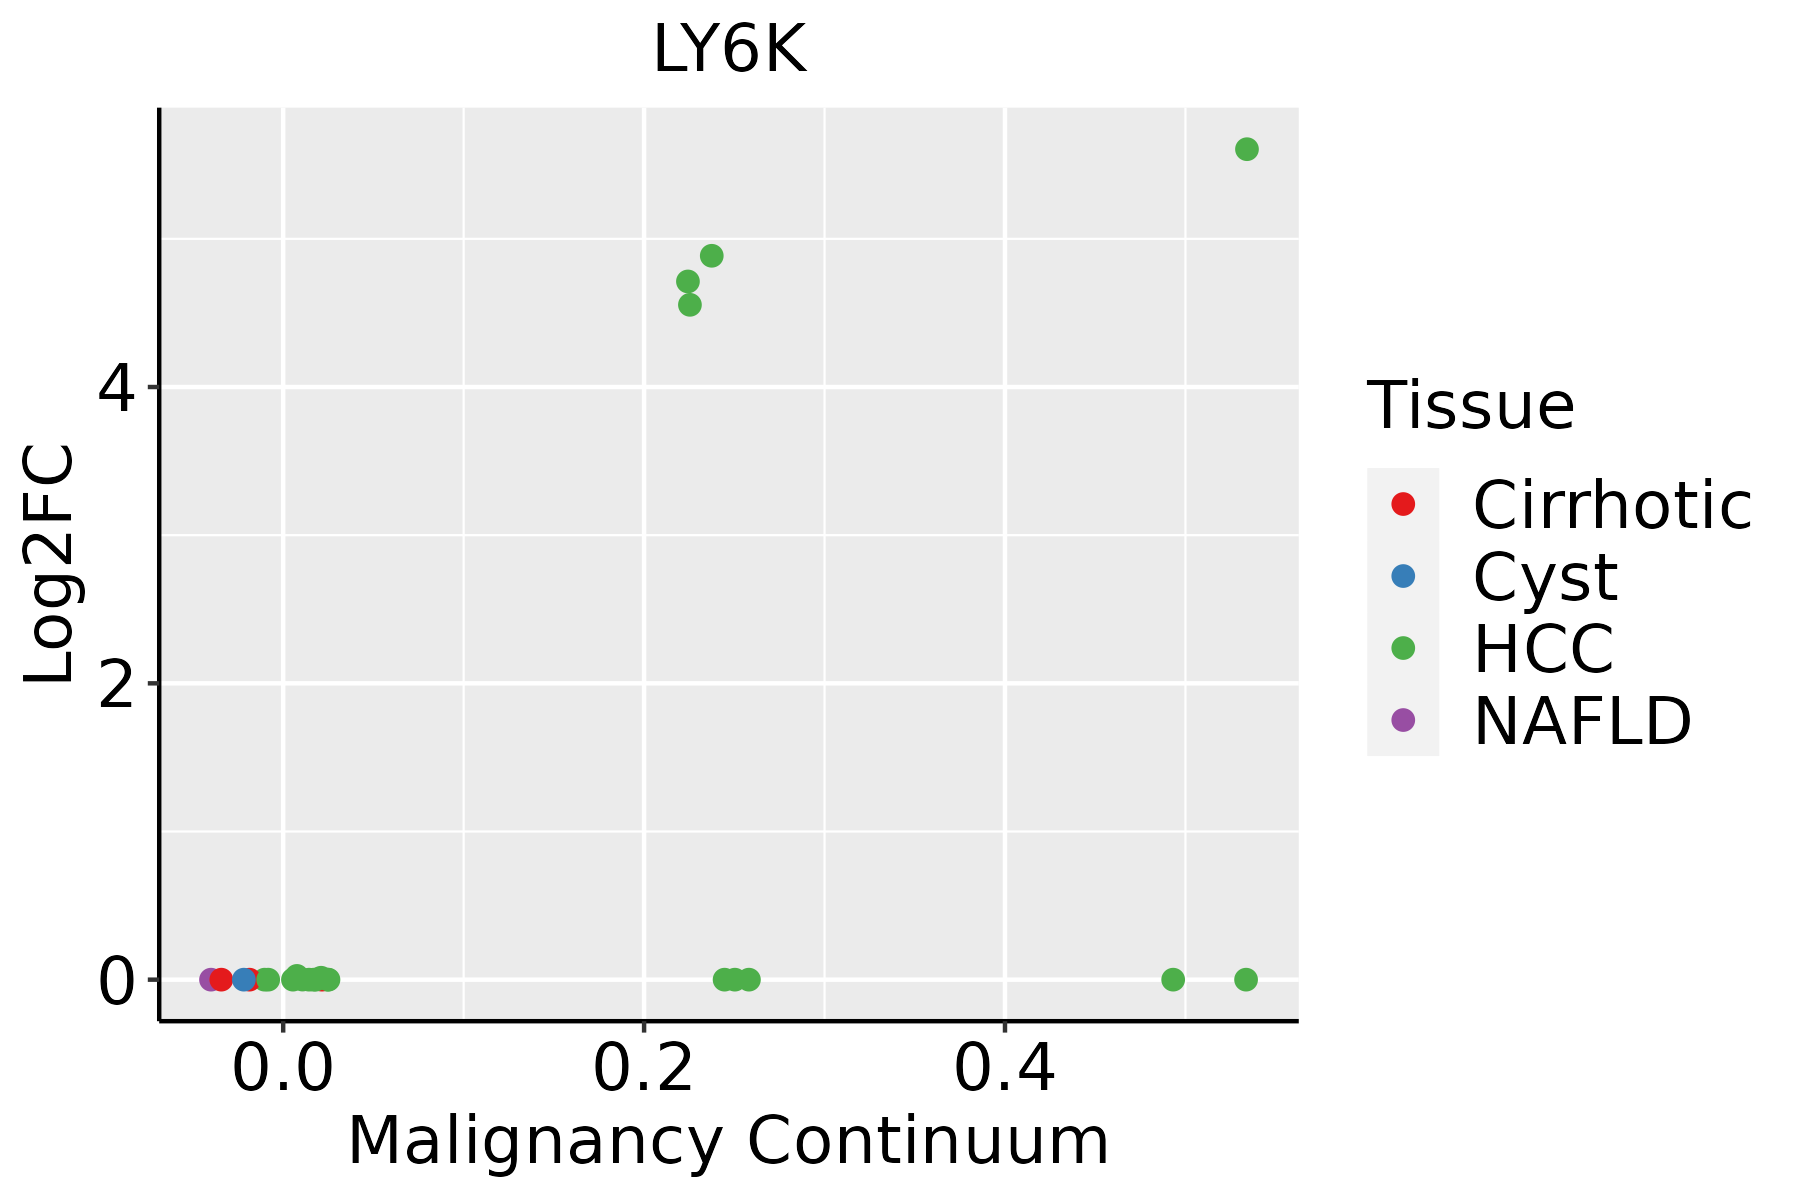 | HCC: Hepatocellular carcinoma |
| NAFLD: Non-alcoholic fatty liver disease | ||
| Oral Cavity | 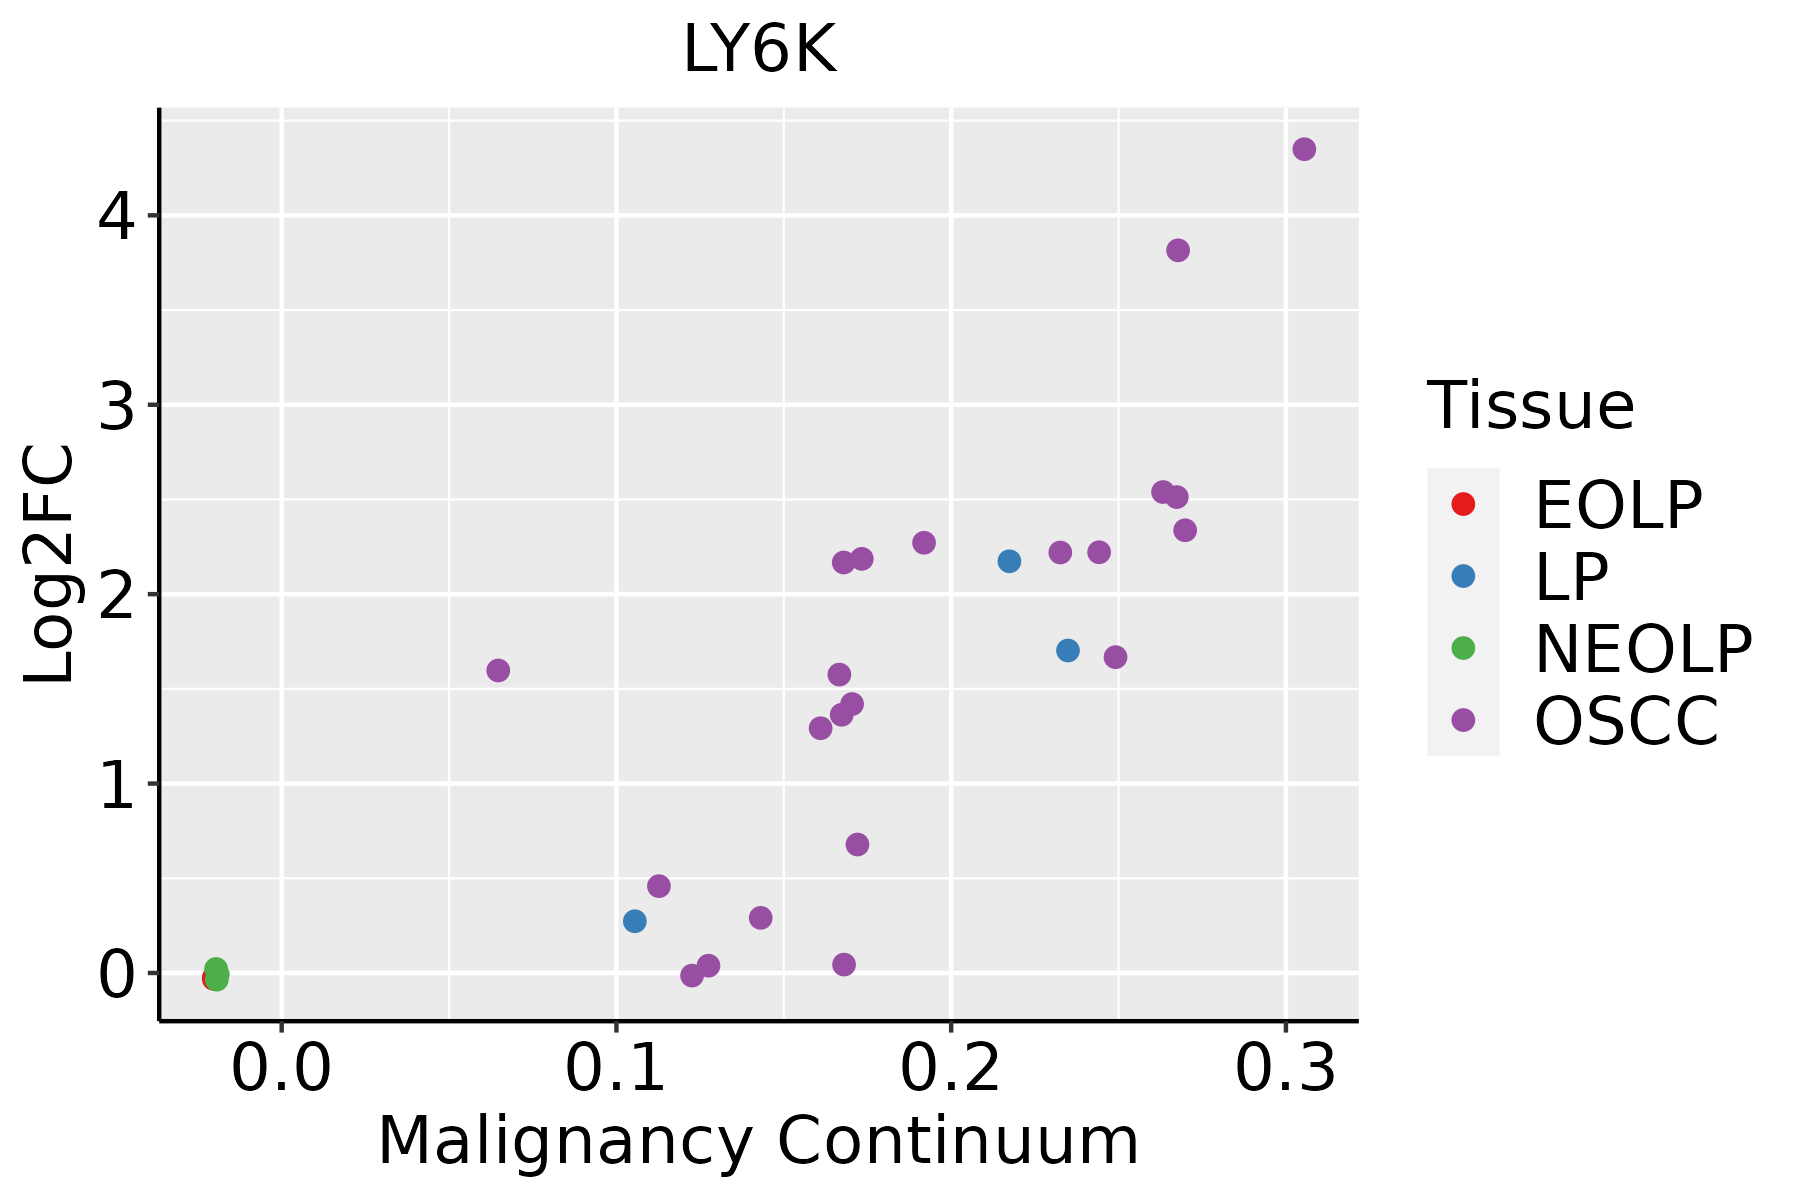 | EOLP: Erosive Oral lichen planus |
| LP: leukoplakia | ||
| NEOLP: Non-erosive oral lichen planus | ||
| OSCC: Oral squamous cell carcinoma | ||
| Skin | 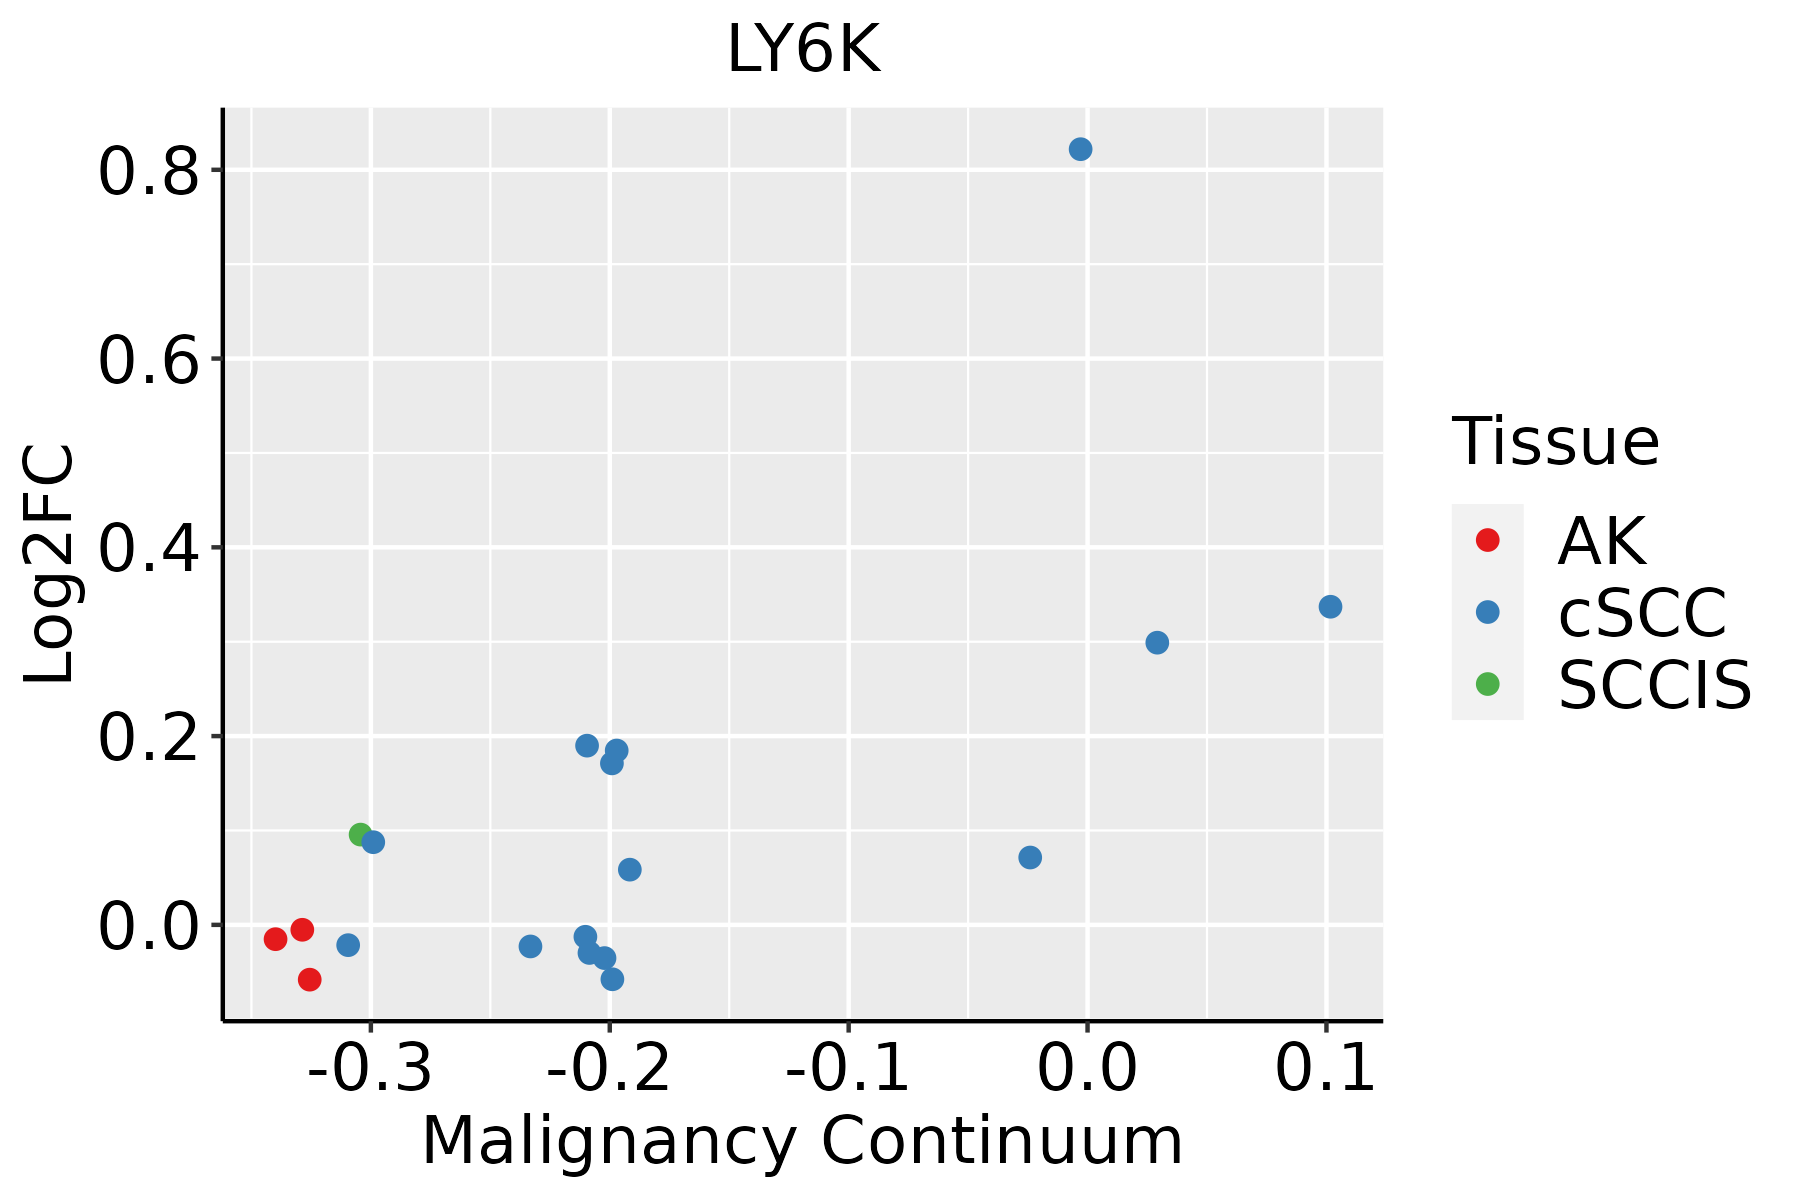 | AK: Actinic keratosis |
| cSCC: Cutaneous squamous cell carcinoma | ||
| SCCIS:squamous cell carcinoma in situ | ||
| Thyroid | 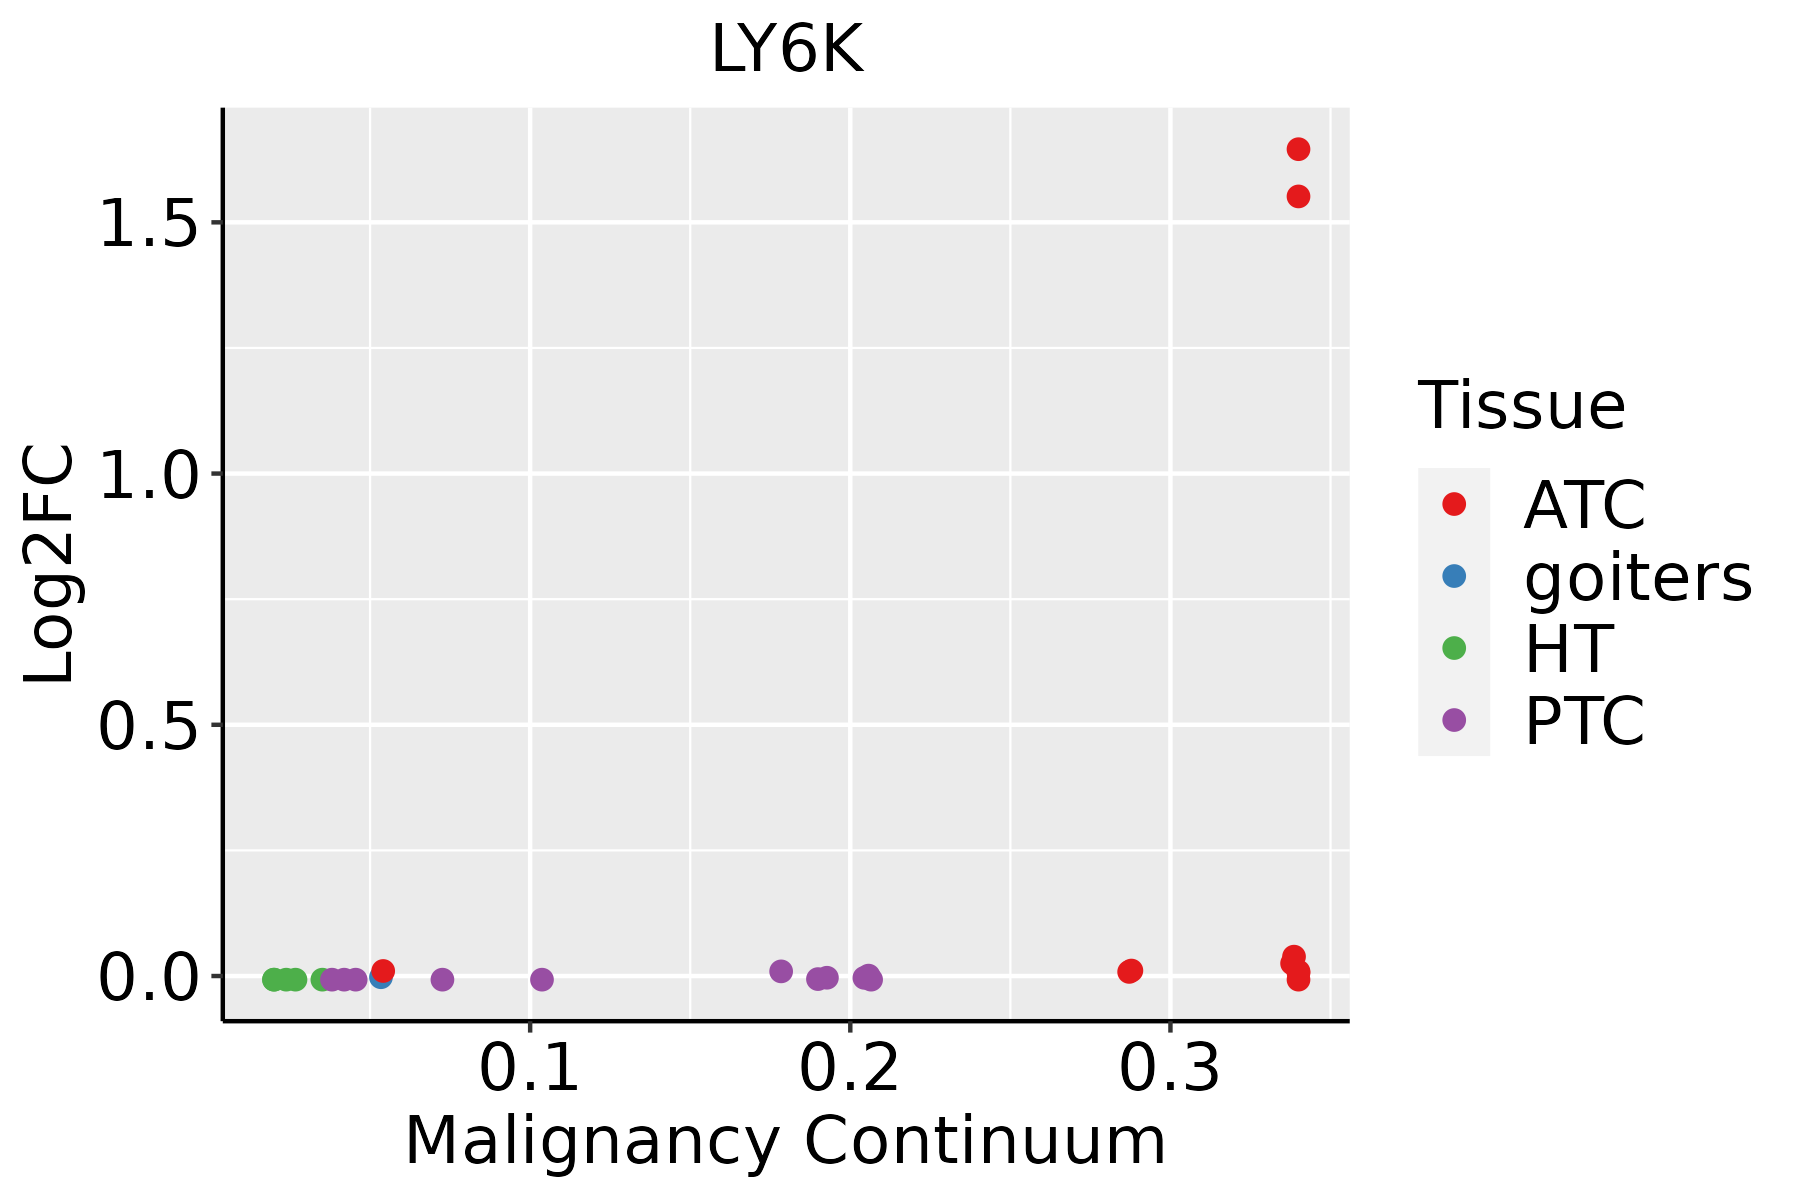 | ATC: Anaplastic thyroid cancer |
| HT: Hashimoto's thyroiditis | ||
| PTC: Papillary thyroid cancer |
| ∗log2FC in expression of this searched gene in stem-like cells from each diseased tissue sample relative to stem-like cells in normal samples in each tissue plotted against the malignancy continuum. Samples are colored based on if they are from different disease stage. |
Top |
Malignant transformation related pathway analysis |
| Find out the enriched GO biological processes and KEGG pathways involved in transition from healthy to precancer to cancer |
| Tissue | Disease Stage | Enriched GO biological Processes |
| Colorectum | AD |  |
| Colorectum | SER |  |
| Colorectum | MSS |  |
| Colorectum | MSI-H |  |
| Colorectum | FAP |  |
| ∗Top 15 enriched GO BP terms are showed in the bar plot of each disease state in each tissue. Each row represents a significant GO biological process which is colored according to the -log10(p.adjust). |
| Page: 1 2 3 4 5 6 7 8 9 |
| GO ID | Tissue | Disease Stage | Description | Gene Ratio | Bg Ratio | pvalue | p.adjust | Count |
| GO:0035036 | Breast | Precancer | sperm-egg recognition | 10/1080 | 48/18723 | 3.43e-04 | 4.81e-03 | 10 |
| GO:0007339 | Breast | Precancer | binding of sperm to zona pellucida | 9/1080 | 40/18723 | 3.69e-04 | 5.03e-03 | 9 |
| GO:0009988 | Breast | Precancer | cell-cell recognition | 12/1080 | 68/18723 | 4.63e-04 | 6.12e-03 | 12 |
| GO:00073391 | Breast | IDC | binding of sperm to zona pellucida | 9/1434 | 40/18723 | 2.76e-03 | 2.42e-02 | 9 |
| GO:00350361 | Breast | IDC | sperm-egg recognition | 10/1434 | 48/18723 | 3.00e-03 | 2.58e-02 | 10 |
| GO:00099881 | Breast | IDC | cell-cell recognition | 12/1434 | 68/18723 | 5.12e-03 | 3.82e-02 | 12 |
| GO:00073392 | Breast | DCIS | binding of sperm to zona pellucida | 9/1390 | 40/18723 | 2.23e-03 | 2.04e-02 | 9 |
| GO:00350362 | Breast | DCIS | sperm-egg recognition | 10/1390 | 48/18723 | 2.39e-03 | 2.16e-02 | 10 |
| GO:00099882 | Breast | DCIS | cell-cell recognition | 12/1390 | 68/18723 | 3.99e-03 | 3.17e-02 | 12 |
| Page: 1 |
| Pathway ID | Tissue | Disease Stage | Description | Gene Ratio | Bg Ratio | pvalue | p.adjust | qvalue | Count |
| Page: 1 |
Top |
Cell-cell communication analysis |
| Identification of potential cell-cell interactions between two cell types and their ligand-receptor pairs for different disease states |
| Ligand | Receptor | LRpair | Pathway | Tissue | Disease Stage |
| Page: 1 |
Top |
Single-cell gene regulatory network inference analysis |
| Find out the significant the regulons (TFs) and the target genes of each regulon across cell types for different disease states |
| TF | Cell Type | Tissue | Disease Stage | Target Gene | RSS | Regulon Activity |
| ∗The dot plots of a searched regulon are shown for all cell subpopulations in each disease state of each tissue based on the regulon specific score inferred using pySCENIC and by calculating the average expression. |
| Page: 1 |
Top |
Somatic mutation of malignant transformation related genes |
| Annotation of somatic variants for genes involved in malignant transformation |
| Hugo Symbol | Variant Class | Variant Classification | dbSNP RS | HGVSc | HGVSp | HGVSp Short | SWISSPROT | BIOTYPE | SIFT | PolyPhen | Tumor Sample Barcode | Tissue | Histology | Sex | Age | Stage | Therapy Types | Drugs | Outcome |
| LY6K | SNV | Missense_Mutation | c.389N>T | p.Ser130Leu | p.S130L | Q17RY6 | protein_coding | tolerated(0.16) | benign(0.025) | TCGA-E2-A1IN-01 | Breast | breast invasive carcinoma | Female | <65 | I/II | Hormone Therapy | arimidex | SD | |
| LY6K | insertion | Frame_Shift_Ins | novel | c.276_277insCATCCATTTTTAAATGAAAAATTAAGCTTTAATA | p.Glu93HisfsTer36 | p.E93Hfs*36 | Q17RY6 | protein_coding | TCGA-A8-A0A4-01 | Breast | breast invasive carcinoma | Female | >=65 | I/II | Hormone Therapy | tamoxiphen | CR | ||
| LY6K | SNV | Missense_Mutation | c.224N>G | p.Phe75Cys | p.F75C | Q17RY6 | protein_coding | deleterious(0) | probably_damaging(0.988) | TCGA-FU-A3HZ-01 | Cervix | cervical & endocervical cancer | Female | <65 | I/II | Chemotherapy | cisplatin | CR | |
| LY6K | SNV | Missense_Mutation | novel | c.68N>T | p.Ala23Val | p.A23V | Q17RY6 | protein_coding | tolerated(0.16) | benign(0.417) | TCGA-AA-3510-01 | Colorectum | colon adenocarcinoma | Male | >=65 | I/II | Unknown | Unknown | SD |
| LY6K | SNV | Missense_Mutation | rs782212141 | c.302G>A | p.Arg101Gln | p.R101Q | Q17RY6 | protein_coding | tolerated(0.57) | benign(0.003) | TCGA-AA-3845-01 | Colorectum | colon adenocarcinoma | Female | >=65 | I/II | Unknown | Unknown | PD |
| LY6K | SNV | Missense_Mutation | novel | c.305N>G | p.Phe102Cys | p.F102C | Q17RY6 | protein_coding | deleterious(0) | probably_damaging(0.998) | TCGA-AA-3984-01 | Colorectum | colon adenocarcinoma | Female | <65 | I/II | Unknown | Unknown | SD |
| LY6K | SNV | Missense_Mutation | novel | c.74N>C | p.Gln25Pro | p.Q25P | Q17RY6 | protein_coding | deleterious(0.03) | benign(0.065) | TCGA-CA-6717-01 | Colorectum | colon adenocarcinoma | Male | <65 | I/II | Chemotherapy | oxaliplatin | CR |
| LY6K | SNV | Missense_Mutation | c.29T>C | p.Val10Ala | p.V10A | Q17RY6 | protein_coding | tolerated_low_confidence(0.12) | benign(0.012) | TCGA-CK-6746-01 | Colorectum | colon adenocarcinoma | Female | >=65 | I/II | Unknown | Unknown | SD | |
| LY6K | SNV | Missense_Mutation | c.245C>T | p.Ala82Val | p.A82V | Q17RY6 | protein_coding | deleterious(0.01) | benign(0.031) | TCGA-D5-6930-01 | Colorectum | colon adenocarcinoma | Male | >=65 | I/II | Unknown | Unknown | SD | |
| LY6K | SNV | Missense_Mutation | c.245C>T | p.Ala82Val | p.A82V | Q17RY6 | protein_coding | deleterious(0.01) | benign(0.031) | TCGA-EI-6917-01 | Colorectum | rectum adenocarcinoma | Male | <65 | III/IV | Chemotherapy | 5fluorouracil+oxaciplatina+l-folinian | SD |
| Page: 1 2 3 |
Top |
Related drugs of malignant transformation related genes |
| Identification of chemicals and drugs interact with genes involved in malignant transfromation |
| (DGIdb 4.0) |
| Entrez ID | Symbol | Category | Interaction Types | Drug Claim Name | Drug Name | PMIDs |
| Page: 1 |

Copyright 2023-Present -The University of Texas Health Science Center at Houston |