
|
|||||
|
 | |
| |
| |
| |
| |
| |
|
Gene: LY6D |
Gene summary for LY6D |
| Gene information | Species | Human | Gene symbol | LY6D | Gene ID | 8581 |
| Gene name | lymphocyte antigen 6 family member D | |
| Gene Alias | E48 | |
| Cytomap | 8q24.3 | |
| Gene Type | protein-coding | GO ID | GO:0001775 | UniProtAcc | Q14210 |
Top |
Malignant transformation analysis |
| Identification of the aberrant gene expression in precancerous and cancerous lesions by comparing the gene expression of stem-like cells in diseased tissues with normal stem cells |
| Entrez ID | Symbol | Replicates | Species | Organ | Tissue | Adj P-value | Log2FC | Malignancy |
| 8581 | LY6D | CA_HPV_1 | Human | Cervix | CC | 3.70e-22 | -6.51e-01 | 0.0264 |
| 8581 | LY6D | HSIL_HPV_1 | Human | Cervix | HSIL_HPV | 1.33e-13 | -6.75e-01 | 0.0116 |
| 8581 | LY6D | N_HPV_1 | Human | Cervix | N_HPV | 4.83e-10 | -4.80e-01 | 0.0079 |
| 8581 | LY6D | N_HPV_2 | Human | Cervix | N_HPV | 3.95e-12 | 6.20e-01 | -0.0131 |
| 8581 | LY6D | Tumor | Human | Cervix | CC | 1.22e-183 | 1.75e+00 | 0.1241 |
| 8581 | LY6D | sample3 | Human | Cervix | CC | 7.25e-142 | 1.61e+00 | 0.1387 |
| 8581 | LY6D | H2 | Human | Cervix | HSIL_HPV | 4.11e-09 | -4.66e-01 | 0.0632 |
| 8581 | LY6D | L1 | Human | Cervix | CC | 2.10e-18 | 8.59e-01 | 0.0802 |
| 8581 | LY6D | T3 | Human | Cervix | CC | 8.84e-144 | 1.62e+00 | 0.1389 |
| 8581 | LY6D | LZE5T | Human | Esophagus | ESCC | 4.26e-16 | 2.22e+00 | 0.0514 |
| 8581 | LY6D | LZE8T | Human | Esophagus | ESCC | 7.09e-18 | 2.34e+00 | 0.067 |
| 8581 | LY6D | LZE20T | Human | Esophagus | ESCC | 1.42e-26 | 2.94e+00 | 0.0662 |
| 8581 | LY6D | LZE22D1 | Human | Esophagus | HGIN | 2.79e-03 | 4.04e-01 | 0.0595 |
| 8581 | LY6D | LZE22T | Human | Esophagus | ESCC | 1.43e-08 | 1.67e+00 | 0.068 |
| 8581 | LY6D | P1T-E | Human | Esophagus | ESCC | 7.60e-11 | 1.55e+00 | 0.0875 |
| 8581 | LY6D | P4T-E | Human | Esophagus | ESCC | 1.57e-07 | 1.31e+00 | 0.1323 |
| 8581 | LY6D | P5T-E | Human | Esophagus | ESCC | 2.02e-122 | 4.75e+00 | 0.1327 |
| 8581 | LY6D | P8T-E | Human | Esophagus | ESCC | 3.06e-78 | 3.39e+00 | 0.0889 |
| 8581 | LY6D | P11T-E | Human | Esophagus | ESCC | 3.63e-03 | 3.18e+00 | 0.1426 |
| 8581 | LY6D | P17T-E | Human | Esophagus | ESCC | 8.09e-03 | 6.22e-01 | 0.1278 |
| Page: 1 2 3 4 5 |
| Tissue | Expression Dynamics | Abbreviation |
| Cervix | 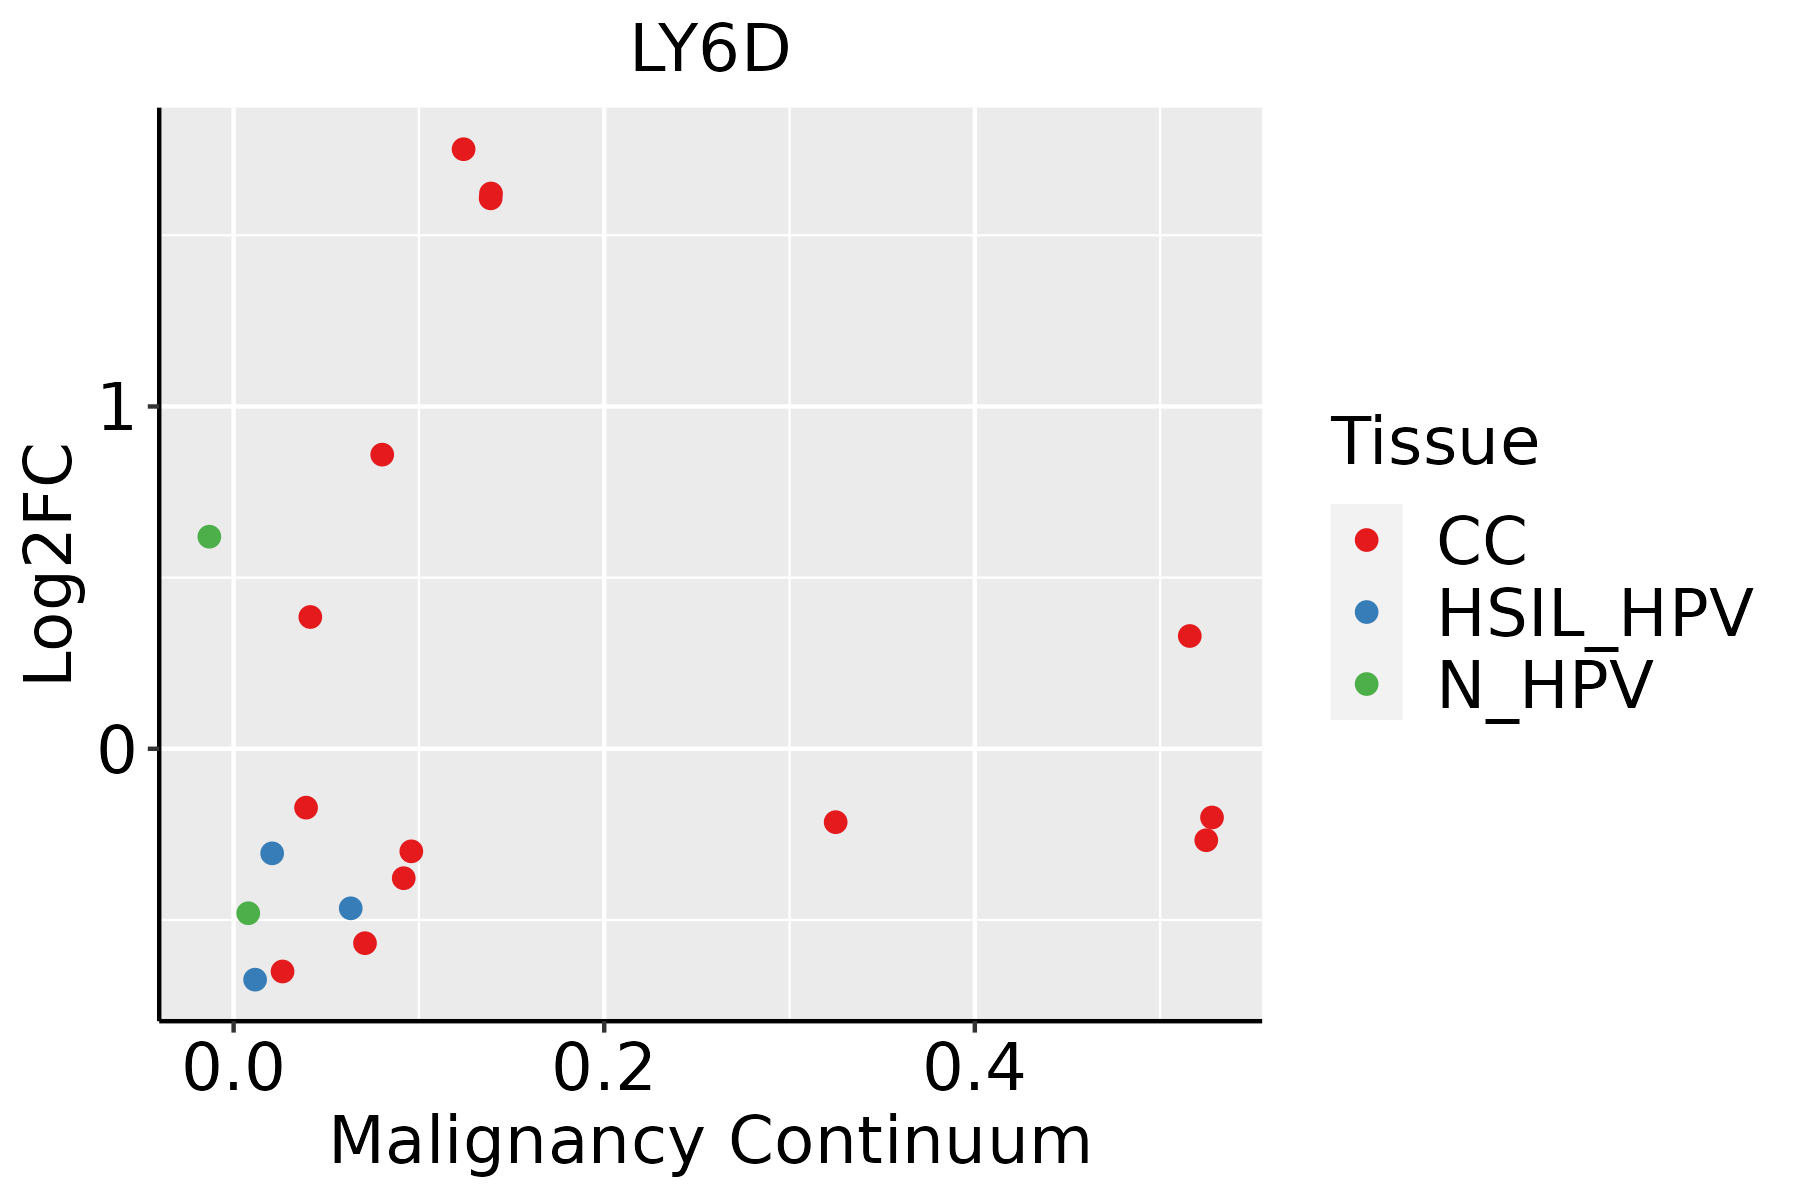 | CC: Cervix cancer |
| HSIL_HPV: HPV-infected high-grade squamous intraepithelial lesions | ||
| N_HPV: HPV-infected normal cervix | ||
| Esophagus | 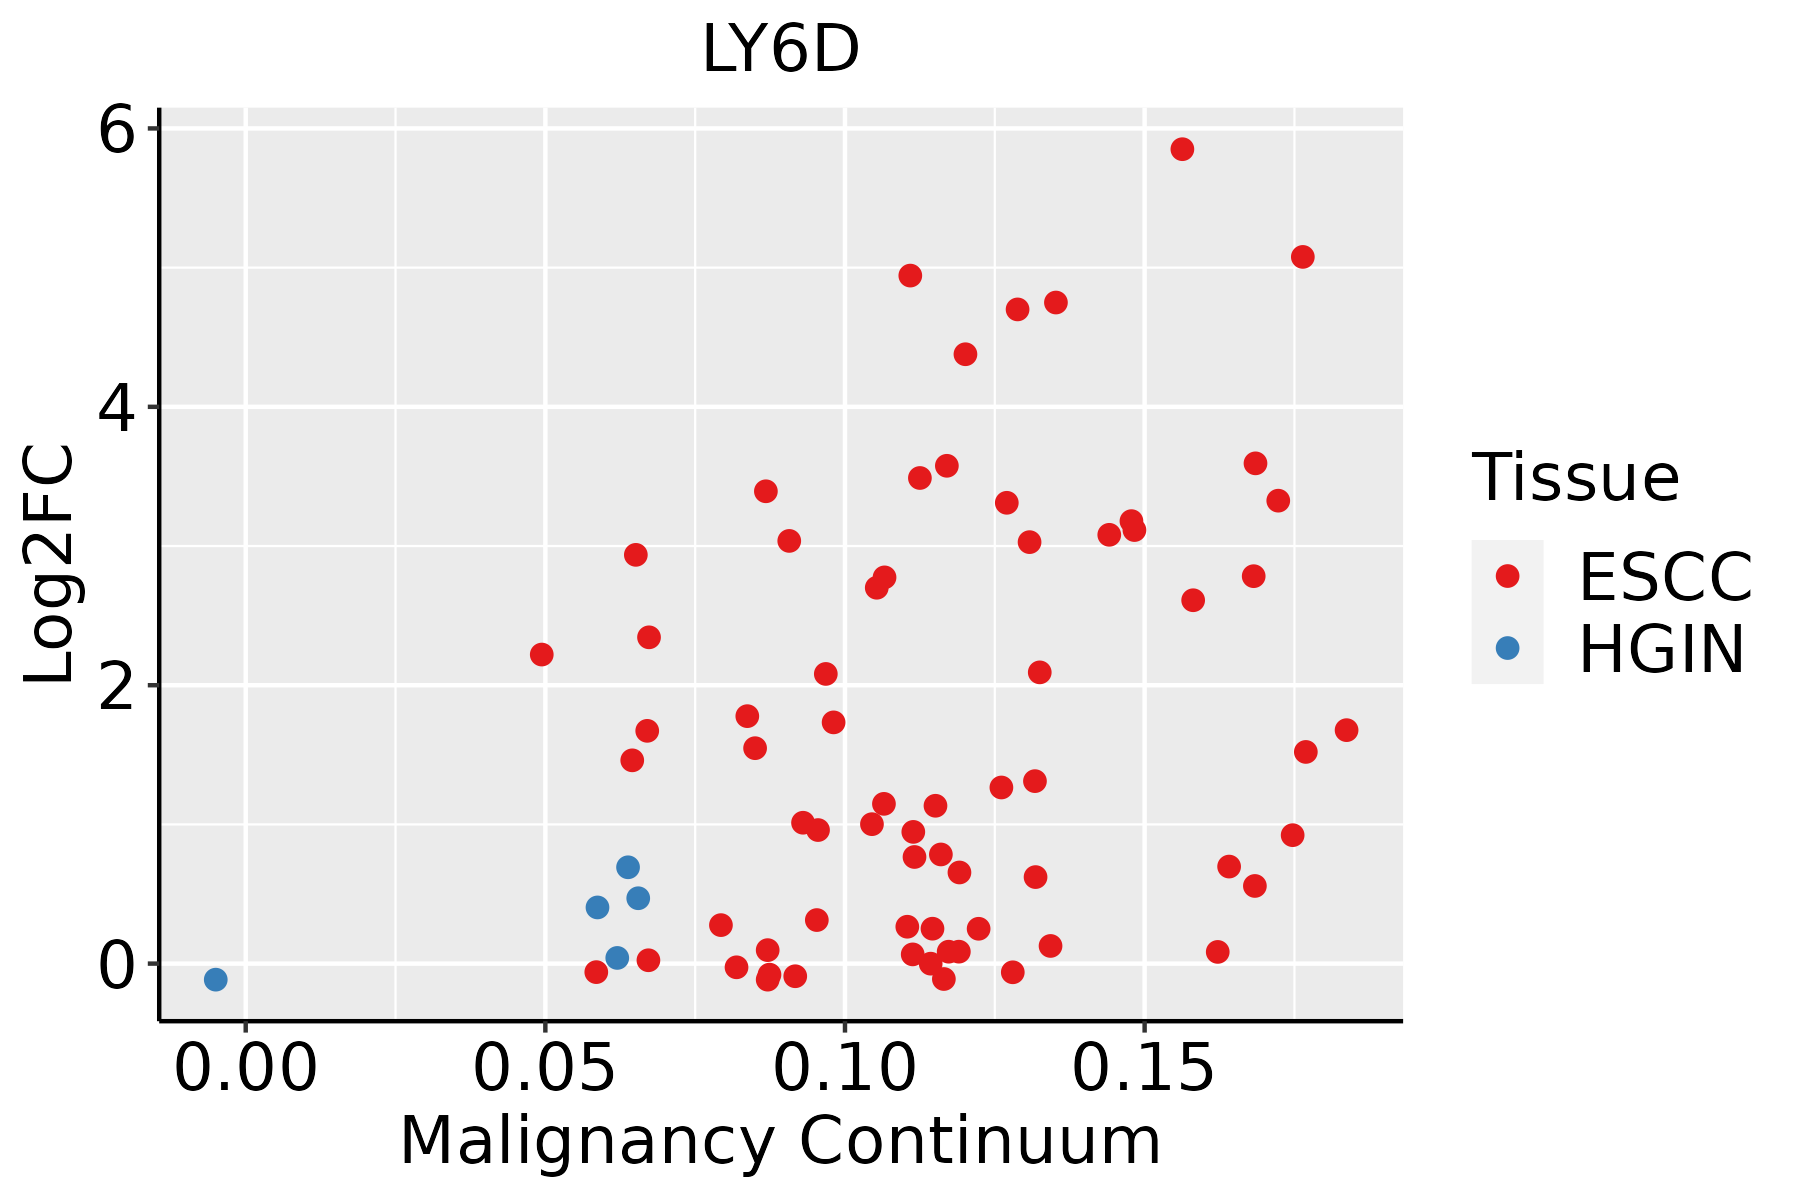 | ESCC: Esophageal squamous cell carcinoma |
| HGIN: High-grade intraepithelial neoplasias | ||
| LGIN: Low-grade intraepithelial neoplasias | ||
| Oral Cavity |  | EOLP: Erosive Oral lichen planus |
| LP: leukoplakia | ||
| NEOLP: Non-erosive oral lichen planus | ||
| OSCC: Oral squamous cell carcinoma | ||
| Skin | 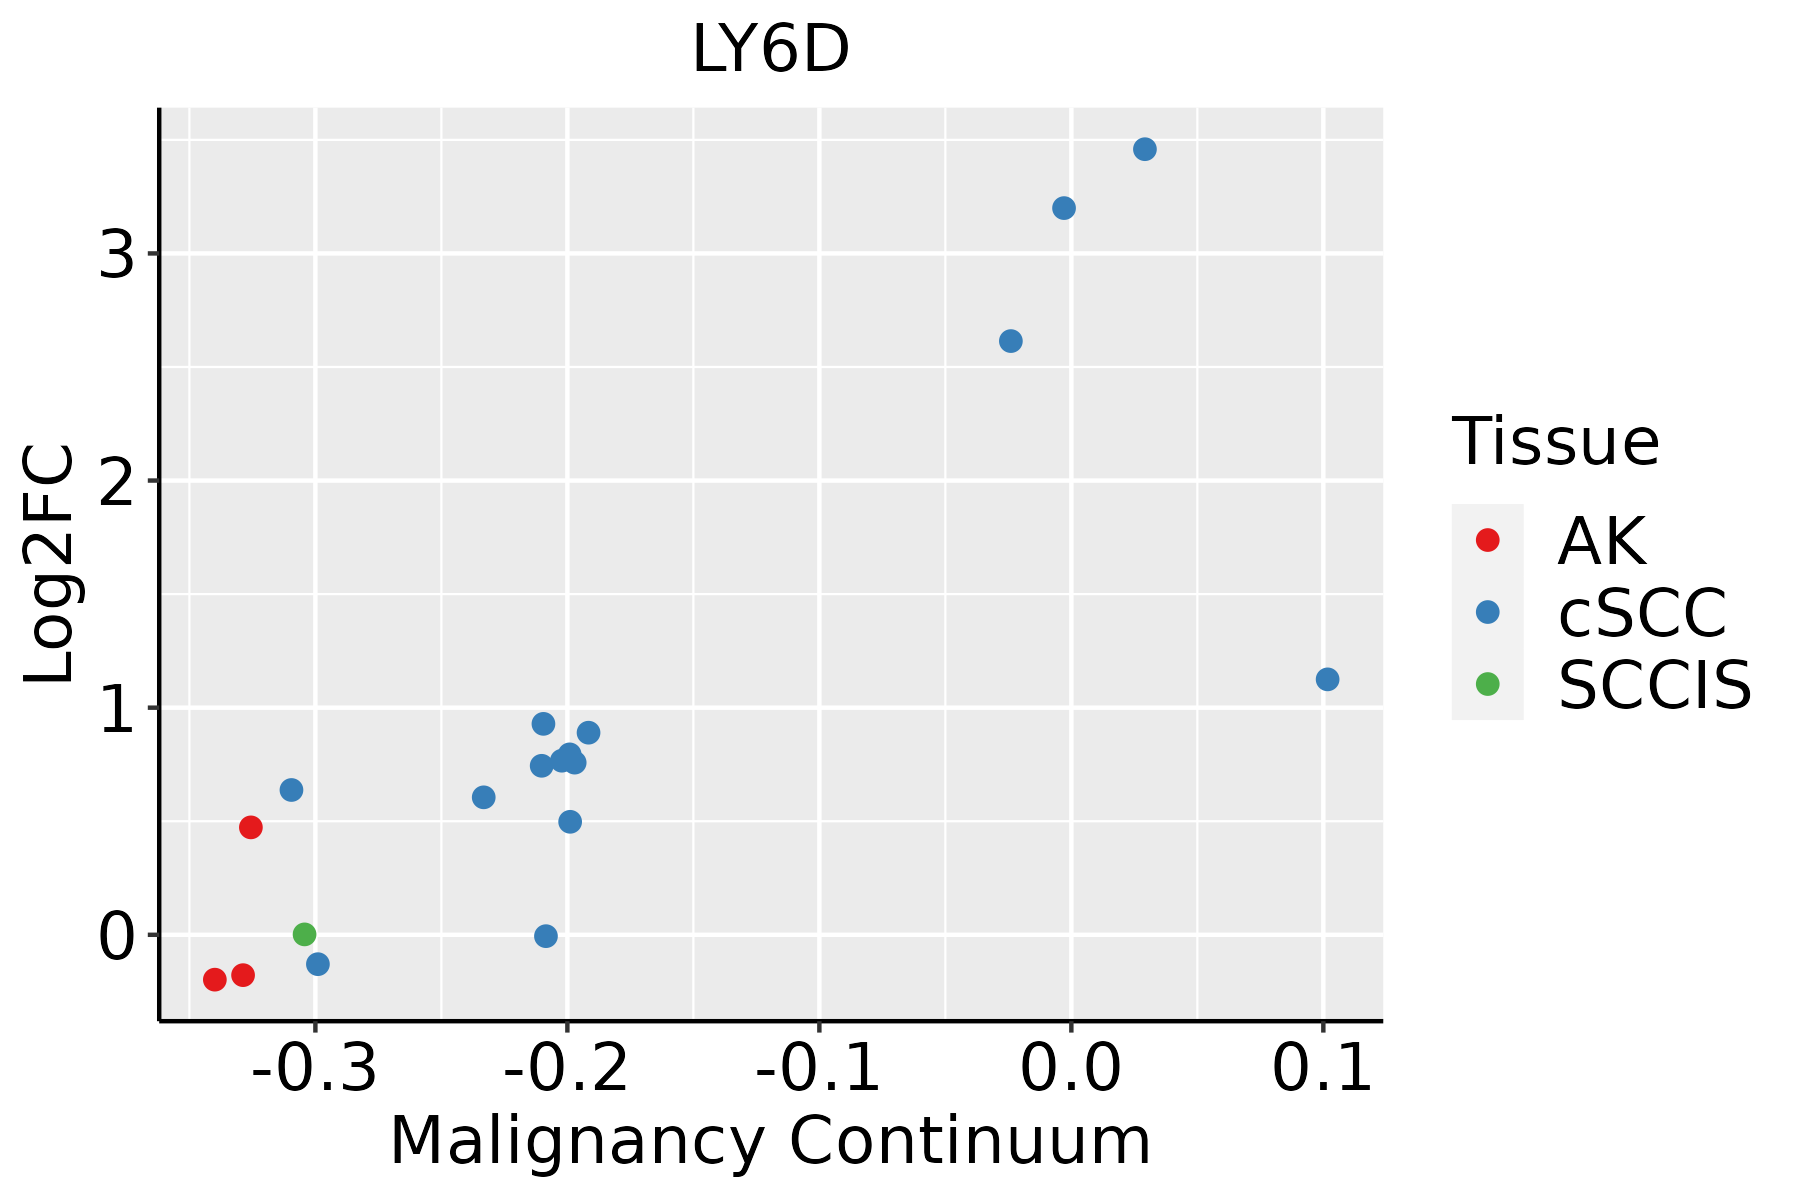 | AK: Actinic keratosis |
| cSCC: Cutaneous squamous cell carcinoma | ||
| SCCIS:squamous cell carcinoma in situ |
| ∗log2FC in expression of this searched gene in stem-like cells from each diseased tissue sample relative to stem-like cells in normal samples in each tissue plotted against the malignancy continuum. Samples are colored based on if they are from different disease stage. |
Top |
Malignant transformation related pathway analysis |
| Find out the enriched GO biological processes and KEGG pathways involved in transition from healthy to precancer to cancer |
| Tissue | Disease Stage | Enriched GO biological Processes |
| Colorectum | AD |  |
| Colorectum | SER |  |
| Colorectum | MSS |  |
| Colorectum | MSI-H |  |
| Colorectum | FAP |  |
| ∗Top 15 enriched GO BP terms are showed in the bar plot of each disease state in each tissue. Each row represents a significant GO biological process which is colored according to the -log10(p.adjust). |
| Page: 1 2 3 4 5 6 7 8 9 |
| GO ID | Tissue | Disease Stage | Description | Gene Ratio | Bg Ratio | pvalue | p.adjust | Count |
| GO:19031314 | Cervix | CC | mononuclear cell differentiation | 76/2311 | 426/18723 | 5.66e-04 | 5.42e-03 | 76 |
| GO:00300981 | Cervix | CC | lymphocyte differentiation | 63/2311 | 374/18723 | 6.21e-03 | 3.52e-02 | 63 |
| GO:190313112 | Cervix | HSIL_HPV | mononuclear cell differentiation | 29/737 | 426/18723 | 3.10e-03 | 2.84e-02 | 29 |
| GO:190313121 | Cervix | N_HPV | mononuclear cell differentiation | 24/534 | 426/18723 | 1.27e-03 | 1.40e-02 | 24 |
| GO:19031317 | Esophagus | ESCC | mononuclear cell differentiation | 226/8552 | 426/18723 | 1.20e-03 | 5.88e-03 | 226 |
| GO:00300984 | Esophagus | ESCC | lymphocyte differentiation | 192/8552 | 374/18723 | 1.52e-02 | 4.93e-02 | 192 |
| GO:19031316 | Oral cavity | OSCC | mononuclear cell differentiation | 210/7305 | 426/18723 | 8.44e-06 | 9.02e-05 | 210 |
| GO:00300983 | Oral cavity | OSCC | lymphocyte differentiation | 179/7305 | 374/18723 | 2.74e-04 | 1.74e-03 | 179 |
| GO:190313114 | Oral cavity | EOLP | mononuclear cell differentiation | 88/2218 | 426/18723 | 1.07e-07 | 3.61e-06 | 88 |
| GO:003009812 | Oral cavity | EOLP | lymphocyte differentiation | 76/2218 | 374/18723 | 1.50e-06 | 3.55e-05 | 76 |
| GO:190313122 | Oral cavity | NEOLP | mononuclear cell differentiation | 77/2005 | 426/18723 | 2.80e-06 | 6.41e-05 | 77 |
| GO:003009821 | Oral cavity | NEOLP | lymphocyte differentiation | 66/2005 | 374/18723 | 3.08e-05 | 4.67e-04 | 66 |
| GO:19031318 | Skin | AK | mononuclear cell differentiation | 65/1910 | 426/18723 | 6.24e-04 | 5.45e-03 | 65 |
| GO:00300985 | Skin | AK | lymphocyte differentiation | 57/1910 | 374/18723 | 1.34e-03 | 1.00e-02 | 57 |
| Page: 1 |
| Pathway ID | Tissue | Disease Stage | Description | Gene Ratio | Bg Ratio | pvalue | p.adjust | qvalue | Count |
| Page: 1 |
Top |
Cell-cell communication analysis |
| Identification of potential cell-cell interactions between two cell types and their ligand-receptor pairs for different disease states |
| Ligand | Receptor | LRpair | Pathway | Tissue | Disease Stage |
| Page: 1 |
Top |
Single-cell gene regulatory network inference analysis |
| Find out the significant the regulons (TFs) and the target genes of each regulon across cell types for different disease states |
| TF | Cell Type | Tissue | Disease Stage | Target Gene | RSS | Regulon Activity |
| ∗The dot plots of a searched regulon are shown for all cell subpopulations in each disease state of each tissue based on the regulon specific score inferred using pySCENIC and by calculating the average expression. |
| Page: 1 |
Top |
Somatic mutation of malignant transformation related genes |
| Annotation of somatic variants for genes involved in malignant transformation |
| Hugo Symbol | Variant Class | Variant Classification | dbSNP RS | HGVSc | HGVSp | HGVSp Short | SWISSPROT | BIOTYPE | SIFT | PolyPhen | Tumor Sample Barcode | Tissue | Histology | Sex | Age | Stage | Therapy Types | Drugs | Outcome |
| LY6D | SNV | Missense_Mutation | c.49N>A | p.Pro17Thr | p.P17T | Q14210 | protein_coding | deleterious(0.01) | probably_damaging(0.941) | TCGA-D8-A1XQ-01 | Breast | breast invasive carcinoma | Female | >=65 | I/II | Unknown | Unknown | SD | |
| LY6D | deletion | In_Frame_Del | novel | c.11_46delNNNNNNNNNNNNNNNNNNNNNNNNNNNNNNNNNNNN | p.Ala4_Thr15del | p.A4_T15del | Q14210 | protein_coding | TCGA-C8-A1HJ-01 | Breast | breast invasive carcinoma | Female | <65 | I/II | Unknown | Unknown | SD | ||
| LY6D | deletion | Frame_Shift_Del | c.116delC | p.Pro39ArgfsTer16 | p.P39Rfs*16 | Q14210 | protein_coding | TCGA-EW-A2FV-01 | Breast | breast invasive carcinoma | Female | <65 | III/IV | Chemotherapy | docetaxel | SD | |||
| LY6D | SNV | Missense_Mutation | novel | c.202N>G | p.Thr68Ala | p.T68A | Q14210 | protein_coding | tolerated(0.12) | benign(0.222) | TCGA-2W-A8YY-01 | Cervix | cervical & endocervical cancer | Female | <65 | I/II | Chemotherapy | cisplatin | CR |
| LY6D | SNV | Missense_Mutation | c.295N>A | p.Ala99Thr | p.A99T | Q14210 | protein_coding | deleterious(0.04) | possibly_damaging(0.529) | TCGA-AZ-6601-01 | Colorectum | colon adenocarcinoma | Male | >=65 | I/II | Unknown | Unknown | PD | |
| LY6D | SNV | Missense_Mutation | rs769479466 | c.143N>T | p.Thr48Met | p.T48M | Q14210 | protein_coding | tolerated(0.57) | benign(0.001) | TCGA-AG-A014-01 | Colorectum | rectum adenocarcinoma | Male | >=65 | I/II | Unknown | Unknown | SD |
| LY6D | SNV | Missense_Mutation | novel | c.188G>A | p.Cys63Tyr | p.C63Y | Q14210 | protein_coding | deleterious(0) | probably_damaging(0.966) | TCGA-AP-A1DK-01 | Endometrium | uterine corpus endometrioid carcinoma | Female | <65 | I/II | Unknown | Unknown | SD |
| LY6D | SNV | Missense_Mutation | rs756958053 | c.74N>C | p.Val25Ala | p.V25A | Q14210 | protein_coding | deleterious(0) | probably_damaging(0.967) | TCGA-D1-A103-01 | Endometrium | uterine corpus endometrioid carcinoma | Female | >=65 | I/II | Unknown | Unknown | SD |
| LY6D | SNV | Missense_Mutation | c.116N>A | p.Pro39Gln | p.P39Q | Q14210 | protein_coding | deleterious(0) | benign(0.099) | TCGA-44-8117-01 | Lung | lung adenocarcinoma | Female | <65 | I/II | Chemotherapy | cisplatin | CR | |
| LY6D | SNV | Missense_Mutation | c.341N>T | p.Gly114Val | p.G114V | Q14210 | protein_coding | tolerated(0.27) | benign(0.007) | TCGA-55-A493-01 | Lung | lung adenocarcinoma | Female | <65 | I/II | Unknown | Unknown | SD |
| Page: 1 2 |
Top |
Related drugs of malignant transformation related genes |
| Identification of chemicals and drugs interact with genes involved in malignant transfromation |
| (DGIdb 4.0) |
| Entrez ID | Symbol | Category | Interaction Types | Drug Claim Name | Drug Name | PMIDs |
| Page: 1 |

Copyright 2023-Present -The University of Texas Health Science Center at Houston |