| Tissue | Expression Dynamics | Abbreviation |
| Cervix | 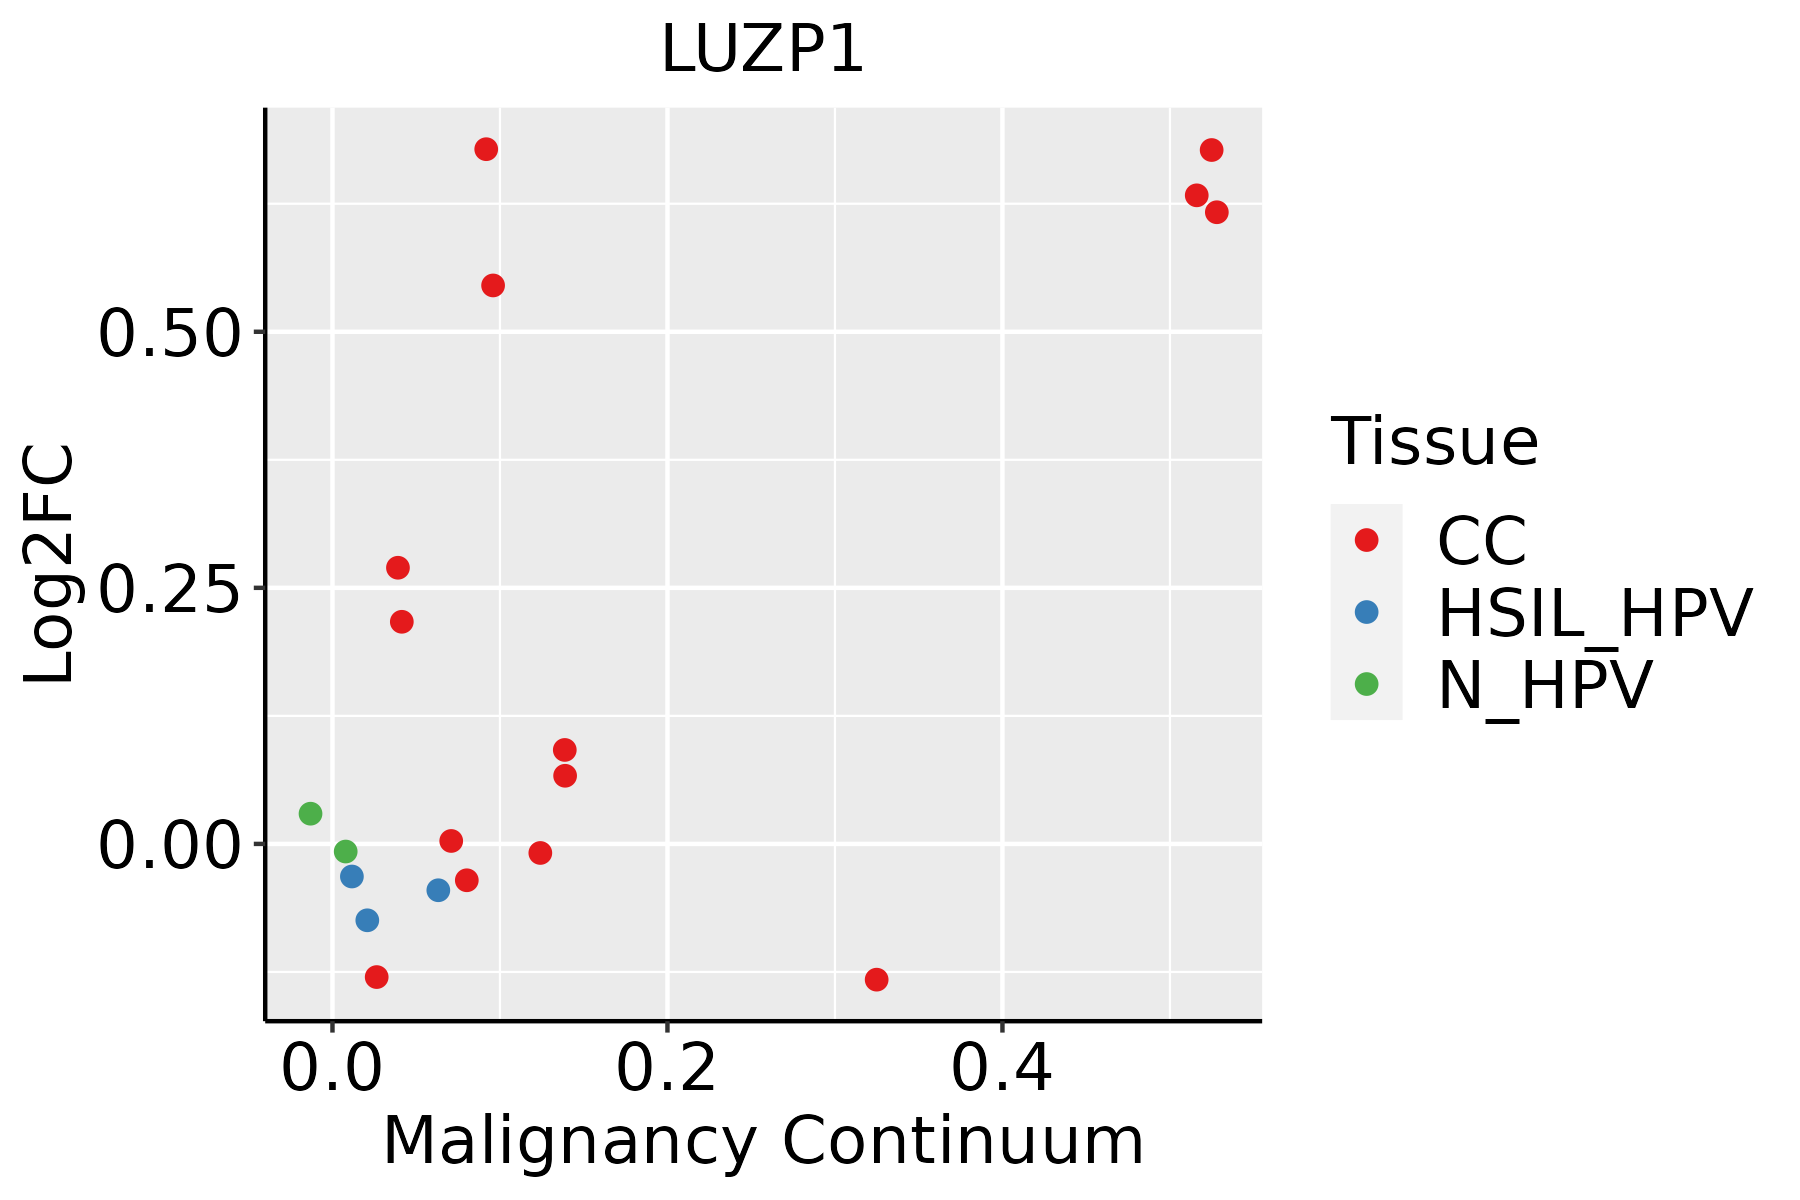 | CC: Cervix cancer |
| HSIL_HPV: HPV-infected high-grade squamous intraepithelial lesions |
| N_HPV: HPV-infected normal cervix |
| Colorectum (GSE201348) |  | FAP: Familial adenomatous polyposis |
| CRC: Colorectal cancer |
| Colorectum (HTA11) |  | AD: Adenomas |
| SER: Sessile serrated lesions |
| MSI-H: Microsatellite-high colorectal cancer |
| MSS: Microsatellite stable colorectal cancer |
| Esophagus | 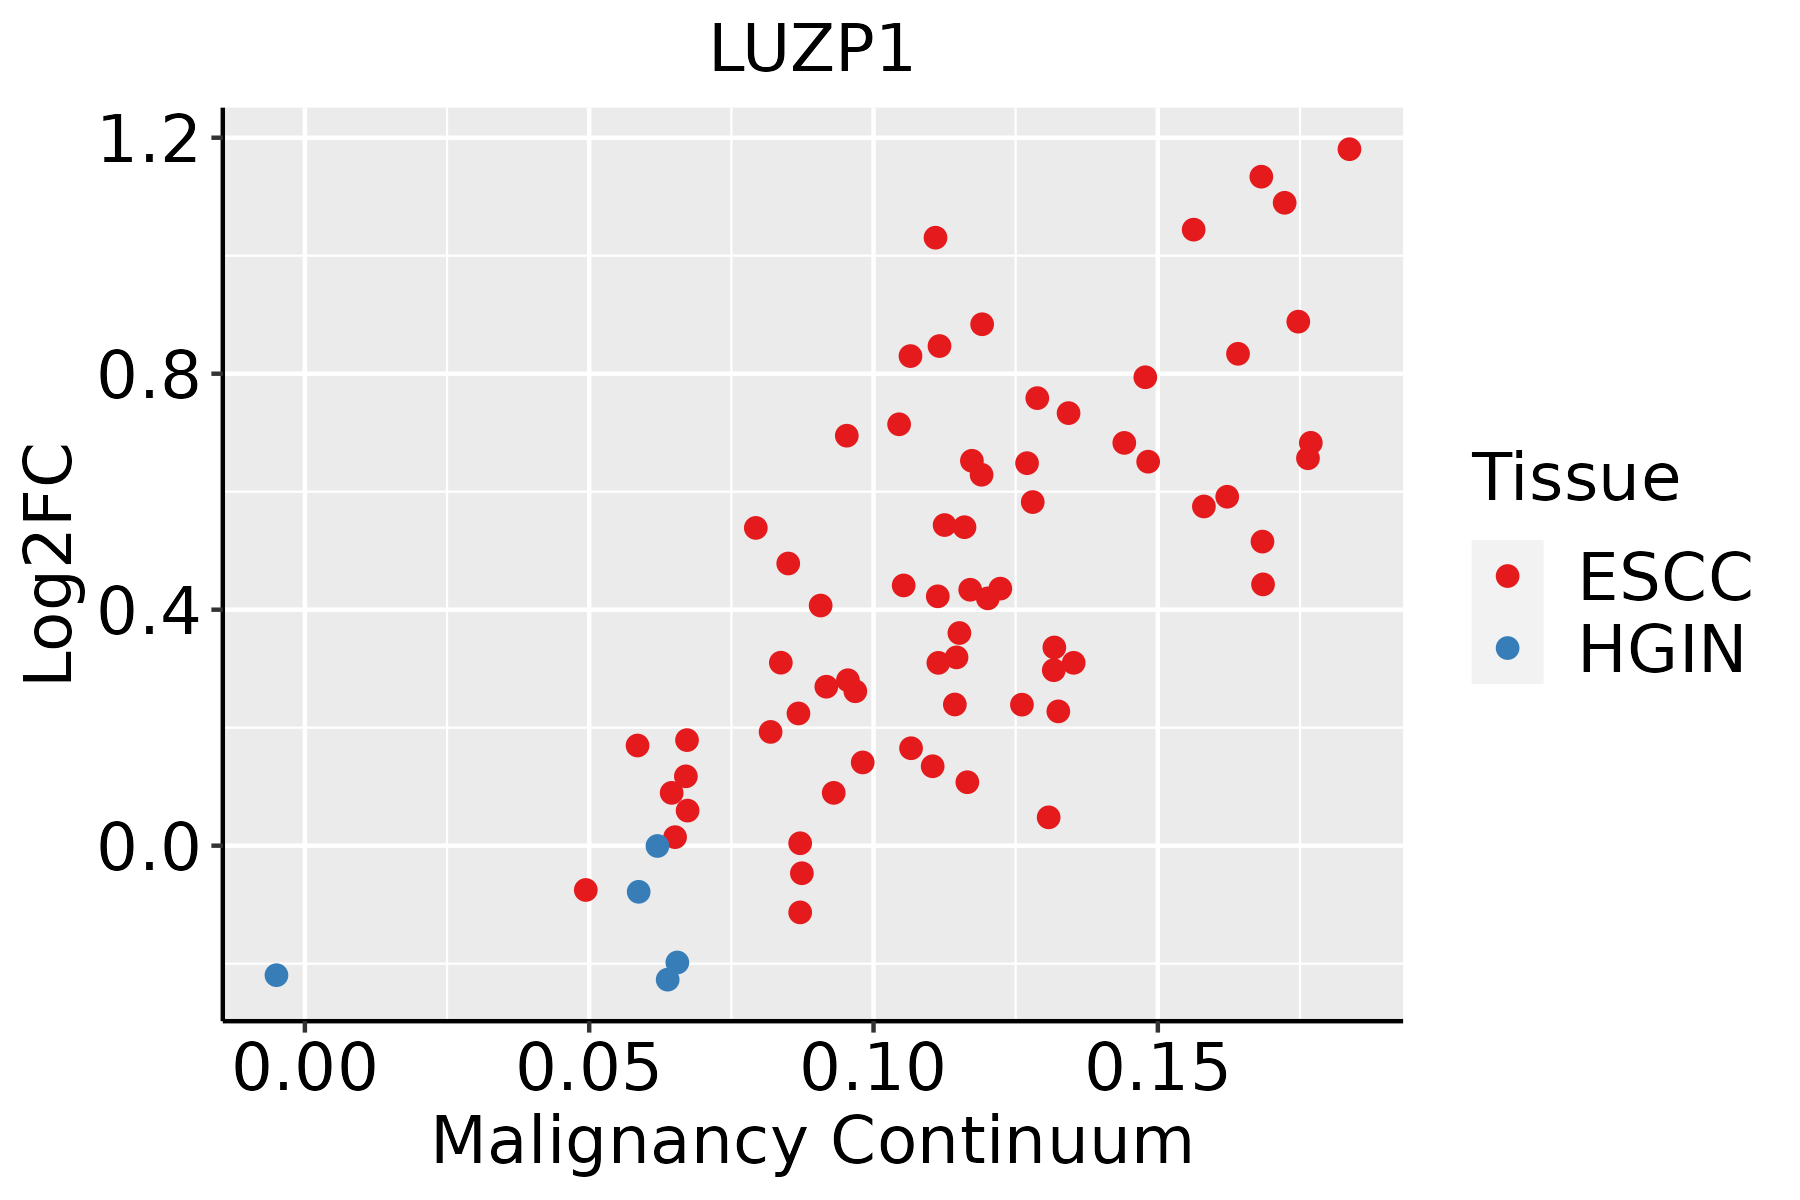 | ESCC: Esophageal squamous cell carcinoma |
| HGIN: High-grade intraepithelial neoplasias |
| LGIN: Low-grade intraepithelial neoplasias |
| GC | 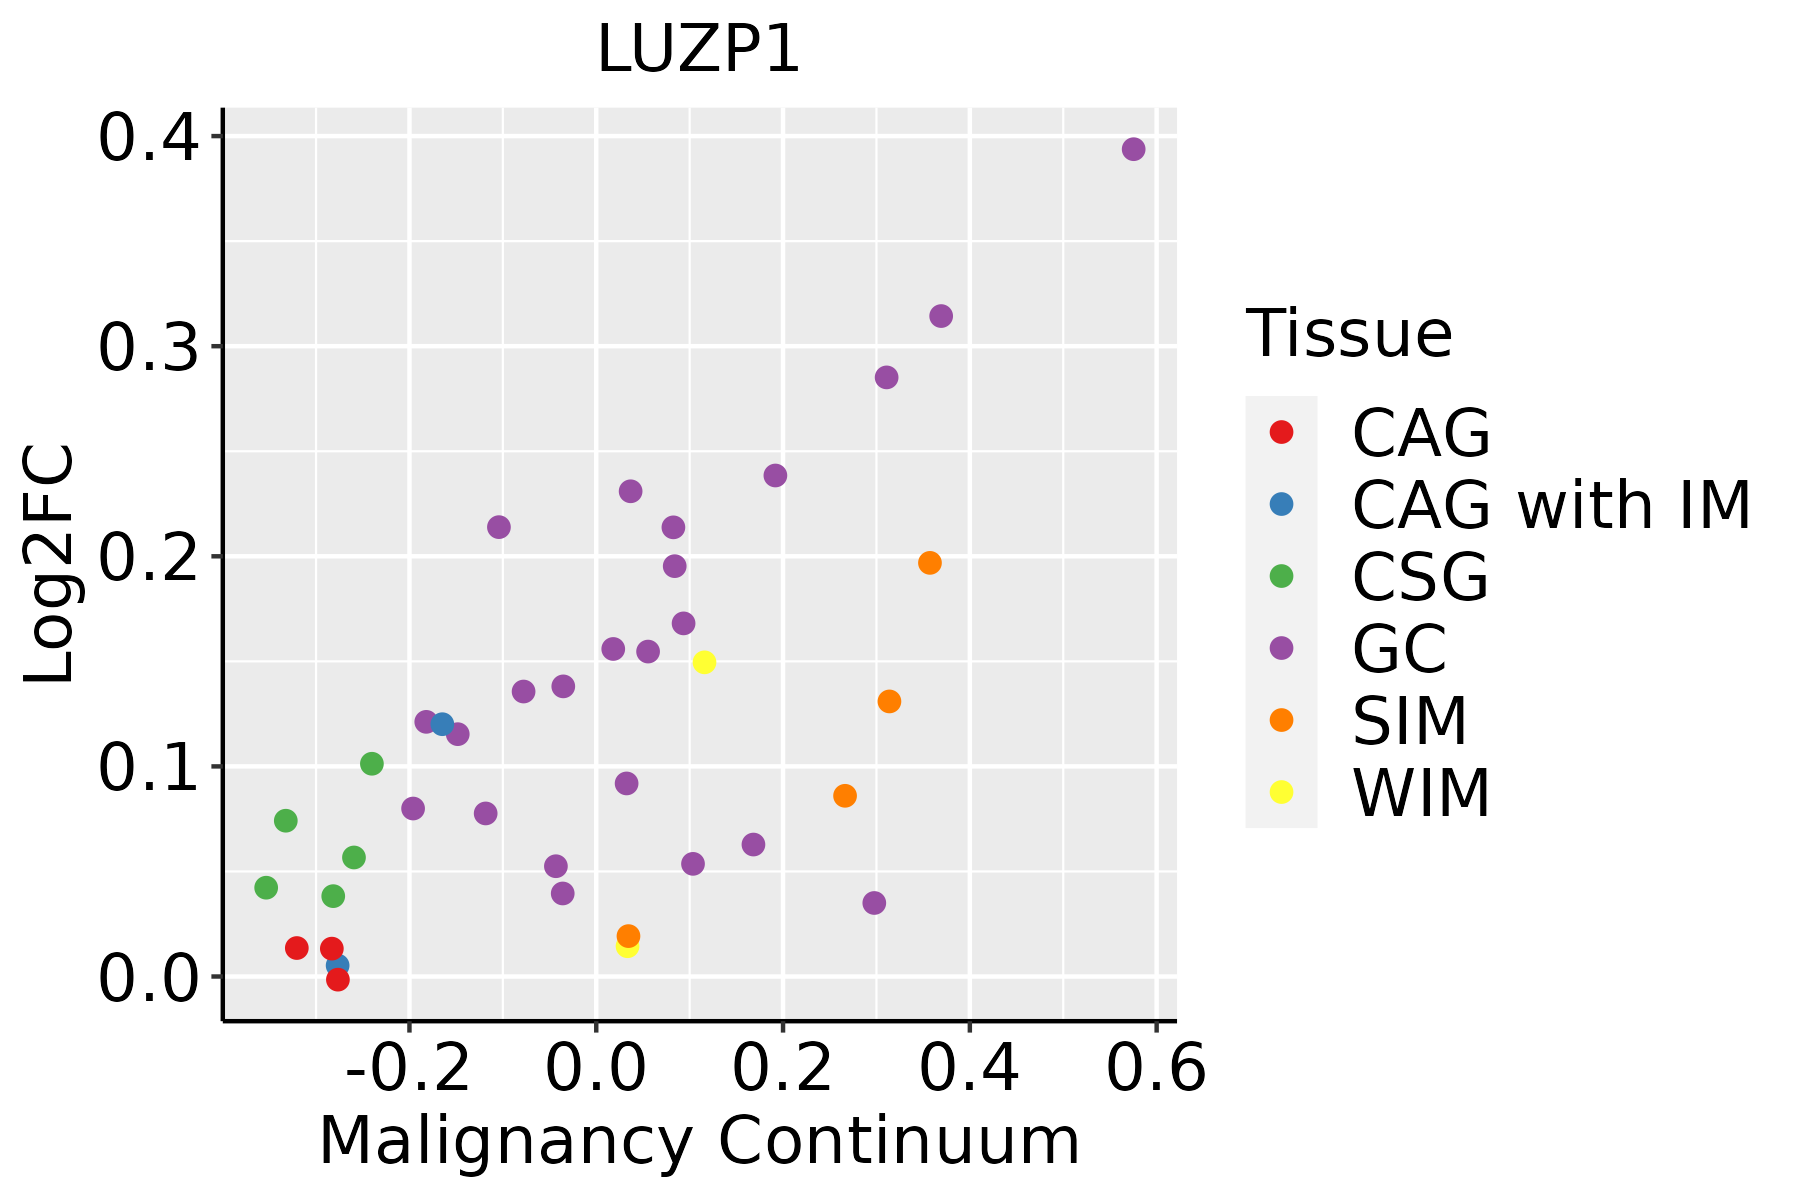 | CAG: Chronic atrophic gastritis |
| CAG with IM: Chronic atrophic gastritis with intestinal metaplasia |
| CSG: Chronic superficial gastritis |
| GC: Gastric cancer |
| SIM: Severe intestinal metaplasia |
| WIM: Wild intestinal metaplasia |
| Liver | 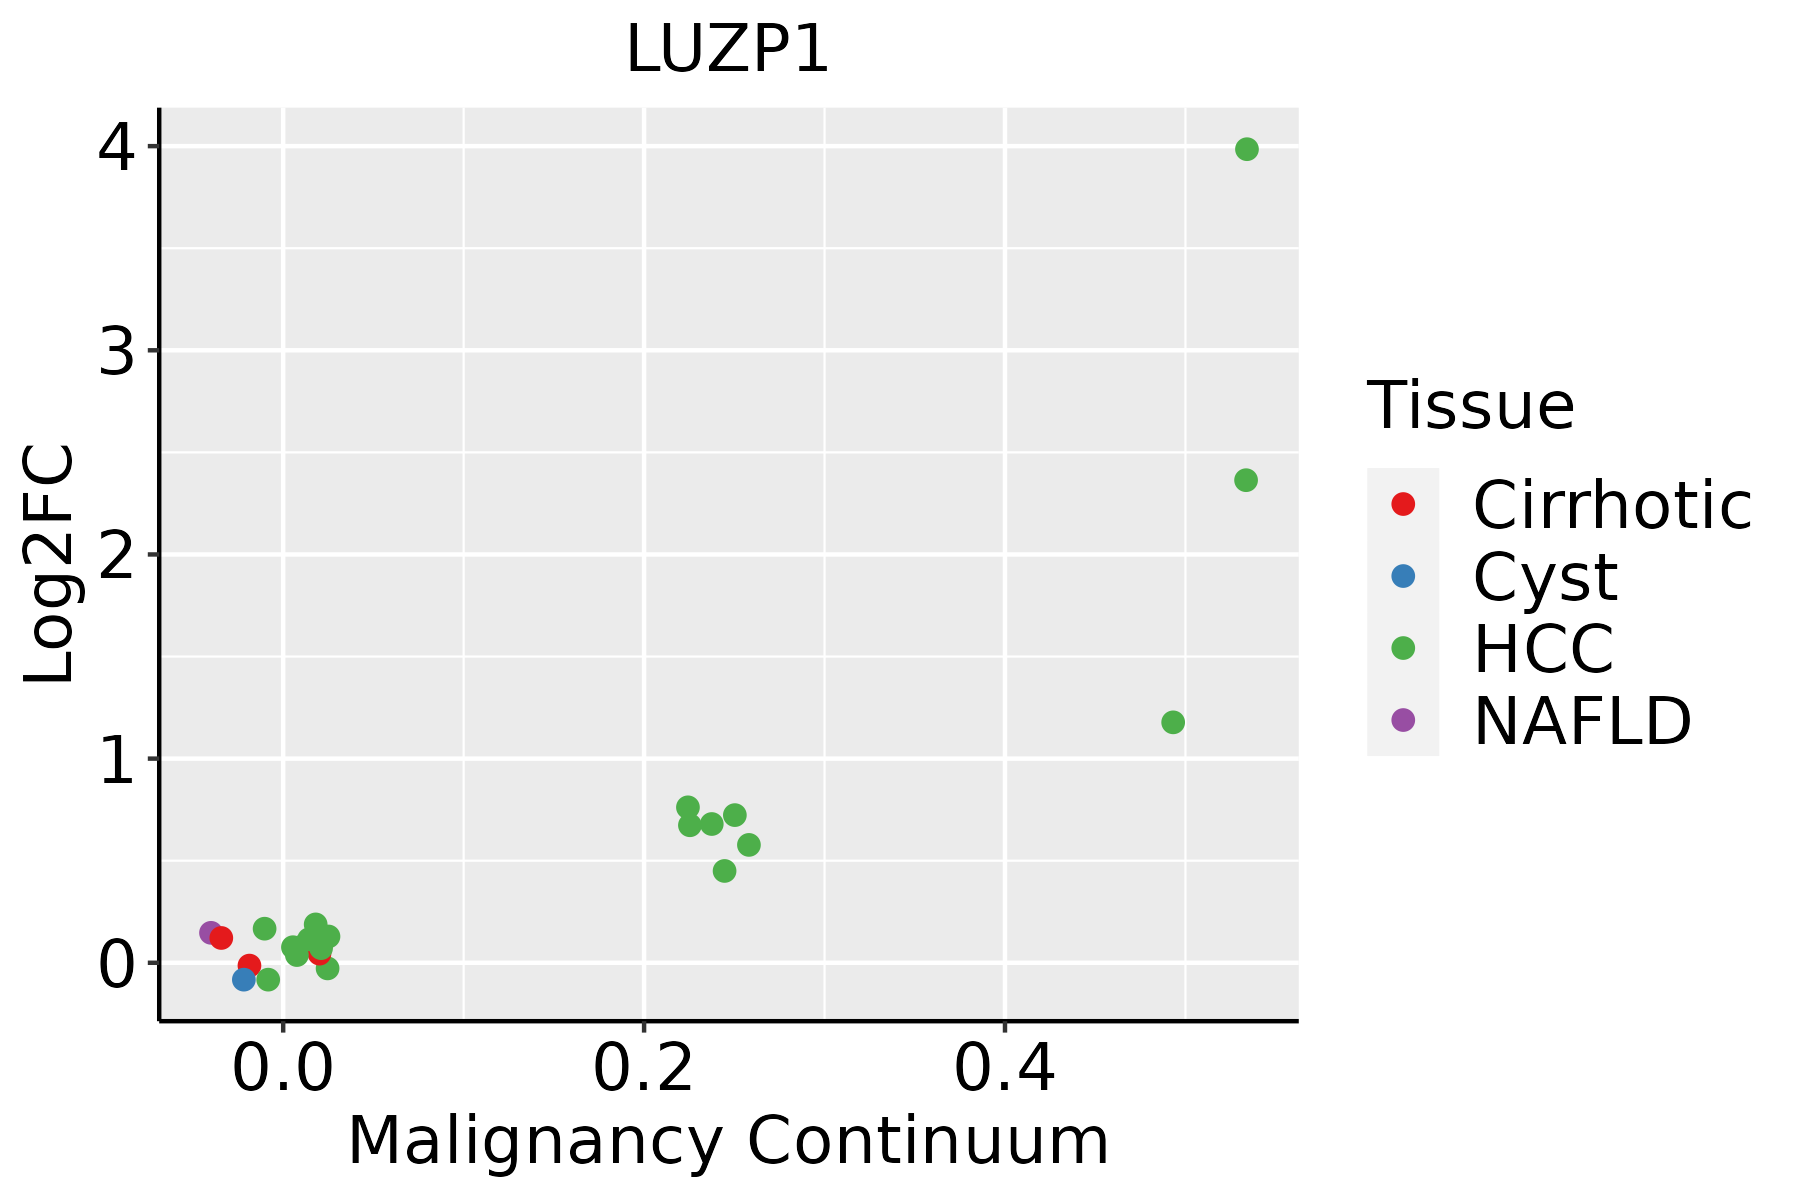 | HCC: Hepatocellular carcinoma |
| NAFLD: Non-alcoholic fatty liver disease |
| Lung | 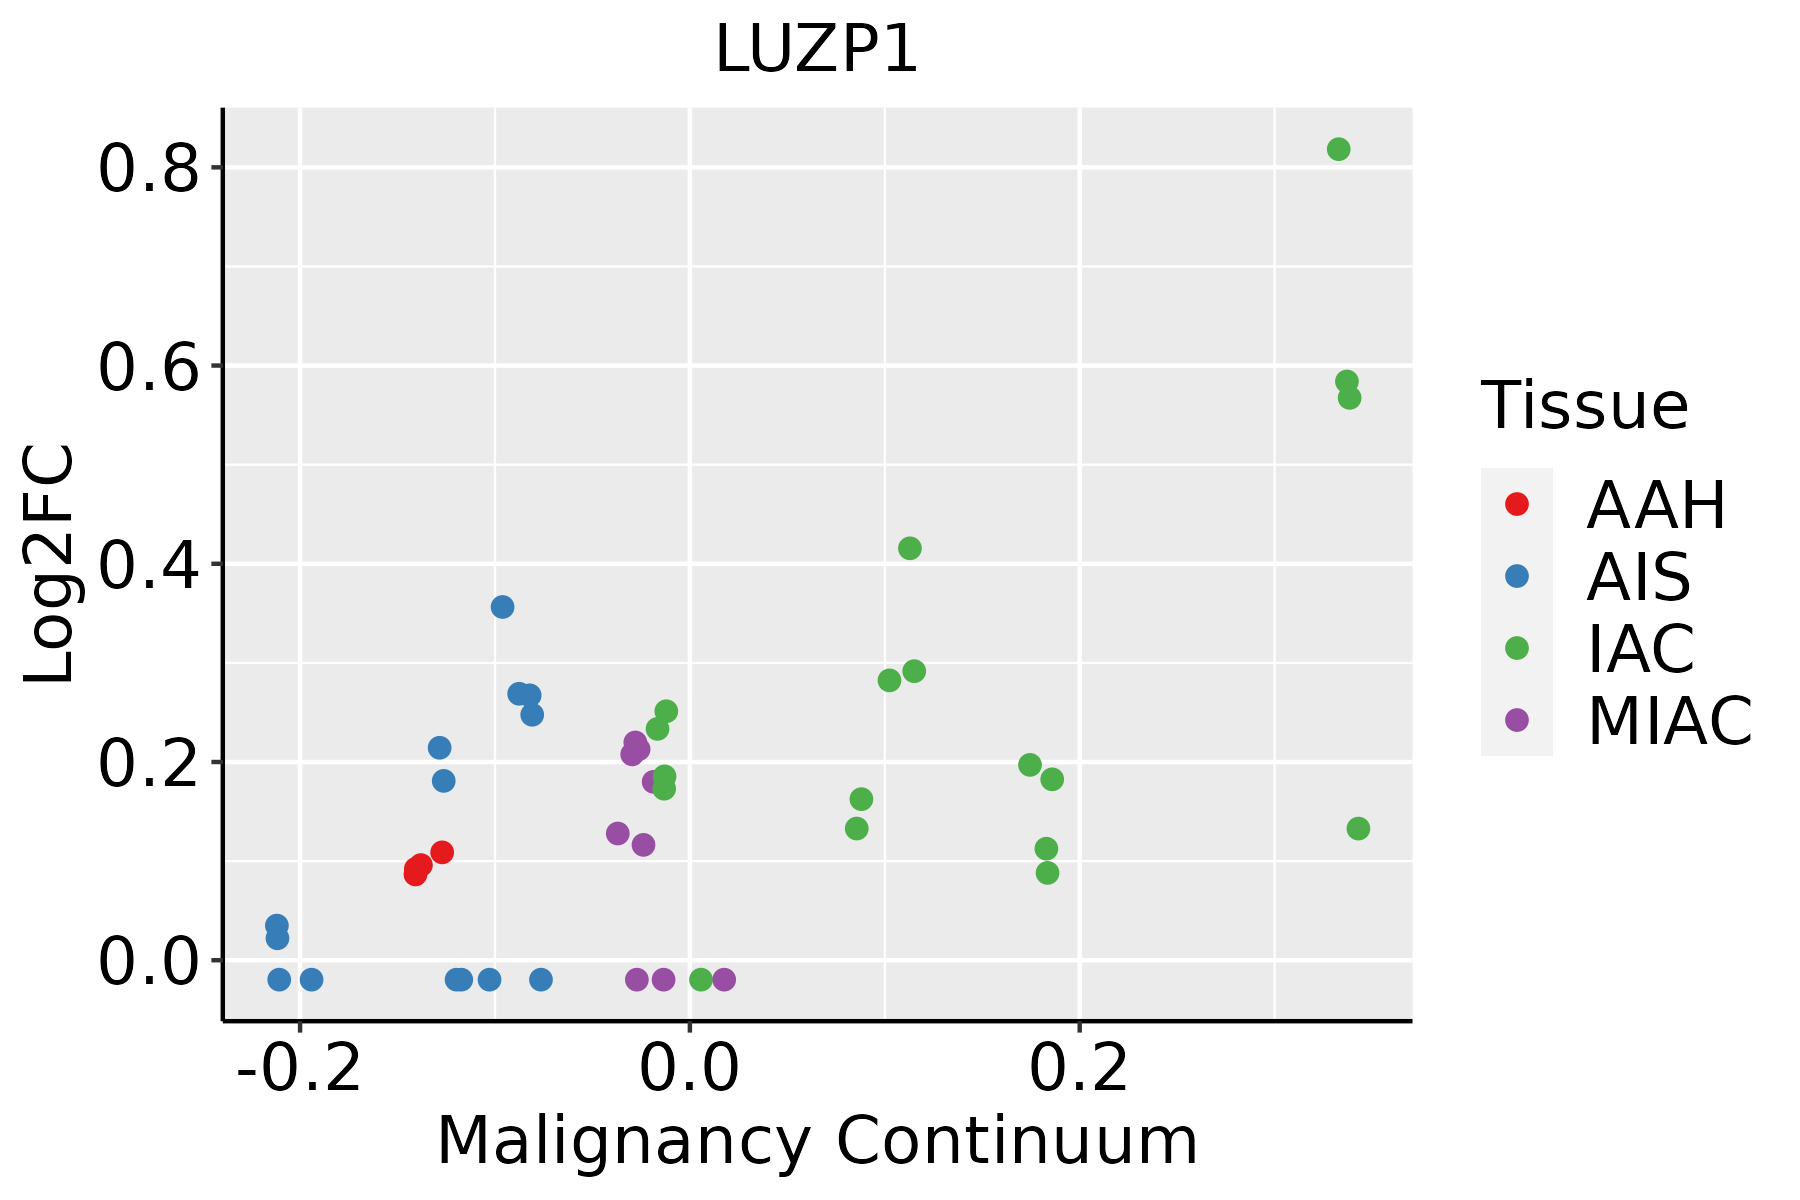 | AAH: Atypical adenomatous hyperplasia |
| AIS: Adenocarcinoma in situ |
| IAC: Invasive lung adenocarcinoma |
| MIA: Minimally invasive adenocarcinoma |
| Oral Cavity | 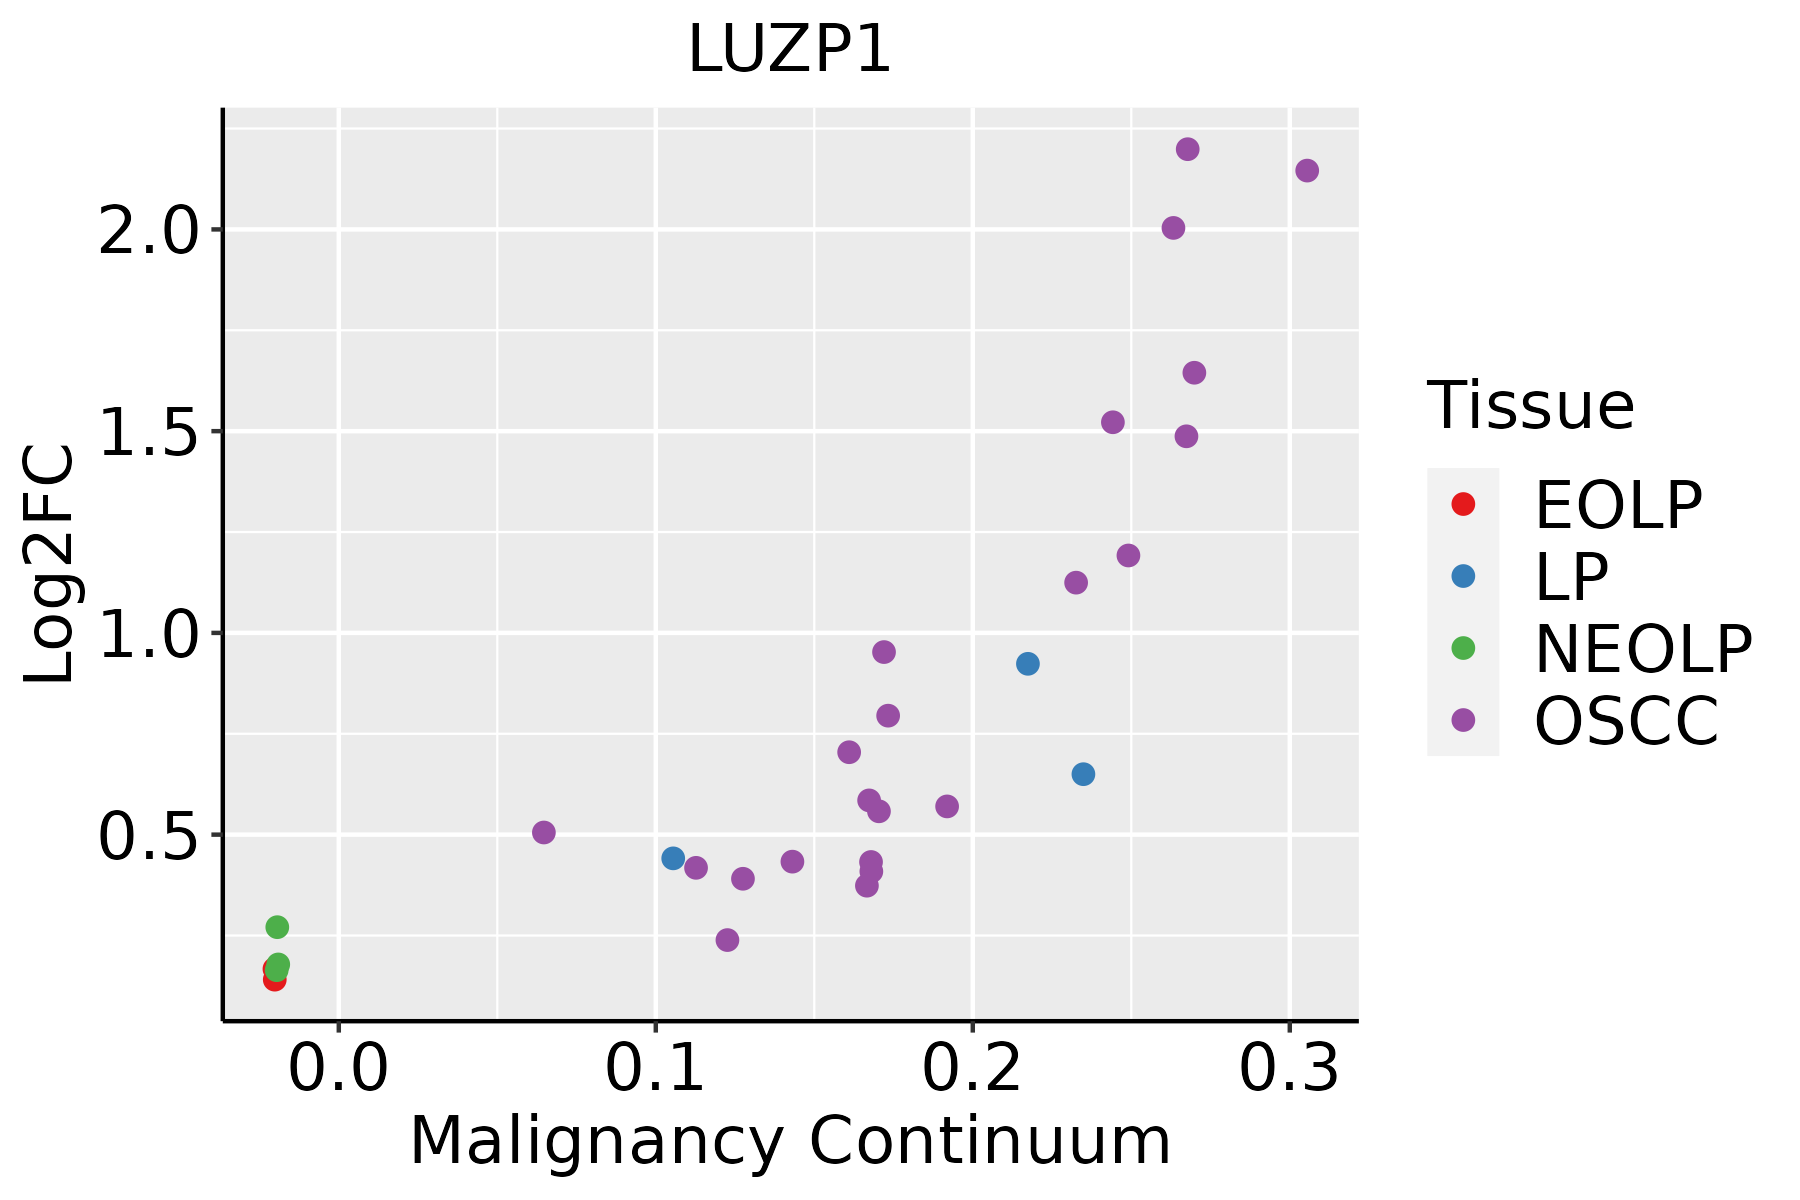 | EOLP: Erosive Oral lichen planus |
| LP: leukoplakia |
| NEOLP: Non-erosive oral lichen planus |
| OSCC: Oral squamous cell carcinoma |
| Prostate | 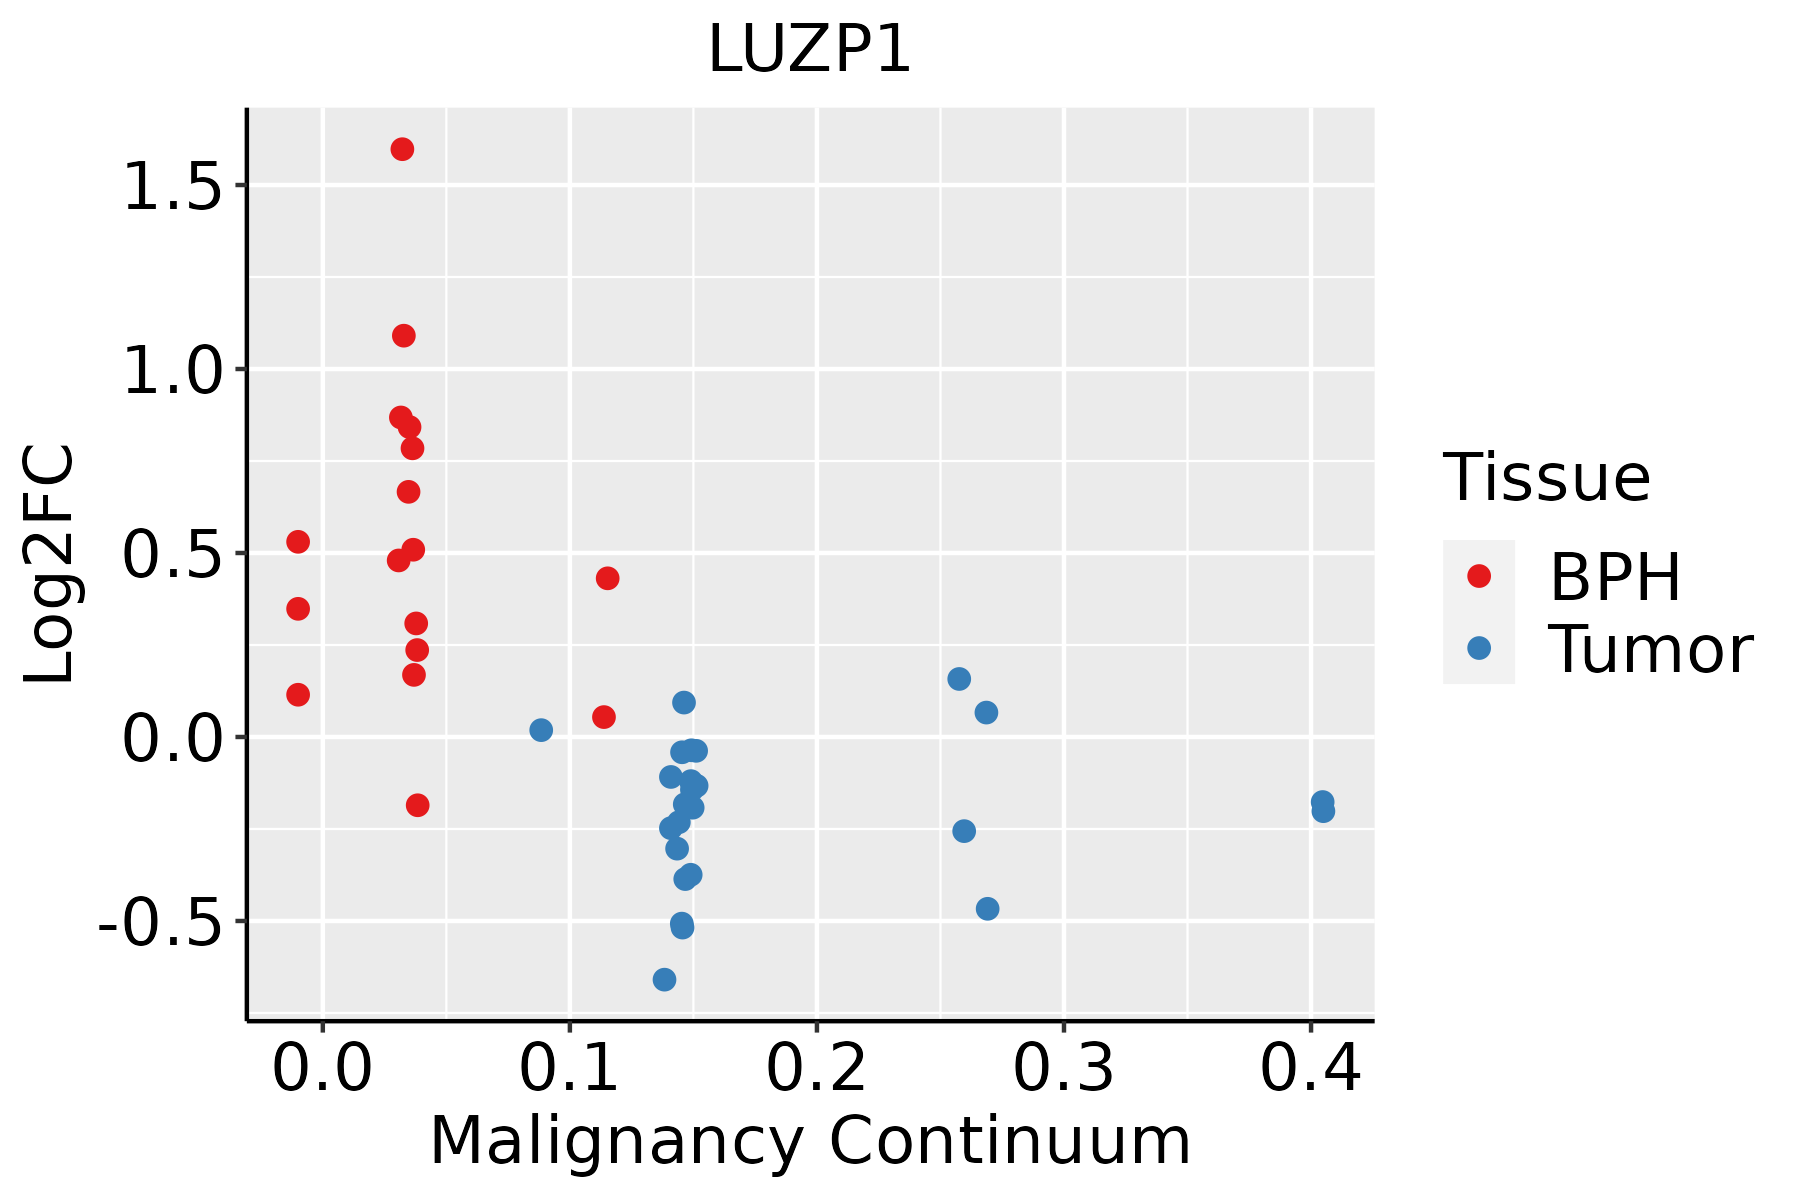 | BPH: Benign Prostatic Hyperplasia |
| Skin | 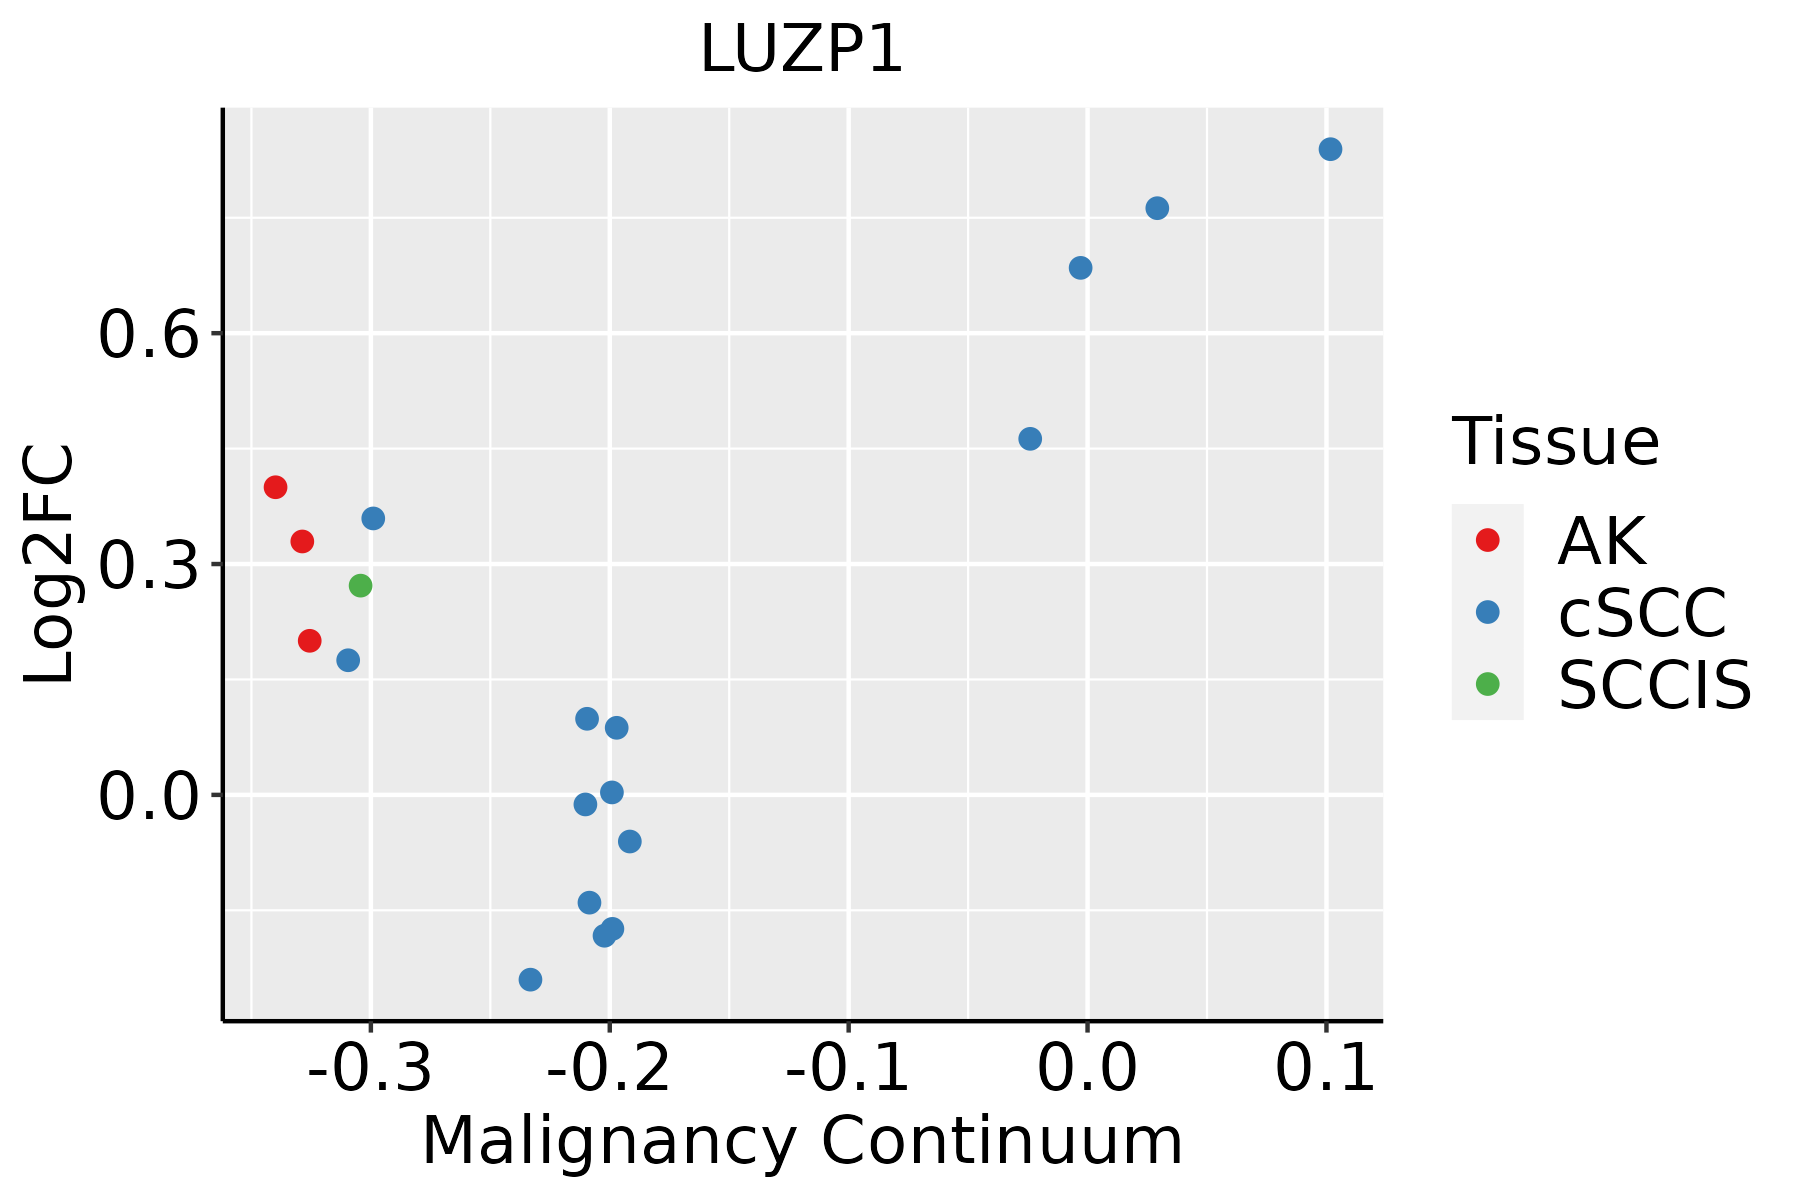 | AK: Actinic keratosis |
| cSCC: Cutaneous squamous cell carcinoma |
| SCCIS:squamous cell carcinoma in situ |
| Thyroid | 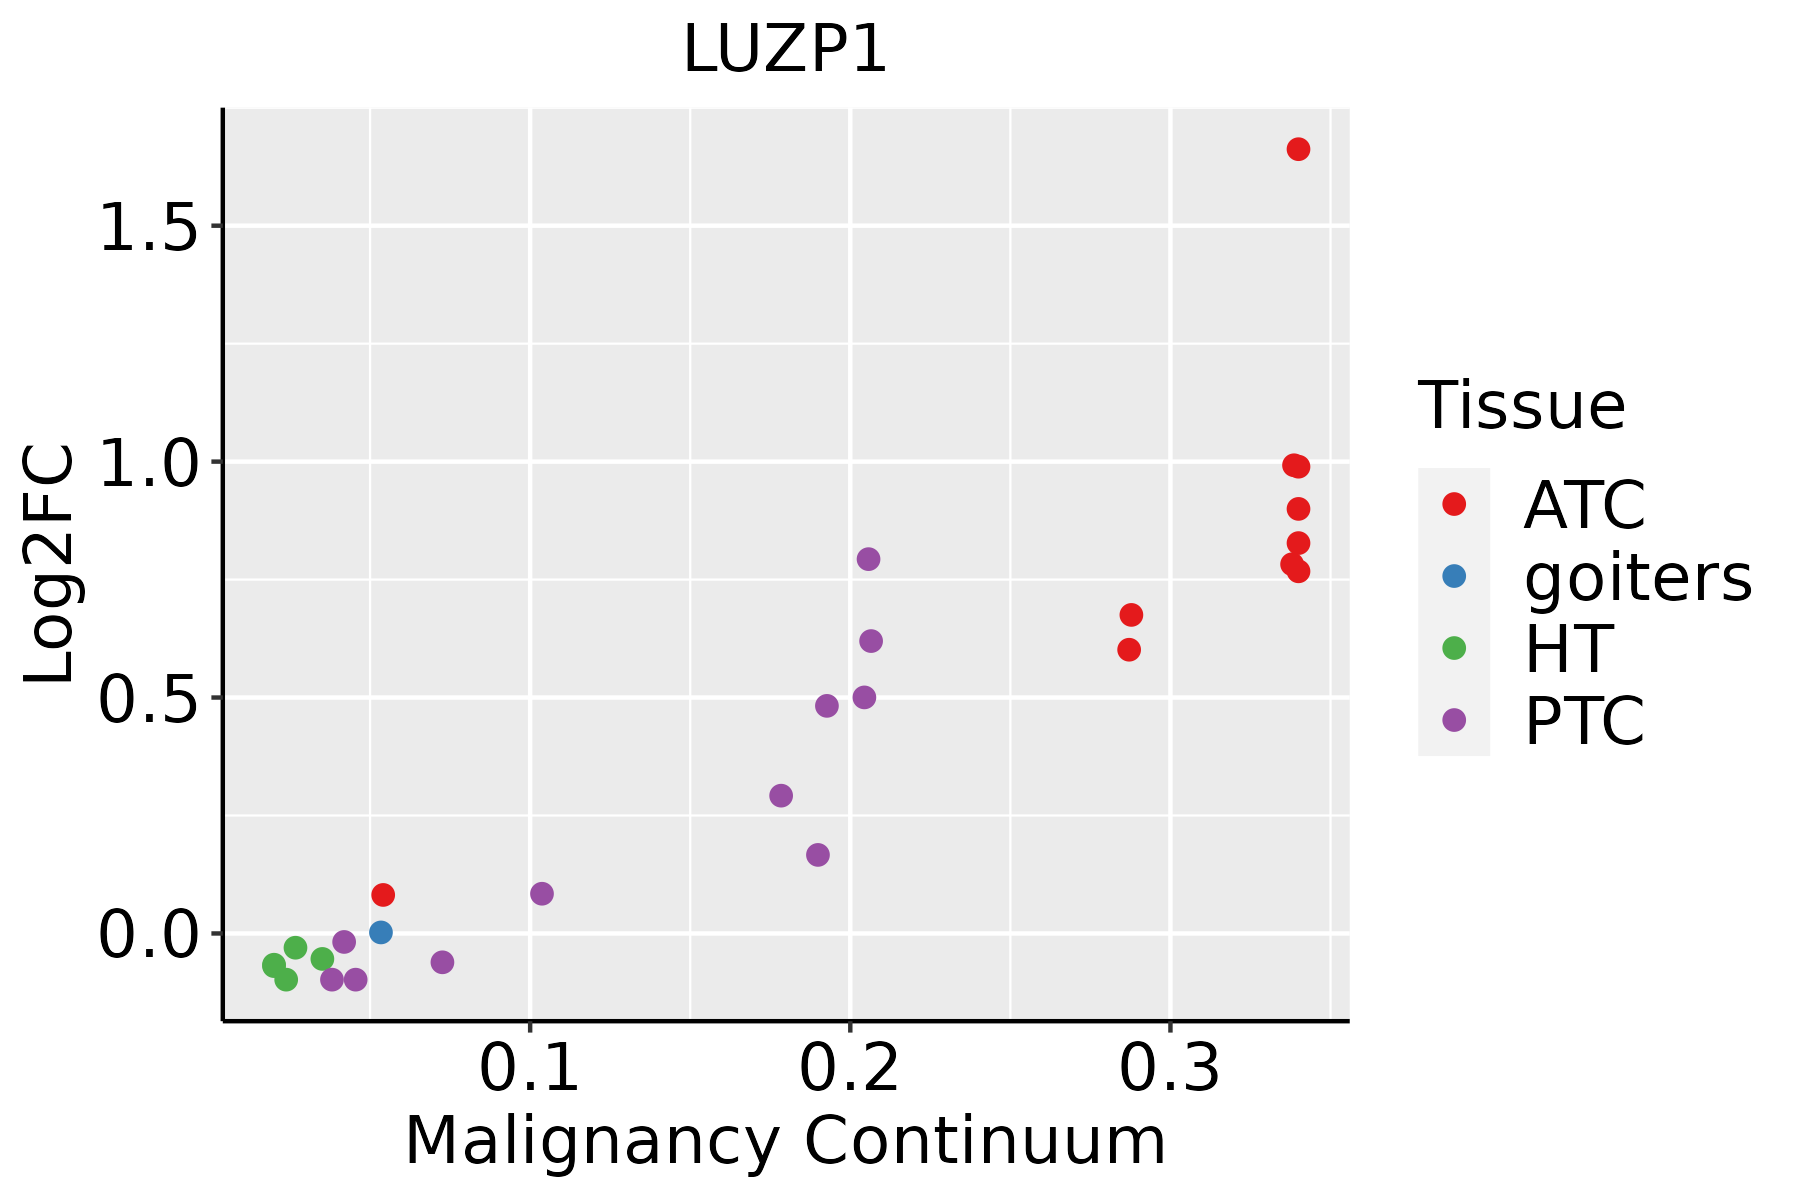 | ATC: Anaplastic thyroid cancer |
| HT: Hashimoto's thyroiditis |
| PTC: Papillary thyroid cancer |
| GO ID | Tissue | Disease Stage | Description | Gene Ratio | Bg Ratio | pvalue | p.adjust | Count |
| GO:00351487 | Cervix | CC | tube formation | 31/2311 | 148/18723 | 2.07e-03 | 1.51e-02 | 31 |
| GO:00018417 | Cervix | CC | neural tube formation | 23/2311 | 102/18723 | 2.80e-03 | 1.87e-02 | 23 |
| GO:00605626 | Cervix | CC | epithelial tube morphogenesis | 57/2311 | 325/18723 | 3.79e-03 | 2.41e-02 | 57 |
| GO:00140206 | Cervix | CC | primary neural tube formation | 21/2311 | 94/18723 | 4.68e-03 | 2.82e-02 | 21 |
| GO:00219156 | Cervix | CC | neural tube development | 30/2311 | 152/18723 | 6.00e-03 | 3.43e-02 | 30 |
| GO:0060562 | Colorectum | AD | epithelial tube morphogenesis | 93/3918 | 325/18723 | 5.65e-04 | 6.00e-03 | 93 |
| GO:0014020 | Colorectum | AD | primary neural tube formation | 33/3918 | 94/18723 | 1.02e-03 | 9.50e-03 | 33 |
| GO:0001841 | Colorectum | AD | neural tube formation | 35/3918 | 102/18723 | 1.16e-03 | 1.05e-02 | 35 |
| GO:0035148 | Colorectum | AD | tube formation | 45/3918 | 148/18723 | 4.13e-03 | 2.87e-02 | 45 |
| GO:0001838 | Colorectum | AD | embryonic epithelial tube formation | 38/3918 | 121/18723 | 4.40e-03 | 3.01e-02 | 38 |
| GO:0072175 | Colorectum | AD | epithelial tube formation | 40/3918 | 132/18723 | 6.98e-03 | 4.29e-02 | 40 |
| GO:0021915 | Colorectum | AD | neural tube development | 45/3918 | 152/18723 | 7.05e-03 | 4.31e-02 | 45 |
| GO:00605621 | Colorectum | MSS | epithelial tube morphogenesis | 88/3467 | 325/18723 | 8.45e-05 | 1.37e-03 | 88 |
| GO:00140201 | Colorectum | MSS | primary neural tube formation | 32/3467 | 94/18723 | 2.42e-04 | 3.30e-03 | 32 |
| GO:00018412 | Colorectum | MSS | neural tube formation | 34/3467 | 102/18723 | 2.48e-04 | 3.37e-03 | 34 |
| GO:00351481 | Colorectum | MSS | tube formation | 44/3467 | 148/18723 | 6.06e-04 | 6.68e-03 | 44 |
| GO:00018381 | Colorectum | MSS | embryonic epithelial tube formation | 37/3467 | 121/18723 | 8.95e-04 | 9.13e-03 | 37 |
| GO:00219151 | Colorectum | MSS | neural tube development | 43/3467 | 152/18723 | 2.05e-03 | 1.75e-02 | 43 |
| GO:00721751 | Colorectum | MSS | epithelial tube formation | 38/3467 | 132/18723 | 2.59e-03 | 2.05e-02 | 38 |
| GO:00605622 | Colorectum | FAP | epithelial tube morphogenesis | 71/2622 | 325/18723 | 7.23e-05 | 1.33e-03 | 71 |
| TF | Cell Type | Tissue | Disease Stage | Target Gene | RSS | Regulon Activity |
| LUZP1 | PVA | Breast | ADJ | TMEM70,CLIC1,ETS2, etc. | 2.57e-01 |  |
| LUZP1 | CD4TN | Skin | Healthy | ZNF219,PHF21A,SLC16A5, etc. | 3.05e-02 |  |
| LUZP1 | MVA | Thyroid | ATC | TMEM44,AFDN,TMEM173, etc. | 3.80e-01 |  |
| LUZP1 | LYMEND | Thyroid | Healthy | TMEM44,AFDN,TMEM173, etc. | 7.48e-02 |  |
| LUZP1 | MVA | Thyroid | HT | TMEM44,AFDN,TMEM173, etc. | 4.08e-01 |  |
| Hugo Symbol | Variant Class | Variant Classification | dbSNP RS | HGVSc | HGVSp | HGVSp Short | SWISSPROT | BIOTYPE | SIFT | PolyPhen | Tumor Sample Barcode | Tissue | Histology | Sex | Age | Stage | Therapy Types | Drugs | Outcome |
| LUZP1 | SNV | Missense_Mutation | | c.2790G>T | p.Leu930Phe | p.L930F | Q86V48 | protein_coding | tolerated(0.06) | possibly_damaging(0.839) | TCGA-AC-A23H-01 | Breast | breast invasive carcinoma | Female | >=65 | I/II | Unknown | Unknown | PD |
| LUZP1 | SNV | Missense_Mutation | rs560811130 | c.269G>A | p.Arg90His | p.R90H | Q86V48 | protein_coding | tolerated(0.17) | benign(0.003) | TCGA-BH-A0HK-01 | Breast | breast invasive carcinoma | Female | >=65 | I/II | Hormone Therapy | arimidex | SD |
| LUZP1 | SNV | Missense_Mutation | | c.2128N>A | p.Asp710Asn | p.D710N | Q86V48 | protein_coding | tolerated(1) | benign(0.003) | TCGA-BH-A18P-01 | Breast | breast invasive carcinoma | Female | <65 | I/II | Unknown | Unknown | PD |
| LUZP1 | SNV | Missense_Mutation | novel | c.1834C>A | p.Gln612Lys | p.Q612K | Q86V48 | protein_coding | deleterious(0.01) | possibly_damaging(0.84) | TCGA-C8-A1HK-01 | Breast | breast invasive carcinoma | Female | <65 | I/II | Unknown | Unknown | SD |
| LUZP1 | SNV | Missense_Mutation | | c.840N>G | p.Asn280Lys | p.N280K | Q86V48 | protein_coding | deleterious(0.02) | probably_damaging(0.998) | TCGA-D8-A13Z-01 | Breast | breast invasive carcinoma | Female | <65 | I/II | Chemotherapy | doxorubicine | SD |
| LUZP1 | insertion | In_Frame_Ins | novel | c.74_75insGTTTAAGCTACAGAGTCTAAGCCG | p.Phe18_Arg25dup | p.F18_R25dup | Q86V48 | protein_coding | | | TCGA-A2-A0T5-01 | Breast | breast invasive carcinoma | Female | <65 | I/II | Unspecific | Taxotere | SD |
| LUZP1 | insertion | Frame_Shift_Ins | novel | c.2141_2142insCT | p.Glu714AspfsTer2 | p.E714Dfs*2 | Q86V48 | protein_coding | | | TCGA-AN-A03Y-01 | Breast | breast invasive carcinoma | Female | >=65 | I/II | Unknown | Unknown | SD |
| LUZP1 | insertion | In_Frame_Ins | novel | c.2140_2141insCCTGTGTGACCCAGGATCTTGAGA | p.Glu714delinsAlaCysValThrGlnAspLeuGluLys | p.E714delinsACVTQDLEK | Q86V48 | protein_coding | | | TCGA-AN-A03Y-01 | Breast | breast invasive carcinoma | Female | >=65 | I/II | Unknown | Unknown | SD |
| LUZP1 | insertion | Frame_Shift_Ins | novel | c.2665_2666insAATCTGTCTTCTCTTCCCTTGGTTTGCCAGAGCAGCTAAAG | p.Arg889LysfsTer56 | p.R889Kfs*56 | Q86V48 | protein_coding | | | TCGA-AO-A03O-01 | Breast | breast invasive carcinoma | Female | >=65 | I/II | Chemotherapy | doxorubicin | SD |
| LUZP1 | insertion | In_Frame_Ins | novel | c.2754_2755insGCCAGAGCAGCTAAAGGAGCTCCCCGTAGG | p.Val918_Thr919insAlaArgAlaAlaLysGlyAlaProArgArg | p.V918_T919insARAAKGAPRR | Q86V48 | protein_coding | | | TCGA-BH-A0B8-01 | Breast | breast invasive carcinoma | Female | <65 | I/II | Hormone Therapy | arimidex | SD |


