
|
|||||
|
 | |
| |
| |
| |
| |
| |
|
Gene: LURAP1L |
Gene summary for LURAP1L |
| Gene information | Species | Human | Gene symbol | LURAP1L | Gene ID | 286343 |
| Gene name | leucine rich adaptor protein 1 like | |
| Gene Alias | C9orf150 | |
| Cytomap | 9p23 | |
| Gene Type | protein-coding | GO ID | GO:0007154 | UniProtAcc | Q8IV03 |
Top |
Malignant transformation analysis |
| Identification of the aberrant gene expression in precancerous and cancerous lesions by comparing the gene expression of stem-like cells in diseased tissues with normal stem cells |
| Entrez ID | Symbol | Replicates | Species | Organ | Tissue | Adj P-value | Log2FC | Malignancy |
| 286343 | LURAP1L | CA_HPV_3 | Human | Cervix | CC | 1.46e-02 | 1.41e-01 | 0.0414 |
| 286343 | LURAP1L | CCI_1 | Human | Cervix | CC | 4.25e-03 | 6.61e-01 | 0.528 |
| 286343 | LURAP1L | Tumor | Human | Cervix | CC | 6.60e-25 | 5.13e-01 | 0.1241 |
| 286343 | LURAP1L | sample3 | Human | Cervix | CC | 1.06e-31 | 6.63e-01 | 0.1387 |
| 286343 | LURAP1L | T3 | Human | Cervix | CC | 1.91e-40 | 6.55e-01 | 0.1389 |
| 286343 | LURAP1L | HTA11_3410_2000001011 | Human | Colorectum | AD | 2.04e-09 | -4.95e-01 | 0.0155 |
| 286343 | LURAP1L | HTA11_2487_2000001011 | Human | Colorectum | SER | 6.25e-13 | -6.44e-01 | -0.1808 |
| 286343 | LURAP1L | HTA11_78_2000001011 | Human | Colorectum | AD | 9.47e-07 | -5.19e-01 | -0.1088 |
| 286343 | LURAP1L | HTA11_347_2000001011 | Human | Colorectum | AD | 1.27e-10 | -4.86e-01 | -0.1954 |
| 286343 | LURAP1L | HTA11_3361_2000001011 | Human | Colorectum | AD | 4.14e-08 | -6.14e-01 | -0.1207 |
| 286343 | LURAP1L | HTA11_83_2000001011 | Human | Colorectum | SER | 1.34e-02 | -4.73e-01 | -0.1526 |
| 286343 | LURAP1L | HTA11_696_2000001011 | Human | Colorectum | AD | 1.41e-22 | -5.54e-01 | -0.1464 |
| 286343 | LURAP1L | HTA11_866_2000001011 | Human | Colorectum | AD | 1.08e-15 | -5.25e-01 | -0.1001 |
| 286343 | LURAP1L | HTA11_1391_2000001011 | Human | Colorectum | AD | 2.88e-03 | -3.55e-01 | -0.059 |
| 286343 | LURAP1L | HTA11_546_2000001011 | Human | Colorectum | AD | 1.14e-02 | -5.45e-01 | -0.0842 |
| 286343 | LURAP1L | HTA11_866_3004761011 | Human | Colorectum | AD | 2.72e-02 | -3.87e-01 | 0.096 |
| 286343 | LURAP1L | HTA11_10711_2000001011 | Human | Colorectum | AD | 2.90e-02 | -4.43e-01 | 0.0338 |
| 286343 | LURAP1L | HTA11_7696_3000711011 | Human | Colorectum | AD | 9.57e-11 | -4.34e-01 | 0.0674 |
| 286343 | LURAP1L | HTA11_99999970781_79442 | Human | Colorectum | MSS | 1.12e-08 | -3.82e-01 | 0.294 |
| 286343 | LURAP1L | HTA11_99999965104_69814 | Human | Colorectum | MSS | 9.71e-03 | -4.84e-01 | 0.281 |
| Page: 1 2 3 4 5 6 |
| Tissue | Expression Dynamics | Abbreviation |
| Cervix | 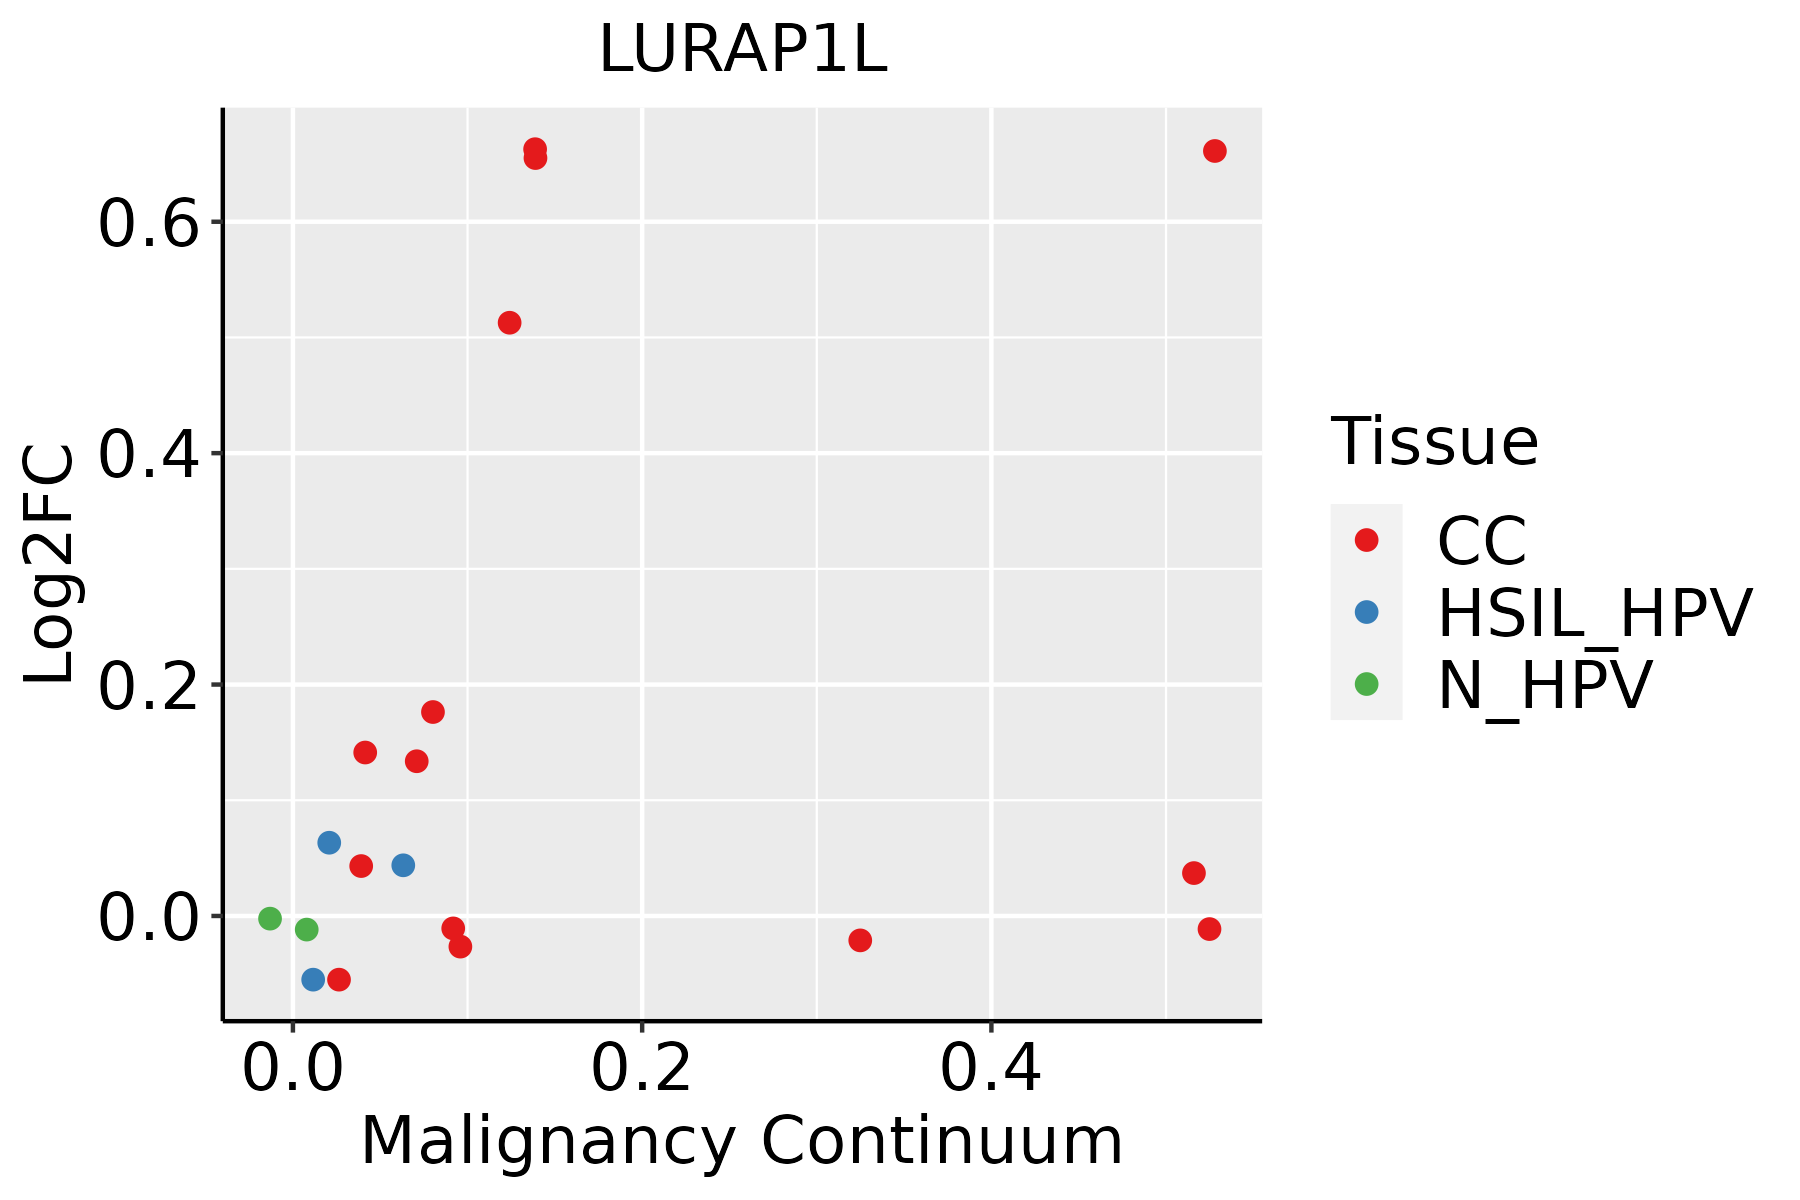 | CC: Cervix cancer |
| HSIL_HPV: HPV-infected high-grade squamous intraepithelial lesions | ||
| N_HPV: HPV-infected normal cervix | ||
| Colorectum (GSE201348) |  | FAP: Familial adenomatous polyposis |
| CRC: Colorectal cancer | ||
| Colorectum (HTA11) |  | AD: Adenomas |
| SER: Sessile serrated lesions | ||
| MSI-H: Microsatellite-high colorectal cancer | ||
| MSS: Microsatellite stable colorectal cancer | ||
| Esophagus | 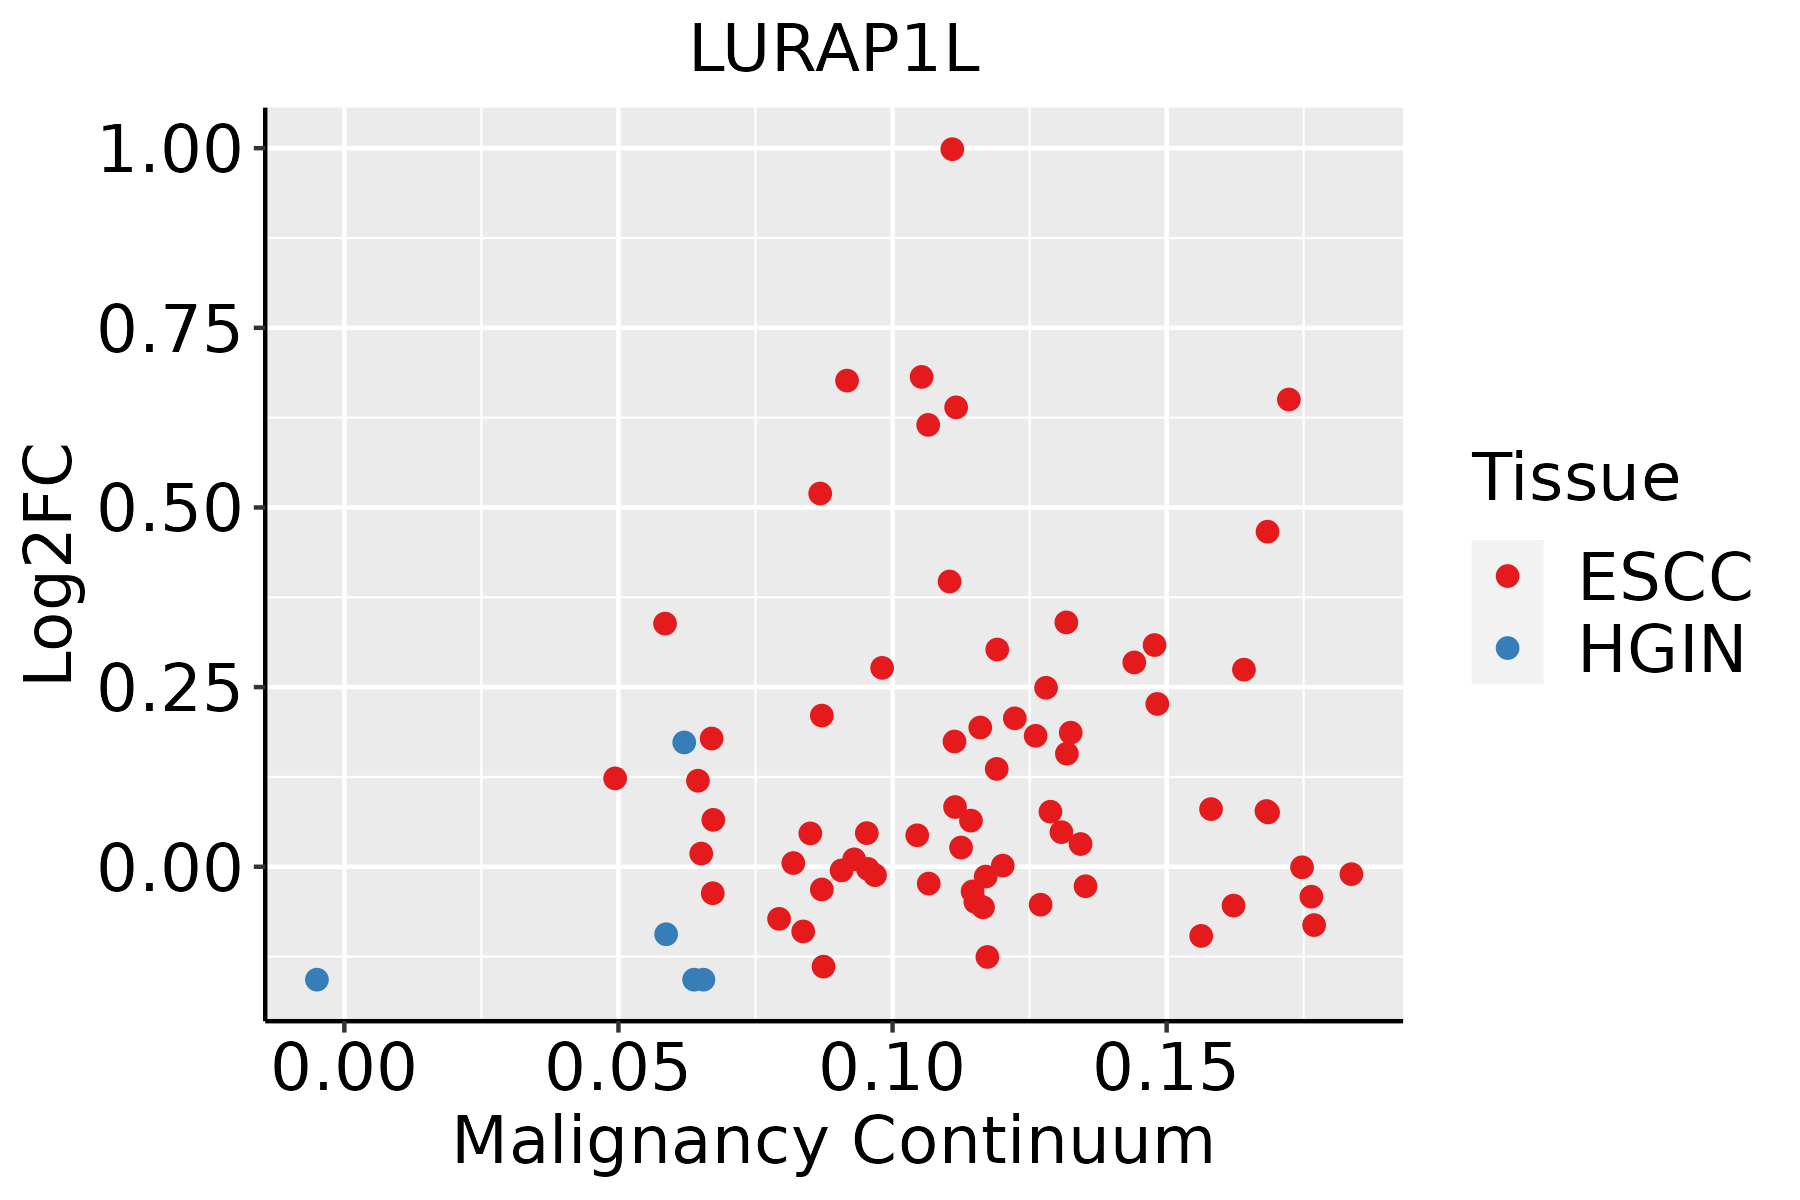 | ESCC: Esophageal squamous cell carcinoma |
| HGIN: High-grade intraepithelial neoplasias | ||
| LGIN: Low-grade intraepithelial neoplasias | ||
| Liver | 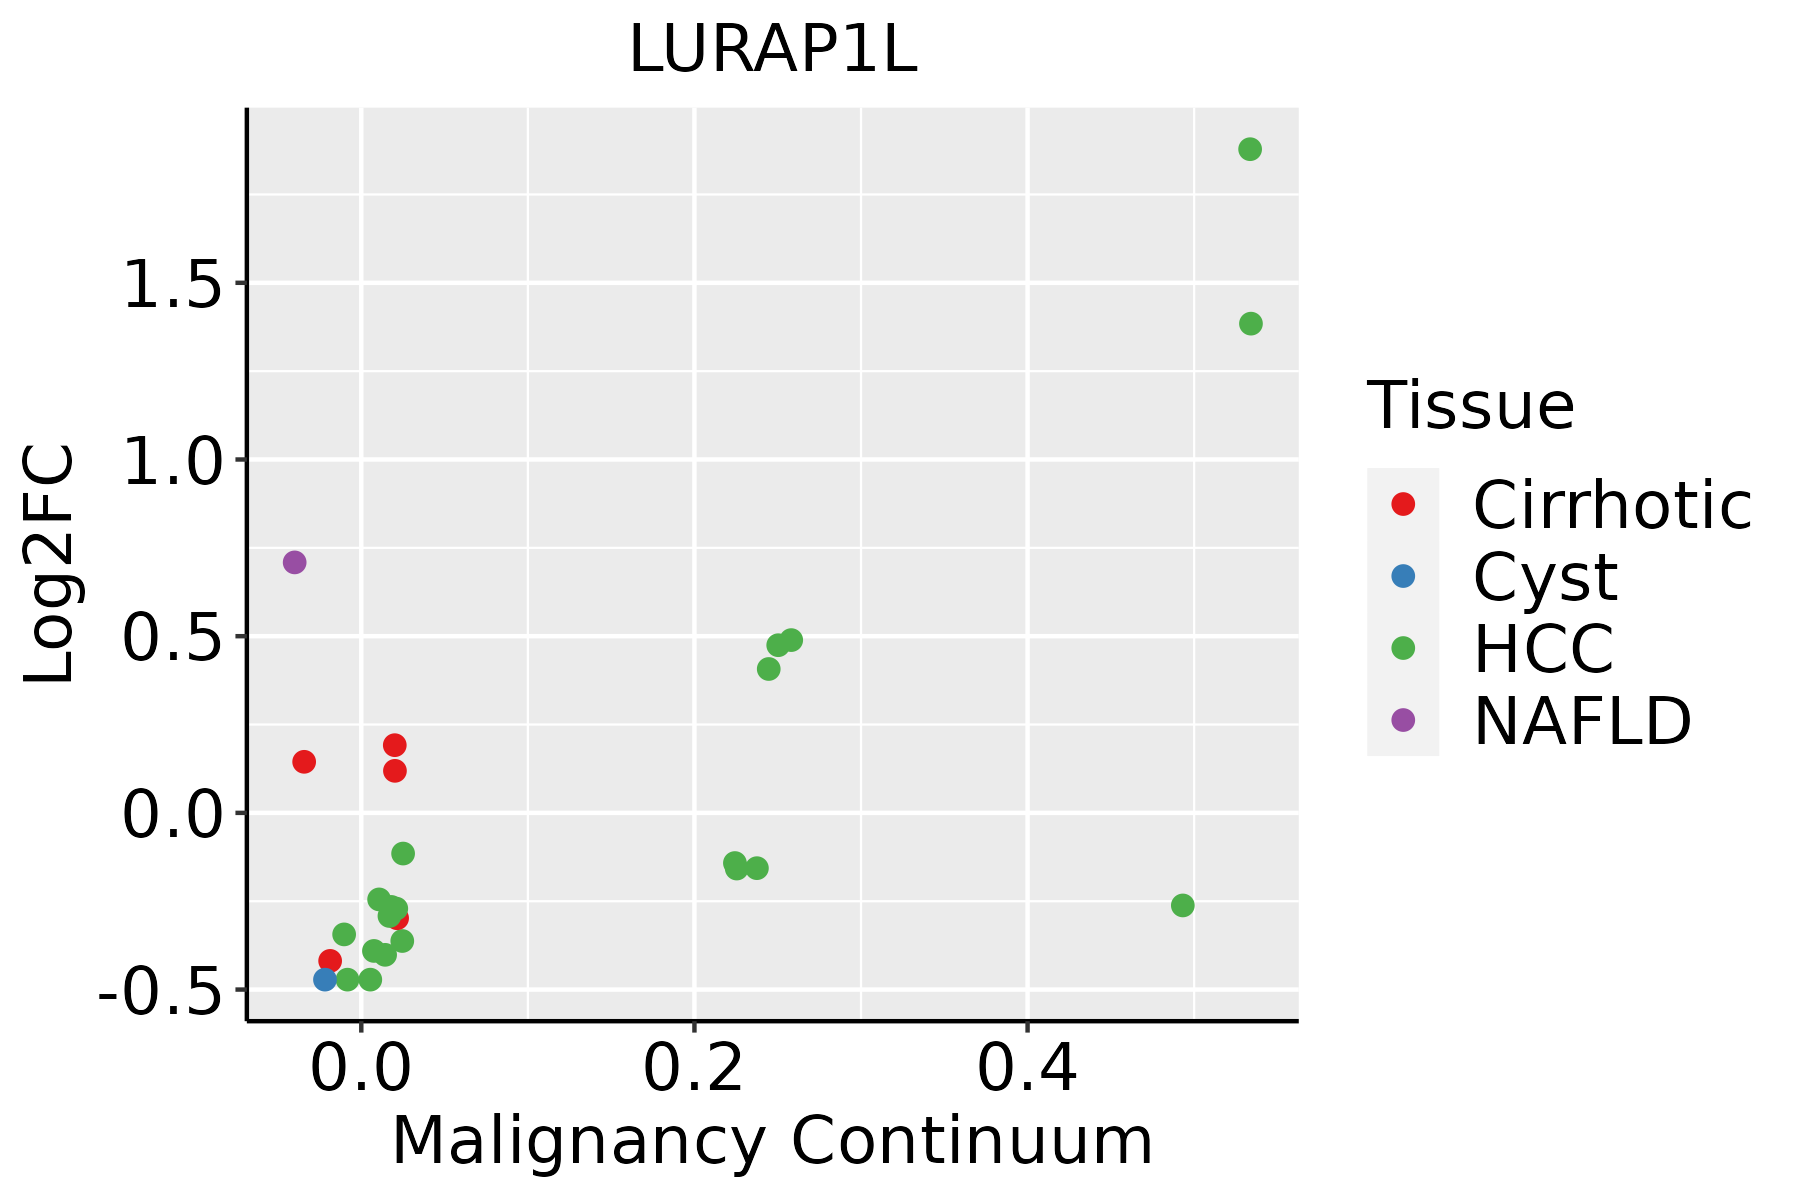 | HCC: Hepatocellular carcinoma |
| NAFLD: Non-alcoholic fatty liver disease | ||
| Lung | 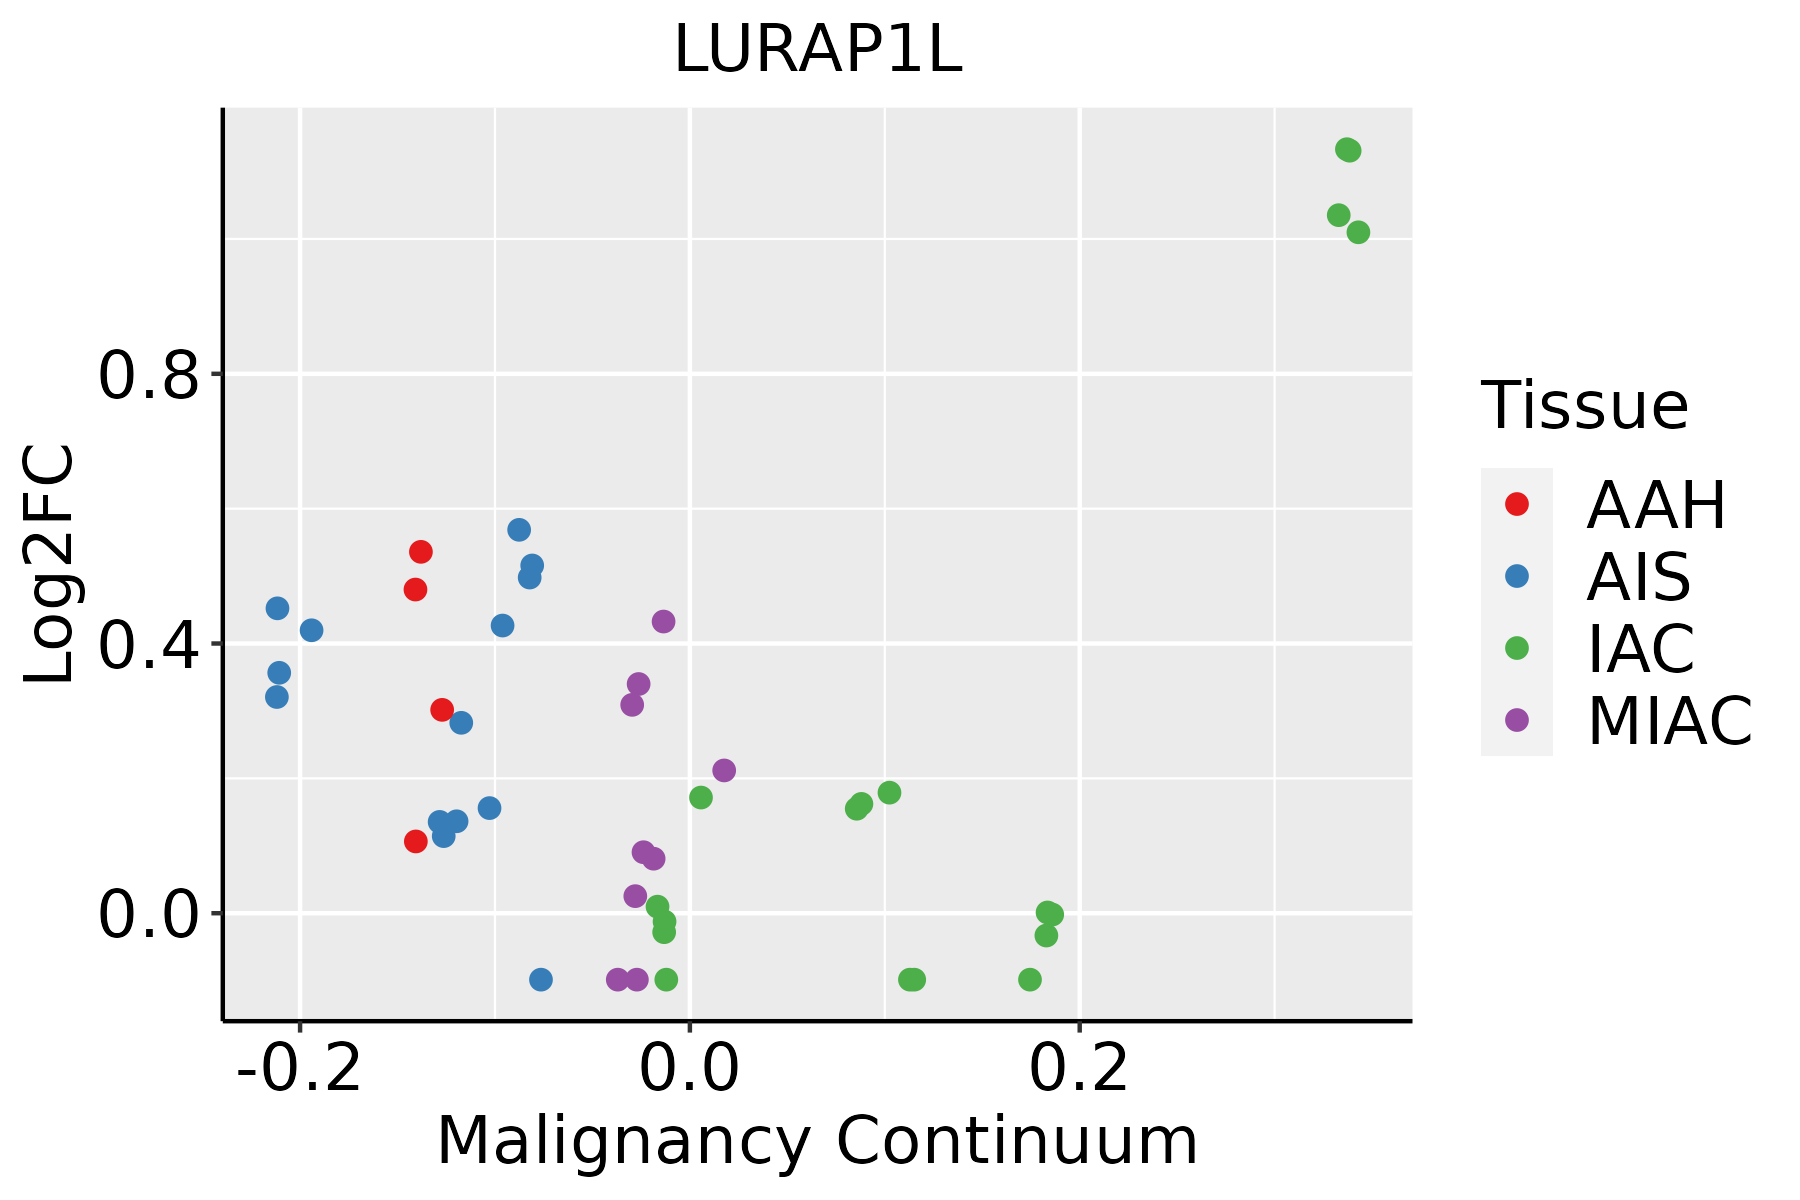 | AAH: Atypical adenomatous hyperplasia |
| AIS: Adenocarcinoma in situ | ||
| IAC: Invasive lung adenocarcinoma | ||
| MIA: Minimally invasive adenocarcinoma | ||
| Oral Cavity | 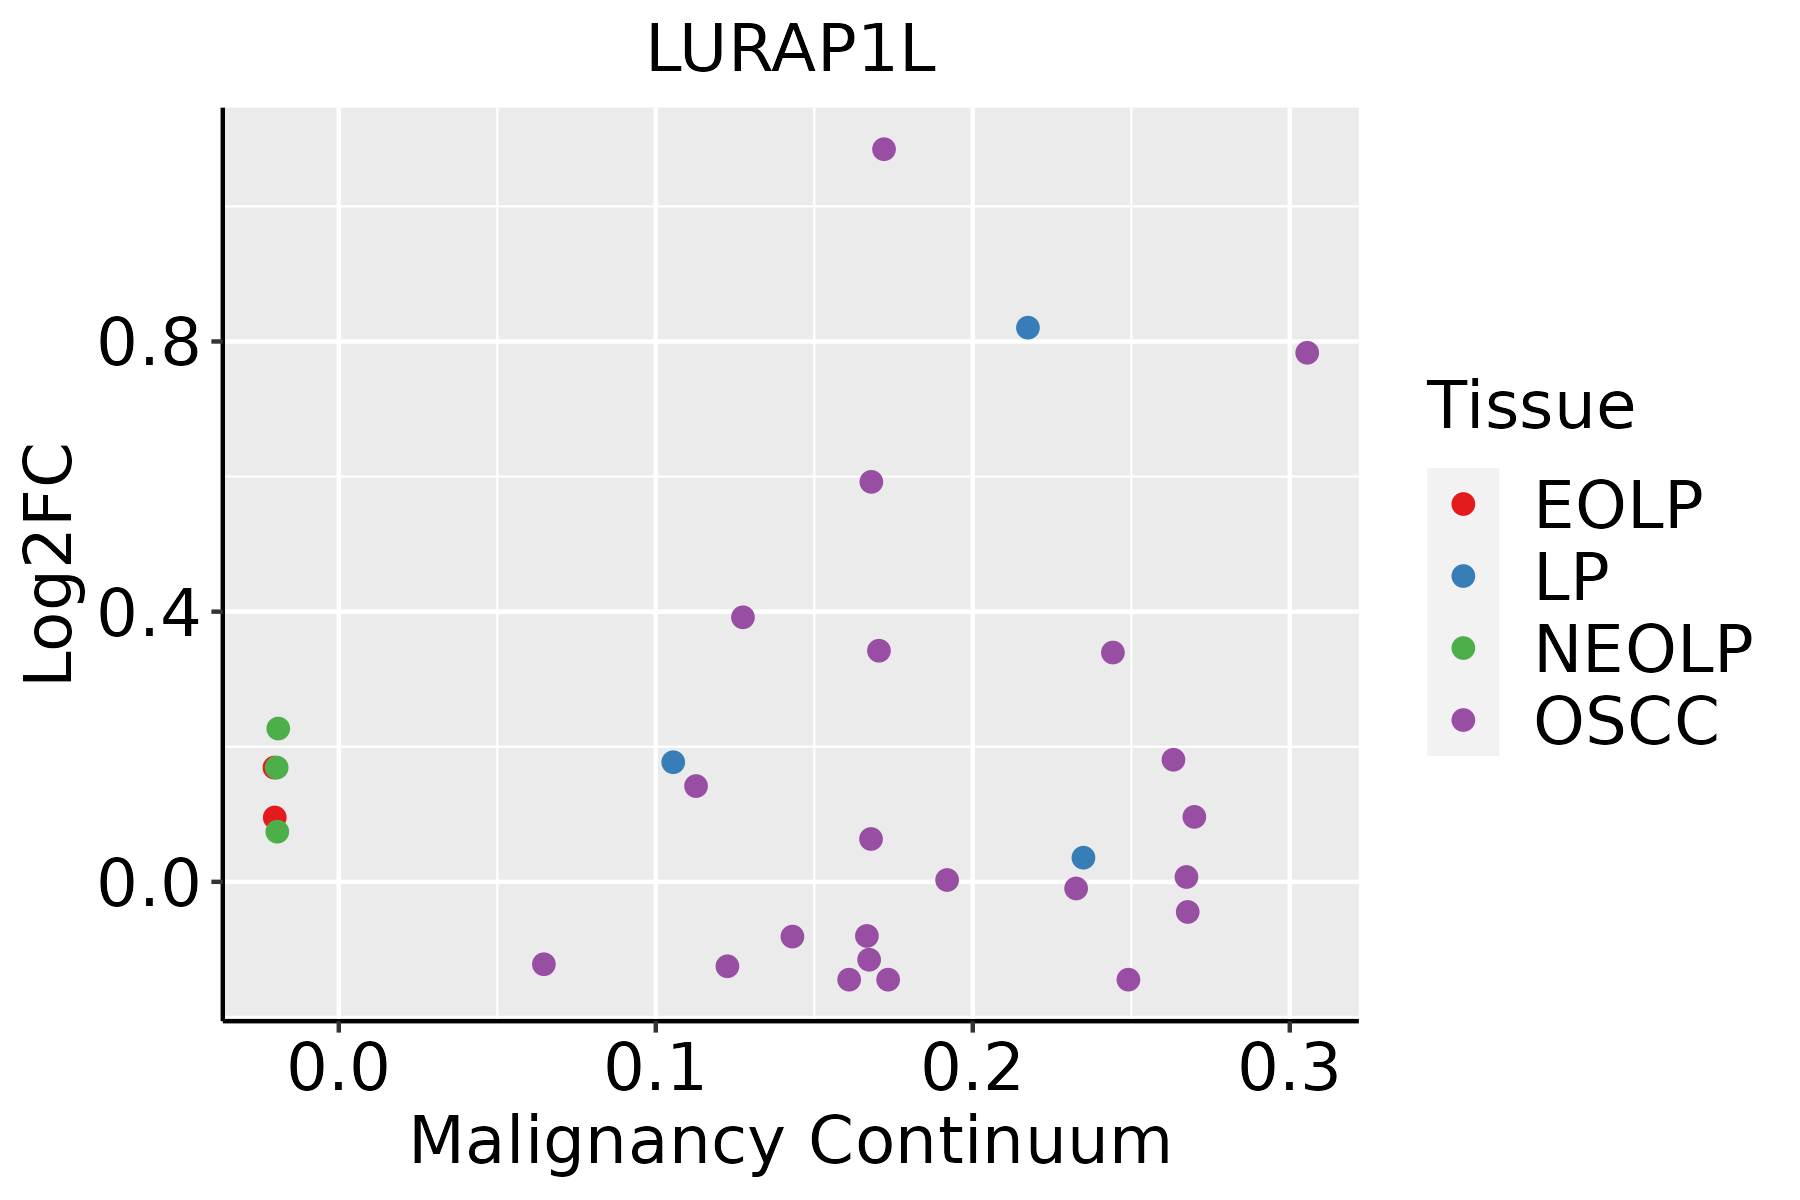 | EOLP: Erosive Oral lichen planus |
| LP: leukoplakia | ||
| NEOLP: Non-erosive oral lichen planus | ||
| OSCC: Oral squamous cell carcinoma | ||
| Prostate |  | BPH: Benign Prostatic Hyperplasia |
| ∗log2FC in expression of this searched gene in stem-like cells from each diseased tissue sample relative to stem-like cells in normal samples in each tissue plotted against the malignancy continuum. Samples are colored based on if they are from different disease stage. |
Top |
Malignant transformation related pathway analysis |
| Find out the enriched GO biological processes and KEGG pathways involved in transition from healthy to precancer to cancer |
| Tissue | Disease Stage | Enriched GO biological Processes |
| Colorectum | AD |  |
| Colorectum | SER |  |
| Colorectum | MSS |  |
| Colorectum | MSI-H |  |
| Colorectum | FAP |  |
| ∗Top 15 enriched GO BP terms are showed in the bar plot of each disease state in each tissue. Each row represents a significant GO biological process which is colored according to the -log10(p.adjust). |
| Page: 1 2 3 4 5 6 7 8 9 |
| GO ID | Tissue | Disease Stage | Description | Gene Ratio | Bg Ratio | pvalue | p.adjust | Count |
| GO:00431228 | Cervix | CC | regulation of I-kappaB kinase/NF-kappaB signaling | 53/2311 | 249/18723 | 4.50e-05 | 6.87e-04 | 53 |
| GO:00072497 | Cervix | CC | I-kappaB kinase/NF-kappaB signaling | 56/2311 | 281/18723 | 1.81e-04 | 2.12e-03 | 56 |
| GO:00431237 | Cervix | CC | positive regulation of I-kappaB kinase/NF-kappaB signaling | 37/2311 | 186/18723 | 2.15e-03 | 1.55e-02 | 37 |
| GO:0043123 | Colorectum | AD | positive regulation of I-kappaB kinase/NF-kappaB signaling | 60/3918 | 186/18723 | 1.91e-04 | 2.56e-03 | 60 |
| GO:0043122 | Colorectum | AD | regulation of I-kappaB kinase/NF-kappaB signaling | 76/3918 | 249/18723 | 2.17e-04 | 2.85e-03 | 76 |
| GO:0007249 | Colorectum | AD | I-kappaB kinase/NF-kappaB signaling | 82/3918 | 281/18723 | 6.09e-04 | 6.40e-03 | 82 |
| GO:00431221 | Colorectum | MSS | regulation of I-kappaB kinase/NF-kappaB signaling | 71/3467 | 249/18723 | 7.12e-05 | 1.21e-03 | 71 |
| GO:00072491 | Colorectum | MSS | I-kappaB kinase/NF-kappaB signaling | 77/3467 | 281/18723 | 1.51e-04 | 2.19e-03 | 77 |
| GO:00431231 | Colorectum | MSS | positive regulation of I-kappaB kinase/NF-kappaB signaling | 55/3467 | 186/18723 | 1.60e-04 | 2.29e-03 | 55 |
| GO:00431222 | Colorectum | FAP | regulation of I-kappaB kinase/NF-kappaB signaling | 56/2622 | 249/18723 | 1.82e-04 | 2.69e-03 | 56 |
| GO:00431232 | Colorectum | FAP | positive regulation of I-kappaB kinase/NF-kappaB signaling | 42/2622 | 186/18723 | 1.01e-03 | 9.89e-03 | 42 |
| GO:00072492 | Colorectum | FAP | I-kappaB kinase/NF-kappaB signaling | 58/2622 | 281/18723 | 1.37e-03 | 1.24e-02 | 58 |
| GO:00431223 | Colorectum | CRC | regulation of I-kappaB kinase/NF-kappaB signaling | 41/2078 | 249/18723 | 6.39e-03 | 4.64e-02 | 41 |
| GO:004312318 | Esophagus | ESCC | positive regulation of I-kappaB kinase/NF-kappaB signaling | 132/8552 | 186/18723 | 2.07e-12 | 8.58e-11 | 132 |
| GO:0043122110 | Esophagus | ESCC | regulation of I-kappaB kinase/NF-kappaB signaling | 167/8552 | 249/18723 | 6.11e-12 | 2.32e-10 | 167 |
| GO:000724919 | Esophagus | ESCC | I-kappaB kinase/NF-kappaB signaling | 183/8552 | 281/18723 | 3.02e-11 | 1.01e-09 | 183 |
| GO:00072494 | Liver | Cirrhotic | I-kappaB kinase/NF-kappaB signaling | 108/4634 | 281/18723 | 2.21e-07 | 5.64e-06 | 108 |
| GO:00431225 | Liver | Cirrhotic | regulation of I-kappaB kinase/NF-kappaB signaling | 95/4634 | 249/18723 | 1.68e-06 | 3.22e-05 | 95 |
| GO:00431234 | Liver | Cirrhotic | positive regulation of I-kappaB kinase/NF-kappaB signaling | 71/4634 | 186/18723 | 3.20e-05 | 3.97e-04 | 71 |
| GO:000724912 | Liver | HCC | I-kappaB kinase/NF-kappaB signaling | 156/7958 | 281/18723 | 6.66e-06 | 8.00e-05 | 156 |
| Page: 1 2 3 |
| Pathway ID | Tissue | Disease Stage | Description | Gene Ratio | Bg Ratio | pvalue | p.adjust | qvalue | Count |
| Page: 1 |
Top |
Cell-cell communication analysis |
| Identification of potential cell-cell interactions between two cell types and their ligand-receptor pairs for different disease states |
| Ligand | Receptor | LRpair | Pathway | Tissue | Disease Stage |
| Page: 1 |
Top |
Single-cell gene regulatory network inference analysis |
| Find out the significant the regulons (TFs) and the target genes of each regulon across cell types for different disease states |
| TF | Cell Type | Tissue | Disease Stage | Target Gene | RSS | Regulon Activity |
| ∗The dot plots of a searched regulon are shown for all cell subpopulations in each disease state of each tissue based on the regulon specific score inferred using pySCENIC and by calculating the average expression. |
| Page: 1 |
Top |
Somatic mutation of malignant transformation related genes |
| Annotation of somatic variants for genes involved in malignant transformation |
| Hugo Symbol | Variant Class | Variant Classification | dbSNP RS | HGVSc | HGVSp | HGVSp Short | SWISSPROT | BIOTYPE | SIFT | PolyPhen | Tumor Sample Barcode | Tissue | Histology | Sex | Age | Stage | Therapy Types | Drugs | Outcome |
| LURAP1L | SNV | Missense_Mutation | novel | c.37N>C | p.Glu13Gln | p.E13Q | Q8IV03 | protein_coding | deleterious(0) | probably_damaging(1) | TCGA-5L-AAT1-01 | Breast | breast invasive carcinoma | Female | <65 | III/IV | Hormone Therapy | letrozol | SD |
| LURAP1L | SNV | Missense_Mutation | novel | c.472N>C | p.Thr158Pro | p.T158P | Q8IV03 | protein_coding | deleterious(0.01) | benign(0.082) | TCGA-BH-A0BR-01 | Breast | breast invasive carcinoma | Female | <65 | I/II | Unknown | Unknown | SD |
| LURAP1L | SNV | Missense_Mutation | novel | c.472A>C | p.Thr158Pro | p.T158P | Q8IV03 | protein_coding | deleterious(0.01) | benign(0.082) | TCGA-BH-A1FC-01 | Breast | breast invasive carcinoma | Female | >=65 | I/II | Unknown | Unknown | SD |
| LURAP1L | SNV | Missense_Mutation | novel | c.472N>C | p.Thr158Pro | p.T158P | Q8IV03 | protein_coding | deleterious(0.01) | benign(0.082) | TCGA-E9-A22A-01 | Breast | breast invasive carcinoma | Female | >=65 | I/II | Hormone Therapy | tamoxiphen | SD |
| LURAP1L | deletion | Frame_Shift_Del | novel | c.230delC | p.Pro77GlnfsTer17 | p.P77Qfs*17 | Q8IV03 | protein_coding | TCGA-EW-A2FV-01 | Breast | breast invasive carcinoma | Female | <65 | III/IV | Chemotherapy | docetaxel | SD | ||
| LURAP1L | SNV | Missense_Mutation | c.280N>C | p.Glu94Gln | p.E94Q | Q8IV03 | protein_coding | tolerated(0.19) | benign(0.021) | TCGA-IR-A3LA-01 | Cervix | cervical & endocervical cancer | Female | <65 | I/II | Chemotherapy | cisplatin | CR | |
| LURAP1L | SNV | Missense_Mutation | c.412N>G | p.Ile138Val | p.I138V | Q8IV03 | protein_coding | tolerated(0.45) | benign(0.011) | TCGA-AA-3672-01 | Colorectum | colon adenocarcinoma | Female | >=65 | III/IV | Unknown | Unknown | SD | |
| LURAP1L | SNV | Missense_Mutation | c.355C>A | p.Leu119Ile | p.L119I | Q8IV03 | protein_coding | deleterious(0.04) | probably_damaging(0.988) | TCGA-AZ-6598-01 | Colorectum | colon adenocarcinoma | Female | >=65 | I/II | Unknown | Unknown | SD | |
| LURAP1L | SNV | Missense_Mutation | c.346N>T | p.Arg116Cys | p.R116C | Q8IV03 | protein_coding | deleterious(0) | probably_damaging(0.996) | TCGA-G4-6302-01 | Colorectum | colon adenocarcinoma | Female | >=65 | I/II | Unknown | Unknown | SD | |
| LURAP1L | SNV | Missense_Mutation | c.82N>T | p.Leu28Phe | p.L28F | Q8IV03 | protein_coding | deleterious(0) | probably_damaging(0.996) | TCGA-A5-A0G2-01 | Endometrium | uterine corpus endometrioid carcinoma | Female | <65 | III/IV | Unknown | Unknown | SD |
| Page: 1 2 3 |
Top |
Related drugs of malignant transformation related genes |
| Identification of chemicals and drugs interact with genes involved in malignant transfromation |
| (DGIdb 4.0) |
| Entrez ID | Symbol | Category | Interaction Types | Drug Claim Name | Drug Name | PMIDs |
| Page: 1 |

Copyright 2023-Present -The University of Texas Health Science Center at Houston |