
|
|||||
|
 | |
| |
| |
| |
| |
| |
|
Gene: LUM |
Gene summary for LUM |
| Gene information | Species | Human | Gene symbol | LUM | Gene ID | 4060 |
| Gene name | lumican | |
| Gene Alias | LDC | |
| Cytomap | 12q21.33 | |
| Gene Type | protein-coding | GO ID | GO:0001501 | UniProtAcc | P51884 |
Top |
Malignant transformation analysis |
| Identification of the aberrant gene expression in precancerous and cancerous lesions by comparing the gene expression of stem-like cells in diseased tissues with normal stem cells |
| Entrez ID | Symbol | Replicates | Species | Organ | Tissue | Adj P-value | Log2FC | Malignancy |
| 4060 | LUM | AEH-subject1 | Human | Endometrium | AEH | 2.21e-32 | -1.03e+00 | -0.3059 |
| 4060 | LUM | AEH-subject2 | Human | Endometrium | AEH | 1.32e-45 | -1.25e+00 | -0.2525 |
| 4060 | LUM | AEH-subject3 | Human | Endometrium | AEH | 2.86e-47 | -1.19e+00 | -0.2576 |
| 4060 | LUM | AEH-subject4 | Human | Endometrium | AEH | 4.01e-12 | -7.54e-01 | -0.2657 |
| 4060 | LUM | AEH-subject5 | Human | Endometrium | AEH | 1.78e-60 | -1.32e+00 | -0.2953 |
| 4060 | LUM | EEC-subject1 | Human | Endometrium | EEC | 1.86e-51 | -1.29e+00 | -0.2682 |
| 4060 | LUM | EEC-subject2 | Human | Endometrium | EEC | 2.05e-62 | -1.32e+00 | -0.2607 |
| 4060 | LUM | EEC-subject3 | Human | Endometrium | EEC | 9.52e-57 | -1.25e+00 | -0.2525 |
| 4060 | LUM | EEC-subject4 | Human | Endometrium | EEC | 2.62e-35 | -1.09e+00 | -0.2571 |
| 4060 | LUM | EEC-subject5 | Human | Endometrium | EEC | 1.83e-55 | -1.25e+00 | -0.249 |
| 4060 | LUM | GSM5276934 | Human | Endometrium | EEC | 3.34e-08 | -5.59e-01 | -0.0913 |
| 4060 | LUM | GSM5276935 | Human | Endometrium | EEC | 1.22e-58 | -1.32e+00 | -0.123 |
| 4060 | LUM | GSM5276937 | Human | Endometrium | EEC | 4.24e-07 | -4.63e-01 | -0.0897 |
| 4060 | LUM | GSM6177620_NYU_UCEC1_lib1_lib1 | Human | Endometrium | EEC | 2.58e-48 | -1.34e+00 | -0.1869 |
| 4060 | LUM | GSM6177620_NYU_UCEC1_lib2_lib2 | Human | Endometrium | EEC | 1.81e-48 | -1.38e+00 | -0.1875 |
| 4060 | LUM | GSM6177620_NYU_UCEC1_lib3_lib3 | Human | Endometrium | EEC | 2.37e-55 | -1.38e+00 | -0.1883 |
| 4060 | LUM | GSM6177621_NYU_UCEC2_lib1_lib1 | Human | Endometrium | EEC | 1.35e-63 | -1.33e+00 | -0.1934 |
| 4060 | LUM | GSM6177622_NYU_UCEC3_lib1_lib1 | Human | Endometrium | EEC | 1.09e-74 | -1.38e+00 | -0.1917 |
| 4060 | LUM | GSM6177622_NYU_UCEC3_lib2_lib2 | Human | Endometrium | EEC | 1.70e-69 | -1.38e+00 | -0.1916 |
| 4060 | LUM | GSM6177623_NYU_UCEC3_Vis | Human | Endometrium | EEC | 1.27e-02 | -4.64e-01 | -0.1269 |
| Page: 1 2 3 4 |
| Tissue | Expression Dynamics | Abbreviation |
| Endometrium |  | AEH: Atypical endometrial hyperplasia |
| EEC: Endometrioid Cancer | ||
| Esophagus |  | ESCC: Esophageal squamous cell carcinoma |
| HGIN: High-grade intraepithelial neoplasias | ||
| LGIN: Low-grade intraepithelial neoplasias | ||
| Oral Cavity |  | EOLP: Erosive Oral lichen planus |
| LP: leukoplakia | ||
| NEOLP: Non-erosive oral lichen planus | ||
| OSCC: Oral squamous cell carcinoma | ||
| Skin | 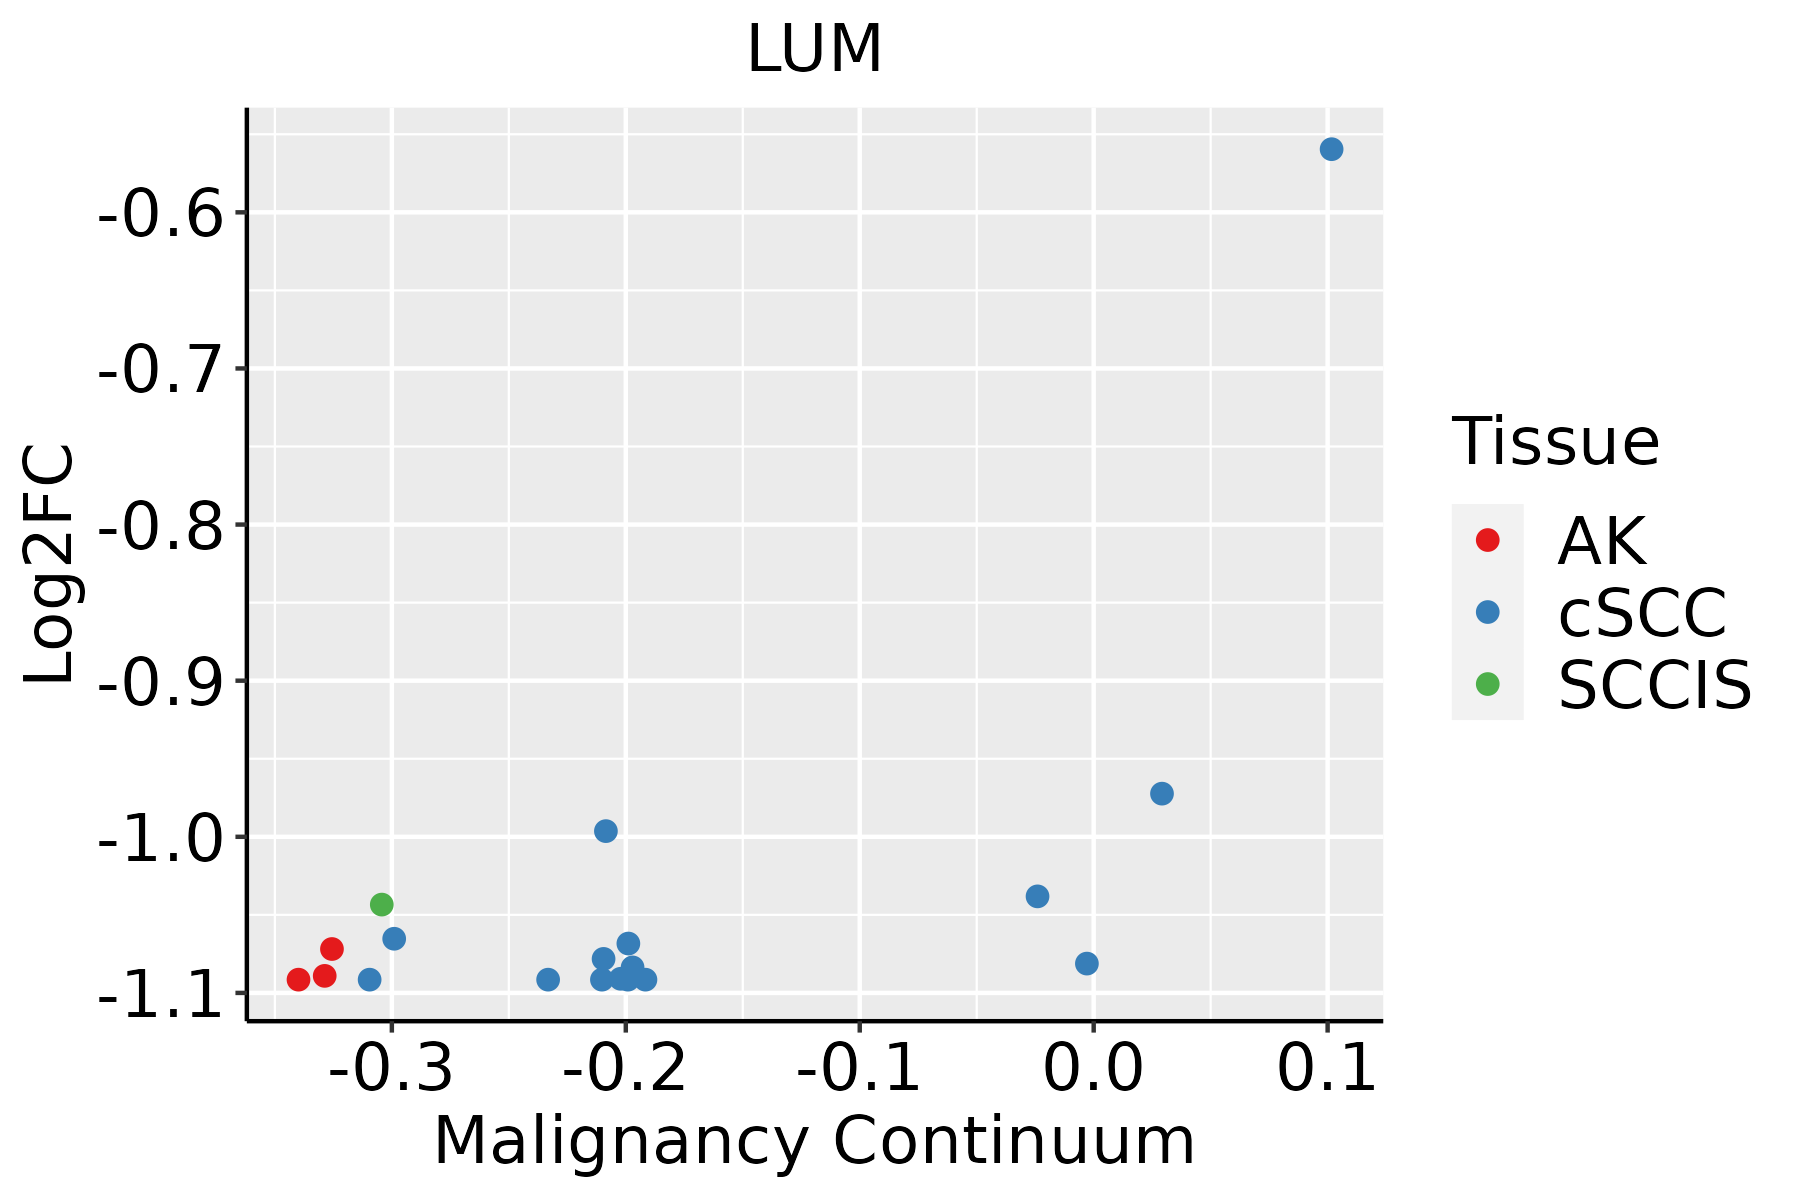 | AK: Actinic keratosis |
| cSCC: Cutaneous squamous cell carcinoma | ||
| SCCIS:squamous cell carcinoma in situ | ||
| Thyroid | 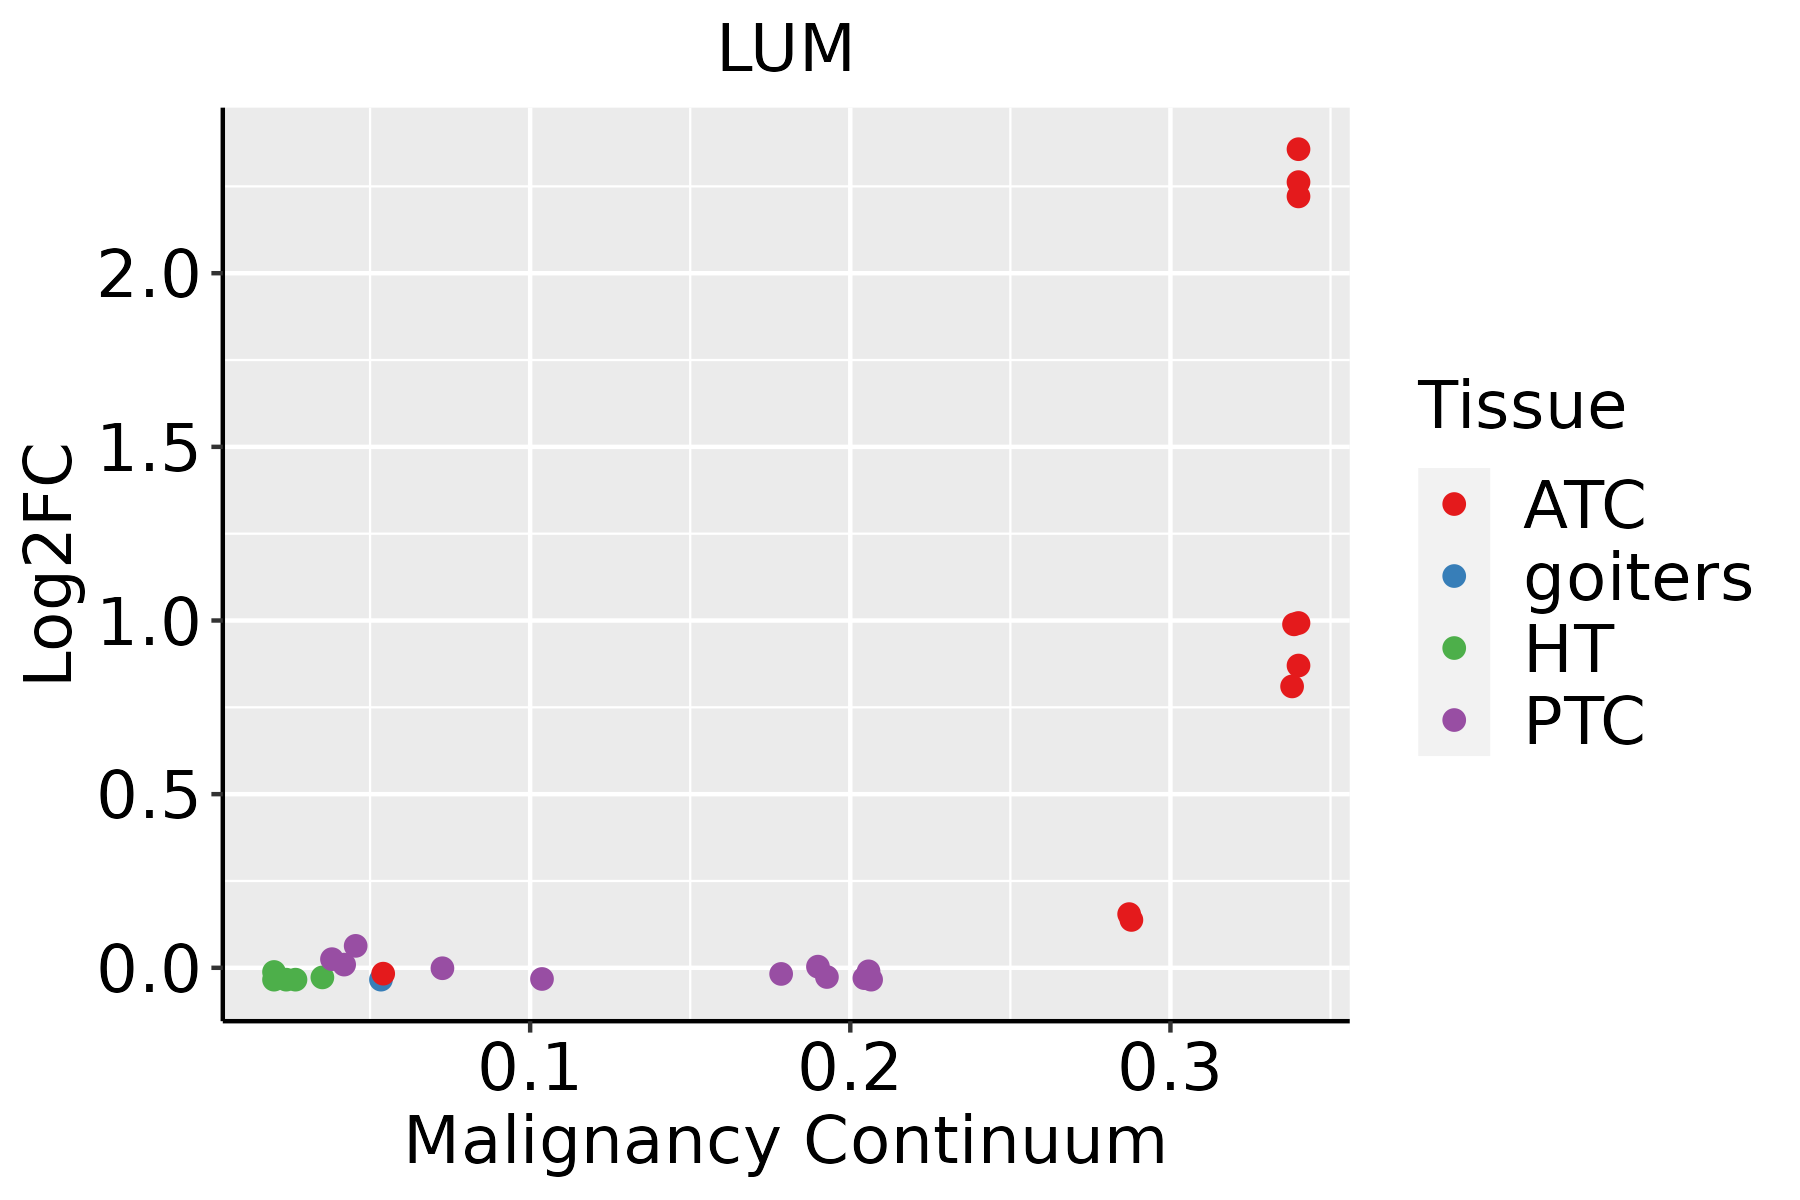 | ATC: Anaplastic thyroid cancer |
| HT: Hashimoto's thyroiditis | ||
| PTC: Papillary thyroid cancer |
| ∗log2FC in expression of this searched gene in stem-like cells from each diseased tissue sample relative to stem-like cells in normal samples in each tissue plotted against the malignancy continuum. Samples are colored based on if they are from different disease stage. |
Top |
Malignant transformation related pathway analysis |
| Find out the enriched GO biological processes and KEGG pathways involved in transition from healthy to precancer to cancer |
| Tissue | Disease Stage | Enriched GO biological Processes |
| Colorectum | AD |  |
| Colorectum | SER |  |
| Colorectum | MSS |  |
| Colorectum | MSI-H |  |
| Colorectum | FAP |  |
| ∗Top 15 enriched GO BP terms are showed in the bar plot of each disease state in each tissue. Each row represents a significant GO biological process which is colored according to the -log10(p.adjust). |
| Page: 1 2 3 4 5 6 7 8 9 |
| GO ID | Tissue | Disease Stage | Description | Gene Ratio | Bg Ratio | pvalue | p.adjust | Count |
| GO:0061448 | Endometrium | AEH | connective tissue development | 44/2100 | 252/18723 | 1.92e-03 | 1.51e-02 | 44 |
| GO:00018198 | Endometrium | AEH | positive regulation of cytokine production | 71/2100 | 467/18723 | 4.76e-03 | 3.02e-02 | 71 |
| GO:0030199 | Endometrium | AEH | collagen fibril organization | 14/2100 | 61/18723 | 6.65e-03 | 3.91e-02 | 14 |
| GO:00614481 | Endometrium | EEC | connective tissue development | 44/2168 | 252/18723 | 3.51e-03 | 2.36e-02 | 44 |
| GO:000181913 | Endometrium | EEC | positive regulation of cytokine production | 73/2168 | 467/18723 | 4.64e-03 | 2.97e-02 | 73 |
| GO:00301991 | Endometrium | EEC | collagen fibril organization | 14/2168 | 61/18723 | 8.76e-03 | 4.74e-02 | 14 |
| GO:00301984 | Esophagus | ESCC | extracellular matrix organization | 171/8552 | 301/18723 | 6.08e-05 | 4.67e-04 | 171 |
| GO:00430624 | Esophagus | ESCC | extracellular structure organization | 171/8552 | 302/18723 | 7.73e-05 | 5.76e-04 | 171 |
| GO:00452294 | Esophagus | ESCC | external encapsulating structure organization | 172/8552 | 304/18723 | 7.80e-05 | 5.80e-04 | 172 |
| GO:00301993 | Esophagus | ESCC | collagen fibril organization | 40/8552 | 61/18723 | 1.35e-03 | 6.44e-03 | 40 |
| GO:000181916 | Esophagus | ESCC | positive regulation of cytokine production | 244/8552 | 467/18723 | 2.29e-03 | 1.01e-02 | 244 |
| GO:00716347 | Esophagus | ESCC | regulation of transforming growth factor beta production | 28/8552 | 41/18723 | 2.88e-03 | 1.21e-02 | 28 |
| GO:00716046 | Esophagus | ESCC | transforming growth factor beta production | 29/8552 | 43/18723 | 3.25e-03 | 1.35e-02 | 29 |
| GO:00512161 | Esophagus | ESCC | cartilage development | 103/8552 | 190/18723 | 1.08e-02 | 3.67e-02 | 103 |
| GO:00301983 | Oral cavity | OSCC | extracellular matrix organization | 146/7305 | 301/18723 | 4.67e-04 | 2.77e-03 | 146 |
| GO:00452293 | Oral cavity | OSCC | external encapsulating structure organization | 147/7305 | 304/18723 | 5.30e-04 | 3.08e-03 | 147 |
| GO:00430623 | Oral cavity | OSCC | extracellular structure organization | 146/7305 | 302/18723 | 5.59e-04 | 3.23e-03 | 146 |
| GO:000181910 | Oral cavity | OSCC | positive regulation of cytokine production | 213/7305 | 467/18723 | 1.93e-03 | 8.96e-03 | 213 |
| GO:00716045 | Oral cavity | OSCC | transforming growth factor beta production | 26/7305 | 43/18723 | 3.55e-03 | 1.49e-02 | 26 |
| GO:00716346 | Oral cavity | OSCC | regulation of transforming growth factor beta production | 25/7305 | 41/18723 | 3.60e-03 | 1.51e-02 | 25 |
| Page: 1 2 3 4 |
| Pathway ID | Tissue | Disease Stage | Description | Gene Ratio | Bg Ratio | pvalue | p.adjust | qvalue | Count |
| hsa0520518 | Endometrium | AEH | Proteoglycans in cancer | 53/1197 | 205/8465 | 5.43e-06 | 6.53e-05 | 4.78e-05 | 53 |
| hsa0520519 | Endometrium | AEH | Proteoglycans in cancer | 53/1197 | 205/8465 | 5.43e-06 | 6.53e-05 | 4.78e-05 | 53 |
| hsa0520524 | Endometrium | EEC | Proteoglycans in cancer | 52/1237 | 205/8465 | 3.01e-05 | 3.19e-04 | 2.38e-04 | 52 |
| hsa0520534 | Endometrium | EEC | Proteoglycans in cancer | 52/1237 | 205/8465 | 3.01e-05 | 3.19e-04 | 2.38e-04 | 52 |
| hsa0520529 | Esophagus | ESCC | Proteoglycans in cancer | 138/4205 | 205/8465 | 1.79e-07 | 1.40e-06 | 7.15e-07 | 138 |
| hsa0520537 | Esophagus | ESCC | Proteoglycans in cancer | 138/4205 | 205/8465 | 1.79e-07 | 1.40e-06 | 7.15e-07 | 138 |
| hsa0520526 | Oral cavity | OSCC | Proteoglycans in cancer | 128/3704 | 205/8465 | 4.00e-08 | 3.12e-07 | 1.59e-07 | 128 |
| hsa05205111 | Oral cavity | OSCC | Proteoglycans in cancer | 128/3704 | 205/8465 | 4.00e-08 | 3.12e-07 | 1.59e-07 | 128 |
| hsa0520527 | Oral cavity | LP | Proteoglycans in cancer | 77/2418 | 205/8465 | 3.01e-03 | 1.29e-02 | 8.35e-03 | 77 |
| hsa0520536 | Oral cavity | LP | Proteoglycans in cancer | 77/2418 | 205/8465 | 3.01e-03 | 1.29e-02 | 8.35e-03 | 77 |
| hsa0520543 | Oral cavity | EOLP | Proteoglycans in cancer | 53/1218 | 205/8465 | 9.07e-06 | 5.33e-05 | 3.14e-05 | 53 |
| hsa0520553 | Oral cavity | EOLP | Proteoglycans in cancer | 53/1218 | 205/8465 | 9.07e-06 | 5.33e-05 | 3.14e-05 | 53 |
| hsa0520562 | Oral cavity | NEOLP | Proteoglycans in cancer | 56/1112 | 205/8465 | 3.49e-08 | 5.85e-07 | 3.68e-07 | 56 |
| hsa0520572 | Oral cavity | NEOLP | Proteoglycans in cancer | 56/1112 | 205/8465 | 3.49e-08 | 5.85e-07 | 3.68e-07 | 56 |
| Page: 1 |
Top |
Cell-cell communication analysis |
| Identification of potential cell-cell interactions between two cell types and their ligand-receptor pairs for different disease states |
| Ligand | Receptor | LRpair | Pathway | Tissue | Disease Stage |
| Page: 1 |
Top |
Single-cell gene regulatory network inference analysis |
| Find out the significant the regulons (TFs) and the target genes of each regulon across cell types for different disease states |
| TF | Cell Type | Tissue | Disease Stage | Target Gene | RSS | Regulon Activity |
| ∗The dot plots of a searched regulon are shown for all cell subpopulations in each disease state of each tissue based on the regulon specific score inferred using pySCENIC and by calculating the average expression. |
| Page: 1 |
Top |
Somatic mutation of malignant transformation related genes |
| Annotation of somatic variants for genes involved in malignant transformation |
| Hugo Symbol | Variant Class | Variant Classification | dbSNP RS | HGVSc | HGVSp | HGVSp Short | SWISSPROT | BIOTYPE | SIFT | PolyPhen | Tumor Sample Barcode | Tissue | Histology | Sex | Age | Stage | Therapy Types | Drugs | Outcome |
| LUM | SNV | Missense_Mutation | c.704N>A | p.Arg235His | p.R235H | P51884 | protein_coding | deleterious(0.04) | probably_damaging(0.999) | TCGA-BH-A18R-01 | Breast | breast invasive carcinoma | Female | <65 | I/II | Unknown | Unknown | SD | |
| LUM | SNV | Missense_Mutation | rs267603717 | c.718G>A | p.Glu240Lys | p.E240K | P51884 | protein_coding | tolerated(1) | benign(0.003) | TCGA-D8-A1XZ-01 | Breast | breast invasive carcinoma | Female | >=65 | III/IV | Hormone Therapy | tamoxiphen+anastrozolum | SD |
| LUM | SNV | Missense_Mutation | c.397G>C | p.Gly133Arg | p.G133R | P51884 | protein_coding | tolerated(0.37) | benign(0.258) | TCGA-EW-A1OX-01 | Breast | breast invasive carcinoma | Female | <65 | I/II | Chemotherapy | taxotere | SD | |
| LUM | SNV | Missense_Mutation | c.118N>A | p.Glu40Lys | p.E40K | P51884 | protein_coding | deleterious(0.03) | probably_damaging(0.949) | TCGA-LP-A5U2-01 | Cervix | cervical & endocervical cancer | Female | <65 | III/IV | Unknown | Unknown | SD | |
| LUM | SNV | Missense_Mutation | novel | c.952N>A | p.Glu318Lys | p.E318K | P51884 | protein_coding | tolerated(0.16) | benign(0) | TCGA-VS-A9UD-01 | Cervix | cervical & endocervical cancer | Female | >=65 | III/IV | Chemotherapy | cisplatin | CR |
| LUM | deletion | Frame_Shift_Del | novel | c.324delA | p.Arg110GlufsTer6 | p.R110Efs*6 | P51884 | protein_coding | TCGA-EK-A2RK-01 | Cervix | cervical & endocervical cancer | Female | >=65 | I/II | Unknown | Unknown | SD | ||
| LUM | SNV | Missense_Mutation | rs267603717 | c.718N>A | p.Glu240Lys | p.E240K | P51884 | protein_coding | tolerated(1) | benign(0.003) | TCGA-AA-3510-01 | Colorectum | colon adenocarcinoma | Male | >=65 | I/II | Unknown | Unknown | SD |
| LUM | SNV | Missense_Mutation | novel | c.784T>C | p.Ser262Pro | p.S262P | P51884 | protein_coding | deleterious(0) | probably_damaging(1) | TCGA-AA-3845-01 | Colorectum | colon adenocarcinoma | Female | >=65 | I/II | Unknown | Unknown | PD |
| LUM | SNV | Missense_Mutation | c.989N>A | p.Arg330His | p.R330H | P51884 | protein_coding | deleterious(0) | probably_damaging(0.998) | TCGA-AA-A01R-01 | Colorectum | colon adenocarcinoma | Male | <65 | III/IV | Chemotherapy | 5-fluorouracil | PD | |
| LUM | SNV | Missense_Mutation | c.511N>A | p.Leu171Met | p.L171M | P51884 | protein_coding | deleterious(0) | probably_damaging(0.997) | TCGA-AA-A022-01 | Colorectum | colon adenocarcinoma | Female | >=65 | I/II | Unknown | Unknown | SD |
| Page: 1 2 3 4 5 6 7 8 9 |
Top |
Related drugs of malignant transformation related genes |
| Identification of chemicals and drugs interact with genes involved in malignant transfromation |
| (DGIdb 4.0) |
| Entrez ID | Symbol | Category | Interaction Types | Drug Claim Name | Drug Name | PMIDs |
| 4060 | LUM | DRUGGABLE GENOME | FAS LIGAND | 15051477 |
| Page: 1 |

Copyright 2023-Present -The University of Texas Health Science Center at Houston |