Schematic overview of the cellular and molecular mechanisms involved in the cancer progression, including the proposed cellular and molecular mechanisms in cancer cells trajectory. AT1: alveolar type 1 cells; AT2: alveolar type 2 cells; AAH: atypical adenomatous hyperplasia; AIS: adenocarcinoma in situ; MIA: minimally invasive adenocarcinoma; IA: invasive adenocarcinoma; EMT: epithelial-mesenchymal transition

Home

Download

Statistics

Help

Contact

Center for Computational Systems Medicine
leaf

Gene summary

leaf

Malignant transformation analysis

leaf

Malignant transformation related pathway analysis

leaf

Cell-cell communication analysis

leaf

Single-cell gene regulatory network inference analysis

leaf

Somatic mutation of malignant transformation related genes

leaf

Related drugs of malignant transformation related genes

Gene: LTN1

Gene summary for LTN1

check button Gene summary.

Gene informationSpeciesHuman
Gene symbol

LTN1

Gene ID

26046

Gene namelisterin E3 ubiquitin protein ligase 1
Gene AliasC21orf10
Cytomap21q21.3
Gene Typeprotein-coding
GO ID

GO:0006412

UniProtAcc

O94822


Top

Malignant transformation analysis

check button Identification of the aberrant gene expression in precancerous and cancerous lesions by comparing the gene expression of stem-like cells in diseased tissues with normal stem cells
check button Malignant transformation involving gene list.
Entrez IDSymbolReplicatesSpeciesOrganTissueAdj P-valueLog2FCMalignancy
26046LTN1HTA11_3410_2000001011HumanColorectumAD1.40e-19-4.87e-010.0155
26046LTN1HTA11_2487_2000001011HumanColorectumSER3.00e-07-4.35e-01-0.1808
26046LTN1HTA11_2951_2000001011HumanColorectumAD9.40e-03-5.04e-010.0216
26046LTN1HTA11_1938_2000001011HumanColorectumAD1.45e-03-4.02e-01-0.0811
26046LTN1HTA11_78_2000001011HumanColorectumAD4.01e-02-2.77e-01-0.1088
26046LTN1HTA11_347_2000001011HumanColorectumAD3.65e-03-2.30e-01-0.1954
26046LTN1HTA11_3361_2000001011HumanColorectumAD5.39e-07-4.66e-01-0.1207
26046LTN1HTA11_83_2000001011HumanColorectumSER3.66e-04-4.43e-01-0.1526
26046LTN1HTA11_696_2000001011HumanColorectumAD4.82e-08-3.90e-01-0.1464
26046LTN1HTA11_866_2000001011HumanColorectumAD8.96e-07-3.90e-01-0.1001
26046LTN1HTA11_1391_2000001011HumanColorectumAD6.22e-08-4.00e-01-0.059
26046LTN1HTA11_546_2000001011HumanColorectumAD4.85e-03-4.34e-01-0.0842
26046LTN1HTA11_866_3004761011HumanColorectumAD2.35e-14-4.65e-010.096
26046LTN1HTA11_4255_2000001011HumanColorectumSER9.40e-03-5.04e-010.0446
26046LTN1HTA11_10711_2000001011HumanColorectumAD3.26e-05-4.10e-010.0338
26046LTN1HTA11_7696_3000711011HumanColorectumAD1.72e-08-4.36e-010.0674
26046LTN1HTA11_6818_2000001011HumanColorectumAD8.36e-04-4.83e-010.0112
26046LTN1HTA11_6818_2000001021HumanColorectumAD5.45e-08-4.90e-010.0588
26046LTN1HTA11_99999970781_79442HumanColorectumMSS3.17e-08-3.86e-010.294
26046LTN1HTA11_99999971662_82457HumanColorectumMSS5.95e-04-3.45e-010.3859
Page: 1 2 3 4 5 6 7 

check button Transcriptomic changes along malignancy continuum.
TissueExpression DynamicsAbbreviation
Colorectum (GSE201348)The image shows the transcriptomic changes along malignancy continuum.log2FC in expression of this searched gene in stem-like cells from each diseased tissue sample relative to stem-like cells in normal samples in each tissue plotted against the malignancy continuum. Samples are colored based on if they are from different disease stage.FAP: Familial adenomatous polyposis
CRC: Colorectal cancer
Colorectum (HTA11)The image shows the transcriptomic changes along malignancy continuum.log2FC in expression of this searched gene in stem-like cells from each diseased tissue sample relative to stem-like cells in normal samples in each tissue plotted against the malignancy continuum. Samples are colored based on if they are from different disease stage.AD: Adenomas
SER: Sessile serrated lesions
MSI-H: Microsatellite-high colorectal cancer
MSS: Microsatellite stable colorectal cancer
EsophagusThe image shows the transcriptomic changes along malignancy continuum.log2FC in expression of this searched gene in stem-like cells from each diseased tissue sample relative to stem-like cells in normal samples in each tissue plotted against the malignancy continuum. Samples are colored based on if they are from different disease stage.
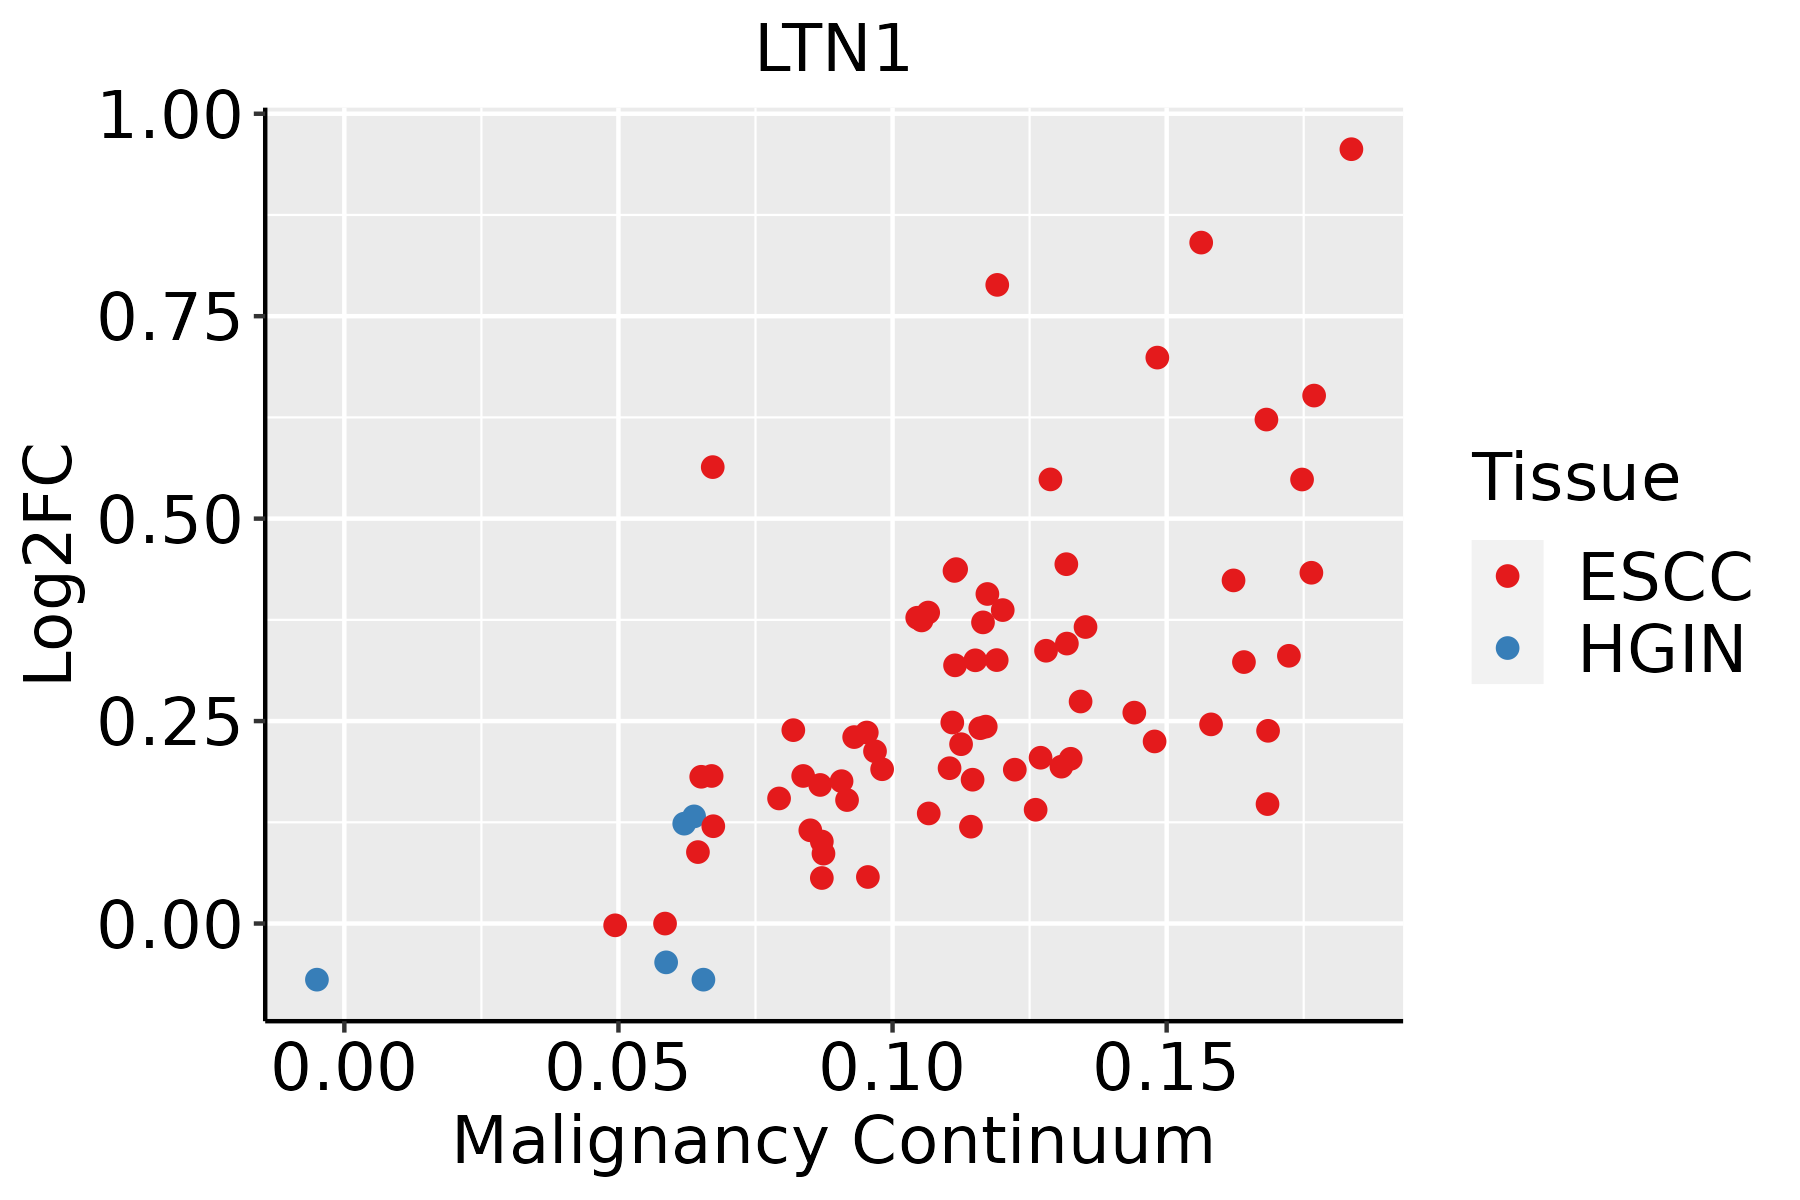
ESCC: Esophageal squamous cell carcinoma
HGIN: High-grade intraepithelial neoplasias
LGIN: Low-grade intraepithelial neoplasias
LiverThe image shows the transcriptomic changes along malignancy continuum.log2FC in expression of this searched gene in stem-like cells from each diseased tissue sample relative to stem-like cells in normal samples in each tissue plotted against the malignancy continuum. Samples are colored based on if they are from different disease stage.
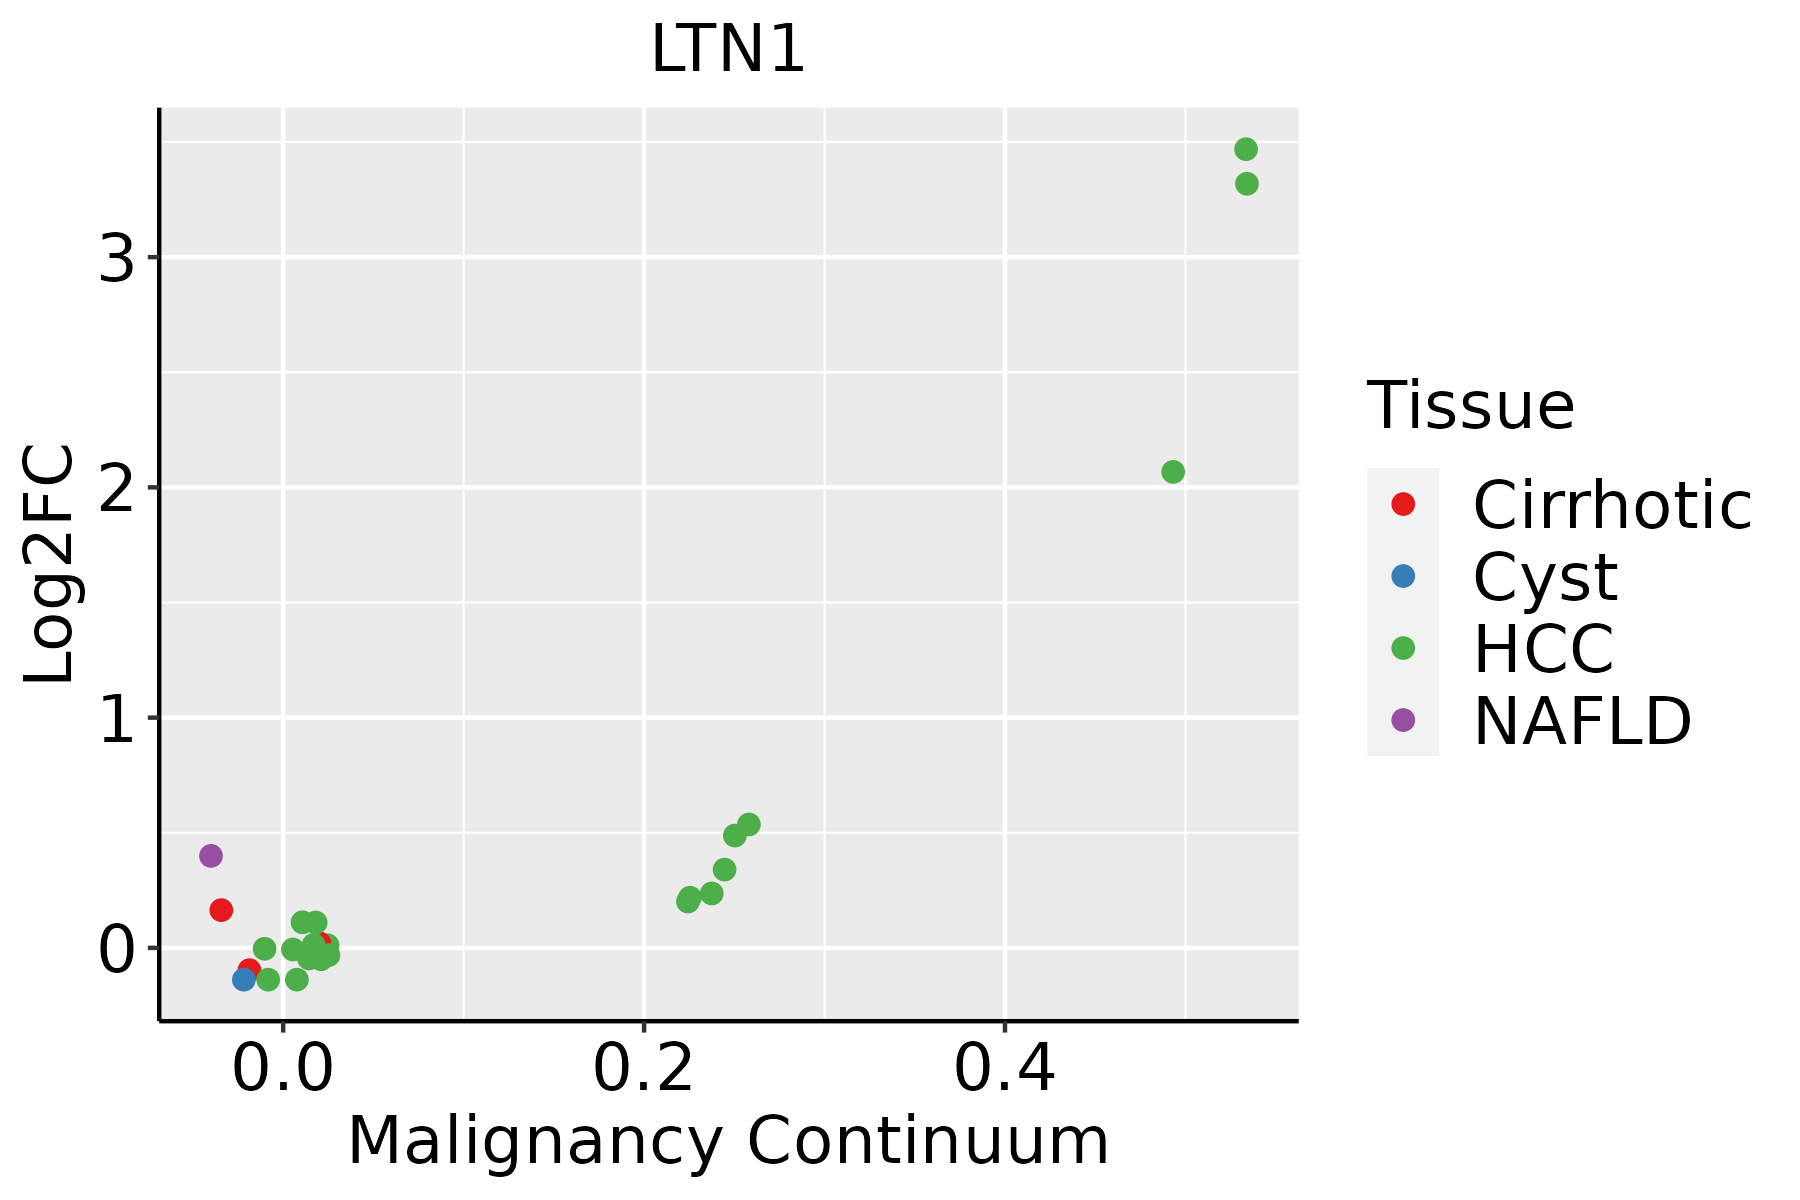
HCC: Hepatocellular carcinoma
NAFLD: Non-alcoholic fatty liver disease
Oral CavityThe image shows the transcriptomic changes along malignancy continuum.log2FC in expression of this searched gene in stem-like cells from each diseased tissue sample relative to stem-like cells in normal samples in each tissue plotted against the malignancy continuum. Samples are colored based on if they are from different disease stage.
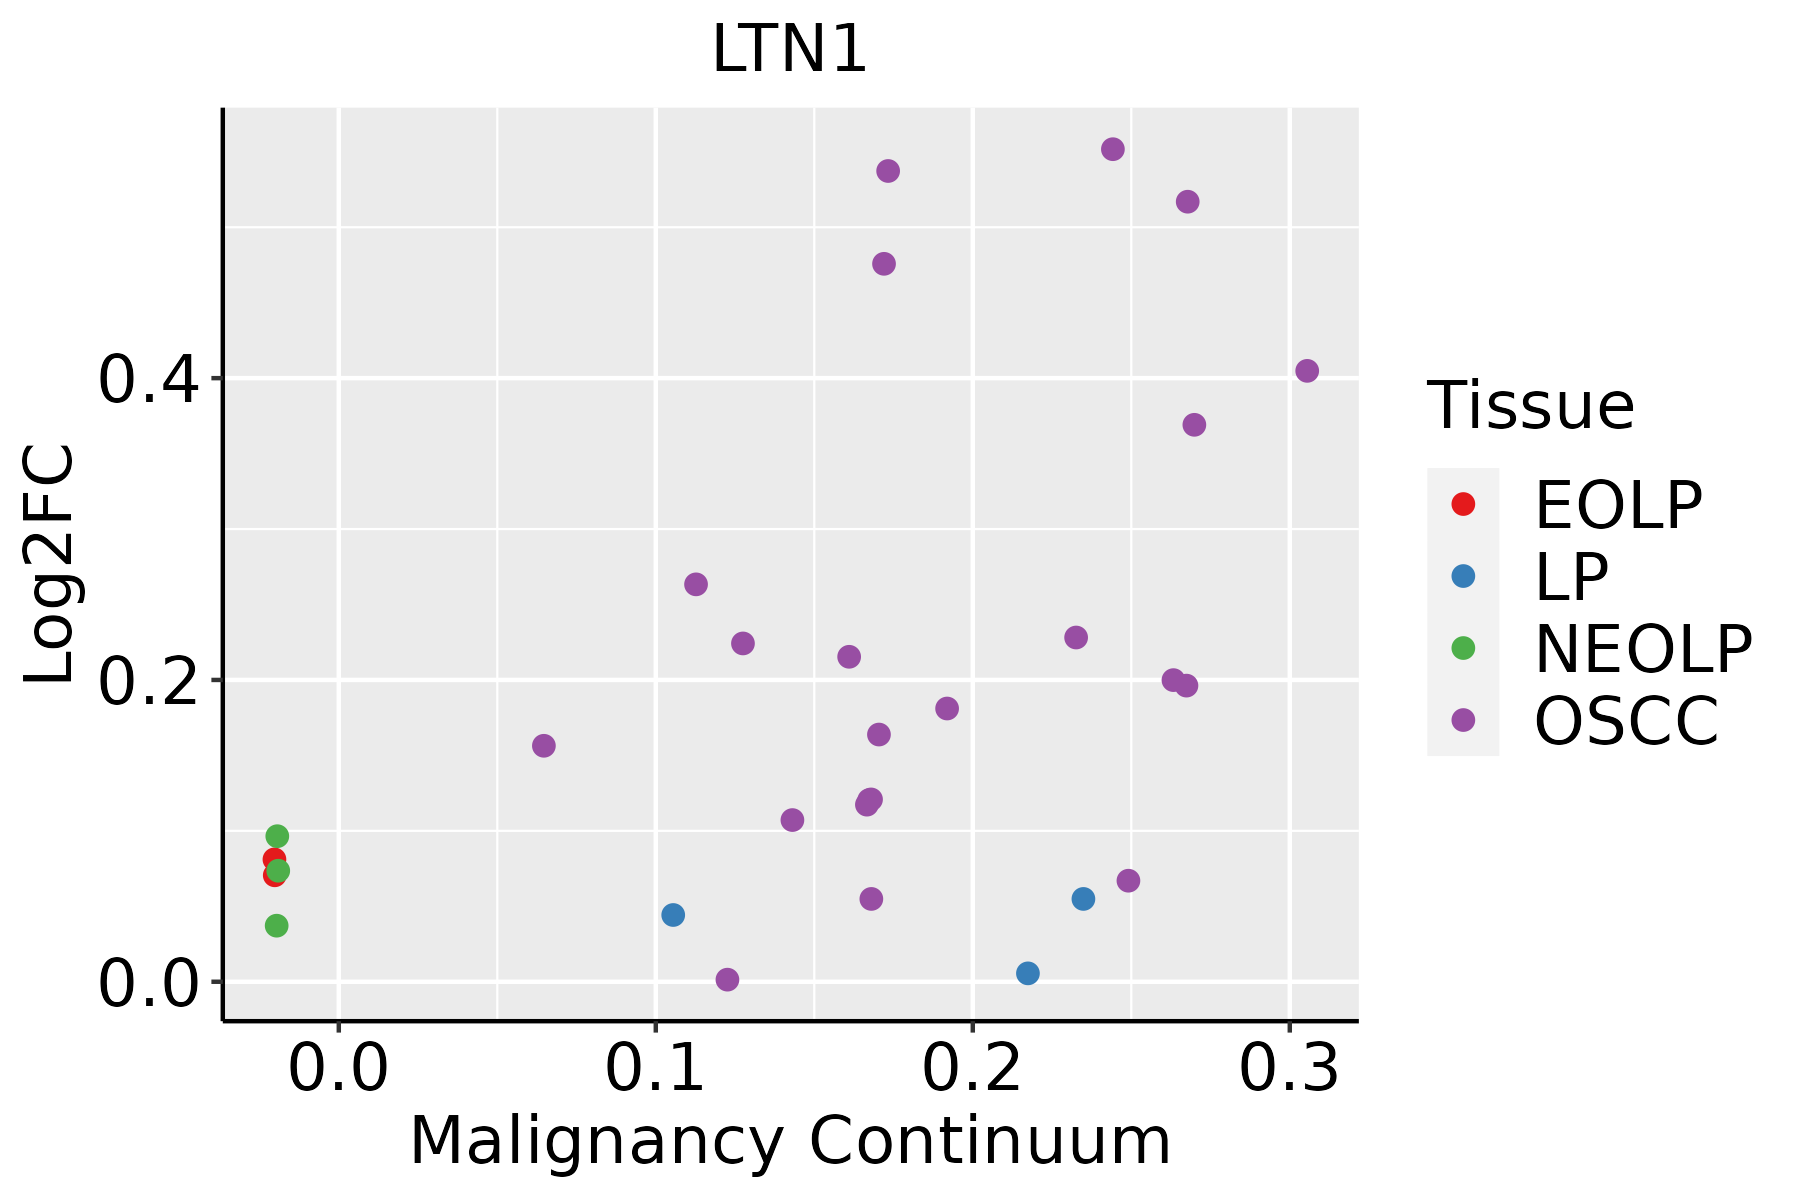
EOLP: Erosive Oral lichen planus
LP: leukoplakia
NEOLP: Non-erosive oral lichen planus
OSCC: Oral squamous cell carcinoma
ProstateThe image shows the transcriptomic changes along malignancy continuum.log2FC in expression of this searched gene in stem-like cells from each diseased tissue sample relative to stem-like cells in normal samples in each tissue plotted against the malignancy continuum. Samples are colored based on if they are from different disease stage.BPH: Benign Prostatic Hyperplasia
SkinThe image shows the transcriptomic changes along malignancy continuum.log2FC in expression of this searched gene in stem-like cells from each diseased tissue sample relative to stem-like cells in normal samples in each tissue plotted against the malignancy continuum. Samples are colored based on if they are from different disease stage.AK: Actinic keratosis
cSCC: Cutaneous squamous cell carcinoma
SCCIS:squamous cell carcinoma in situ
ThyroidThe image shows the transcriptomic changes along malignancy continuum.log2FC in expression of this searched gene in stem-like cells from each diseased tissue sample relative to stem-like cells in normal samples in each tissue plotted against the malignancy continuum. Samples are colored based on if they are from different disease stage.
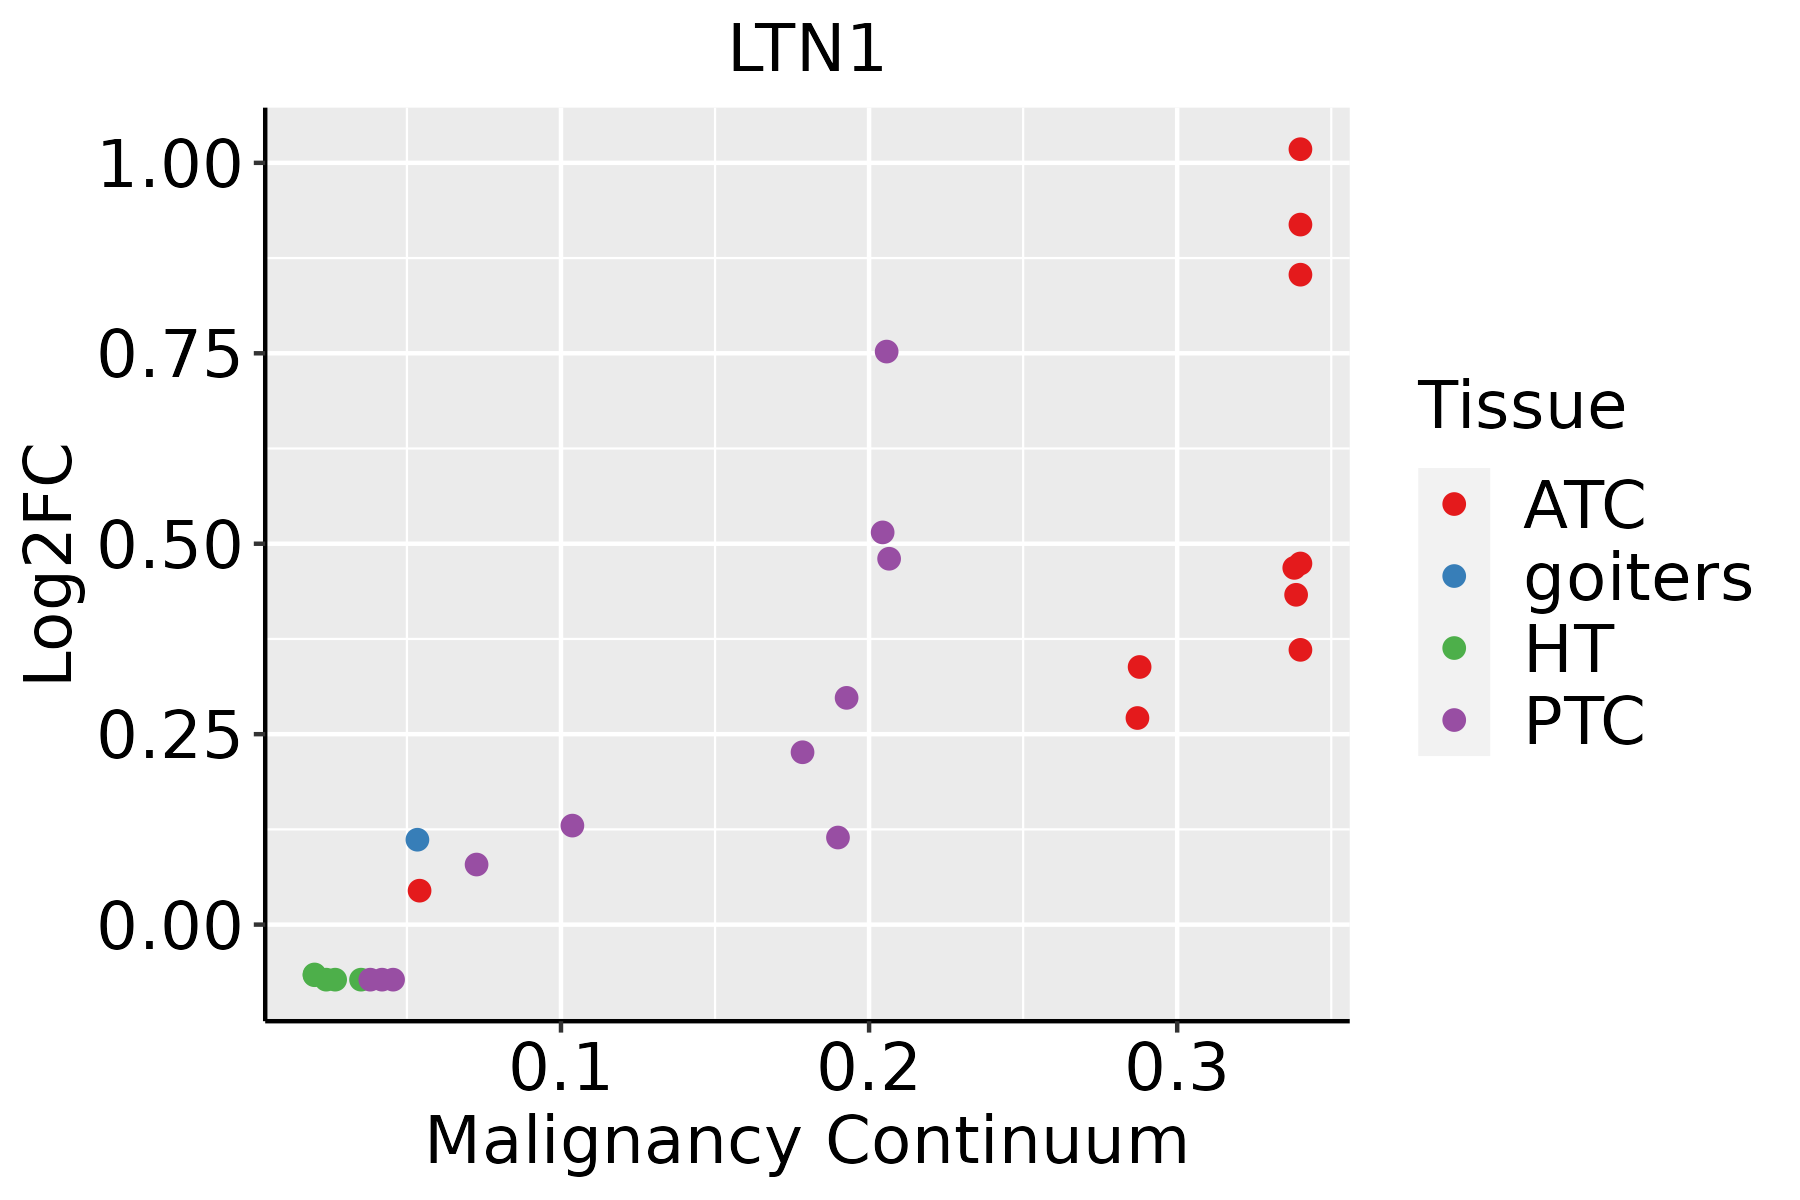
ATC: Anaplastic thyroid cancer
HT: Hashimoto's thyroiditis
PTC: Papillary thyroid cancer
∗log2FC in expression of this searched gene in stem-like cells from each diseased tissue sample relative to stem-like cells in normal samples in each tissue plotted against the malignancy continuum. Samples are colored based on if they are from different disease stage.

Top

Malignant transformation related pathway analysis

check buttonFind out the enriched GO biological processes and KEGG pathways involved in transition from healthy to precancer to cancer
check button Figure of enriched GO biological processes.
TissueDisease StageEnriched GO biological Processes
ColorectumADGO analysis - Figure of enriched GO biological processes: Top 15 enriched GO BP terms are showed in the bar plot of each disease state in each tissue. Each row represents a significant GO biological process which is colored according to the -log10(p.adjust).
ColorectumSERGO analysis - Figure of enriched GO biological processes: Top 15 enriched GO BP terms are showed in the bar plot of each disease state in each tissue. Each row represents a significant GO biological process which is colored according to the -log10(p.adjust).
ColorectumMSSGO analysis - Figure of enriched GO biological processes: Top 15 enriched GO BP terms are showed in the bar plot of each disease state in each tissue. Each row represents a significant GO biological process which is colored according to the -log10(p.adjust).
ColorectumMSI-HGO analysis - Figure of enriched GO biological processes: Top 15 enriched GO BP terms are showed in the bar plot of each disease state in each tissue. Each row represents a significant GO biological process which is colored according to the -log10(p.adjust).
ColorectumFAPGO analysis - Figure of enriched GO biological processes: Top 15 enriched GO BP terms are showed in the bar plot of each disease state in each tissue. Each row represents a significant GO biological process which is colored according to the -log10(p.adjust).
∗Top 15 enriched GO BP terms are showed in the bar plot of each disease state in each tissue. Each row represents a significant GO biological process which is colored according to the -log10(p.adjust).
Page: 1 2 3 4 5 6 7 8 9 

check button Enriched GO biological processes.
GO IDTissueDisease StageDescriptionGene RatioBg Ratiopvaluep.adjustCount
GO:0010498ColorectumADproteasomal protein catabolic process174/3918490/187233.18e-147.66e-12174
GO:0043161ColorectumADproteasome-mediated ubiquitin-dependent protein catabolic process141/3918412/187231.77e-101.68e-08141
GO:0006417ColorectumADregulation of translation141/3918468/187231.32e-064.22e-05141
GO:0051865ColorectumADprotein autoubiquitination28/391873/187234.87e-045.30e-0328
GO:0006414ColorectumADtranslational elongation21/391855/187232.53e-031.93e-0221
GO:00104981ColorectumSERproteasomal protein catabolic process132/2897490/187233.08e-115.55e-09132
GO:00431611ColorectumSERproteasome-mediated ubiquitin-dependent protein catabolic process105/2897412/187237.48e-084.70e-06105
GO:00064171ColorectumSERregulation of translation100/2897468/187233.76e-045.74e-03100
GO:00064141ColorectumSERtranslational elongation17/289755/187233.00e-032.65e-0217
GO:00104982ColorectumMSSproteasomal protein catabolic process157/3467490/187232.39e-135.25e-11157
GO:00431612ColorectumMSSproteasome-mediated ubiquitin-dependent protein catabolic process127/3467412/187237.70e-106.32e-08127
GO:00064172ColorectumMSSregulation of translation134/3467468/187234.43e-082.38e-06134
GO:00518651ColorectumMSSprotein autoubiquitination25/346773/187231.00e-031.00e-0225
GO:00064142ColorectumMSStranslational elongation19/346755/187233.47e-032.59e-0219
GO:00064174ColorectumFAPregulation of translation111/2622468/187238.47e-091.13e-06111
GO:00431614ColorectumFAPproteasome-mediated ubiquitin-dependent protein catabolic process98/2622412/187235.41e-084.20e-0698
GO:00104984ColorectumFAPproteasomal protein catabolic process110/2622490/187232.12e-071.26e-05110
GO:00518652ColorectumFAPprotein autoubiquitination22/262273/187232.88e-043.77e-0322
GO:00064175ColorectumCRCregulation of translation82/2078468/187231.79e-055.40e-0482
GO:00431615ColorectumCRCproteasome-mediated ubiquitin-dependent protein catabolic process69/2078412/187233.16e-044.90e-0369
Page: 1 2 3 4 

check button Enriched KEGG pathways.
Pathway IDTissueDisease StageDescriptionGene RatioBg Ratiopvaluep.adjustqvalueCount
Page: 1 

Top

Cell-cell communication analysis

check buttonIdentification of potential cell-cell interactions between two cell types and their ligand-receptor pairs for different disease states
LigandReceptorLRpairPathwayTissueDisease Stage
Page: 1 

Top

Single-cell gene regulatory network inference analysis

check buttonFind out the significant the regulons (TFs) and the target genes of each regulon across cell types for different disease states
TFCell TypeTissueDisease StageTarget GeneRSSRegulon Activity
∗The dot plots of a searched regulon are shown for all cell subpopulations in each disease state of each tissue based on the regulon specific score inferred using pySCENIC and by calculating the average expression.
Page: 1 

Top

Somatic mutation of malignant transformation related genes

check buttonAnnotation of somatic variants for genes involved in malignant transformation
Hugo SymbolVariant ClassVariant ClassificationdbSNP RSHGVScHGVSpHGVSp ShortSWISSPROTBIOTYPESIFTPolyPhenTumor Sample BarcodeTissueHistologySexAgeStageTherapy TypesDrugsOutcome
LTN1SNVMissense_Mutationrs763137490c.117G>Cp.Gln39Hisp.Q39HO94822protein_codingtolerated_low_confidence(0.07)benign(0.116)TCGA-A2-A0CR-01Breastbreast invasive carcinomaFemale<65I/IIChemotherapyadriamycinCR
LTN1SNVMissense_Mutationc.3979N>Ap.Ala1327Thrp.A1327TO94822protein_codingtolerated(0.24)benign(0.005)TCGA-A2-A0ET-01Breastbreast invasive carcinomaFemale<65III/IVChemotherapycytoxanSD
LTN1SNVMissense_Mutationrs147845371c.4718C>Tp.Ala1573Valp.A1573VO94822protein_codingtolerated(0.09)benign(0.038)TCGA-AC-A23H-01Breastbreast invasive carcinomaFemale>=65I/IIUnknownUnknownPD
LTN1SNVMissense_Mutationc.2825N>Gp.Leu942Argp.L942RO94822protein_codingdeleterious(0)probably_damaging(1)TCGA-B6-A0RS-01Breastbreast invasive carcinomaFemale<65I/IIUnknownUnknownPD
LTN1SNVMissense_Mutationc.1472T>Gp.Val491Glyp.V491GO94822protein_codingdeleterious(0.01)possibly_damaging(0.543)TCGA-D8-A1XK-01Breastbreast invasive carcinomaFemale<65I/IIChemotherapydoxorubicine+cyclophosphamideSD
LTN1SNVMissense_Mutationc.2724N>Gp.His908Glnp.H908QO94822protein_codingtolerated(0.07)possibly_damaging(0.586)TCGA-D8-A1XW-01Breastbreast invasive carcinomaFemale<65I/IIChemotherapyadriamycin+cyclophosphamideSD
LTN1SNVMissense_Mutationc.514C>Gp.Gln172Glup.Q172EO94822protein_codingdeleterious(0)probably_damaging(0.992)TCGA-E2-A1LH-01Breastbreast invasive carcinomaFemale<65I/IIChemotherapyadriamycinSD
LTN1insertionIn_Frame_Insnovelc.4849_4850insACAGTTTAGTAGGACCAGATTCTTGTCCTGp.Thr1617delinsAsnSerLeuValGlyProAspSerCysProAlap.T1617delinsNSLVGPDSCPAO94822protein_codingTCGA-AO-A03P-01Breastbreast invasive carcinomaFemale<65I/IIHormone TherapyletrozolePD
LTN1insertionIn_Frame_Insnovelc.4667_4668insATGTATp.Asn1556delinsLysCysIlep.N1556delinsKCIO94822protein_codingTCGA-AR-A0TU-01Breastbreast invasive carcinomaFemale<65I/IIUnspecificDoxorubicinSD
LTN1insertionNonsense_Mutationnovelc.5017_5018insGACTATAACACTTTAAGTATTGGTCCAGAAGAp.Lys1673ArgfsTer3p.K1673Rfs*3O94822protein_codingTCGA-B6-A0IA-01Breastbreast invasive carcinomaFemale<65I/IIUnknownUnknownSD
Page: 1 2 3 4 5 6 7 8 9 10 11 12 13 14 15 16 17 18 19 

Top

Related drugs of malignant transformation related genes

check buttonIdentification of chemicals and drugs interact with genes involved in malignant transfromation
(DGIdb 4.0)
Entrez IDSymbolCategoryInteraction TypesDrug Claim NameDrug NamePMIDs
Page: 1