
|
|||||
|
 | |
| |
| |
| |
| |
| |
|
Gene: LTF |
Gene summary for LTF |
| Gene information | Species | Human | Gene symbol | LTF | Gene ID | 4057 |
| Gene name | lactotransferrin | |
| Gene Alias | GIG12 | |
| Cytomap | 3p21.31 | |
| Gene Type | protein-coding | GO ID | GO:0000041 | UniProtAcc | P02788 |
Top |
Malignant transformation analysis |
| Identification of the aberrant gene expression in precancerous and cancerous lesions by comparing the gene expression of stem-like cells in diseased tissues with normal stem cells |
| Entrez ID | Symbol | Replicates | Species | Organ | Tissue | Adj P-value | Log2FC | Malignancy |
| 4057 | LTF | GSM4909281 | Human | Breast | IDC | 5.56e-33 | -1.03e+00 | 0.21 |
| 4057 | LTF | GSM4909282 | Human | Breast | IDC | 7.90e-28 | -1.02e+00 | -0.0288 |
| 4057 | LTF | GSM4909285 | Human | Breast | IDC | 2.90e-36 | -1.03e+00 | 0.21 |
| 4057 | LTF | GSM4909286 | Human | Breast | IDC | 1.04e-39 | -1.06e+00 | 0.1081 |
| 4057 | LTF | GSM4909290 | Human | Breast | IDC | 5.79e-18 | -9.40e-01 | 0.2096 |
| 4057 | LTF | GSM4909291 | Human | Breast | IDC | 2.52e-25 | -1.06e+00 | 0.1753 |
| 4057 | LTF | GSM4909292 | Human | Breast | IDC | 4.67e-03 | -1.02e+00 | 0.1236 |
| 4057 | LTF | GSM4909293 | Human | Breast | IDC | 1.54e-19 | -8.64e-01 | 0.1581 |
| 4057 | LTF | GSM4909294 | Human | Breast | IDC | 1.28e-10 | -7.48e-01 | 0.2022 |
| 4057 | LTF | GSM4909295 | Human | Breast | IDC | 1.79e-02 | -5.38e-01 | 0.0898 |
| 4057 | LTF | GSM4909296 | Human | Breast | IDC | 1.05e-16 | -8.38e-01 | 0.1524 |
| 4057 | LTF | GSM4909297 | Human | Breast | IDC | 1.05e-21 | -8.89e-01 | 0.1517 |
| 4057 | LTF | GSM4909298 | Human | Breast | IDC | 1.27e-22 | -9.17e-01 | 0.1551 |
| 4057 | LTF | GSM4909299 | Human | Breast | IDC | 8.72e-03 | -3.57e-01 | 0.035 |
| 4057 | LTF | GSM4909300 | Human | Breast | IDC | 1.24e-10 | 7.27e-01 | 0.0334 |
| 4057 | LTF | GSM4909301 | Human | Breast | IDC | 2.02e-34 | -1.04e+00 | 0.1577 |
| 4057 | LTF | GSM4909302 | Human | Breast | IDC | 1.53e-18 | -8.54e-01 | 0.1545 |
| 4057 | LTF | GSM4909303 | Human | Breast | IDC | 3.43e-06 | -8.90e-01 | 0.0438 |
| 4057 | LTF | GSM4909304 | Human | Breast | IDC | 3.95e-37 | -1.05e+00 | 0.1636 |
| 4057 | LTF | GSM4909306 | Human | Breast | IDC | 8.26e-09 | -6.78e-01 | 0.1564 |
| Page: 1 2 3 4 5 6 7 8 9 |
| Tissue | Expression Dynamics | Abbreviation |
| Breast |  | IDC: Invasive ductal carcinoma |
| DCIS: Ductal carcinoma in situ | ||
| Precancer(BRCA1-mut): Precancerous lesion from BRCA1 mutation carriers | ||
| Cervix | 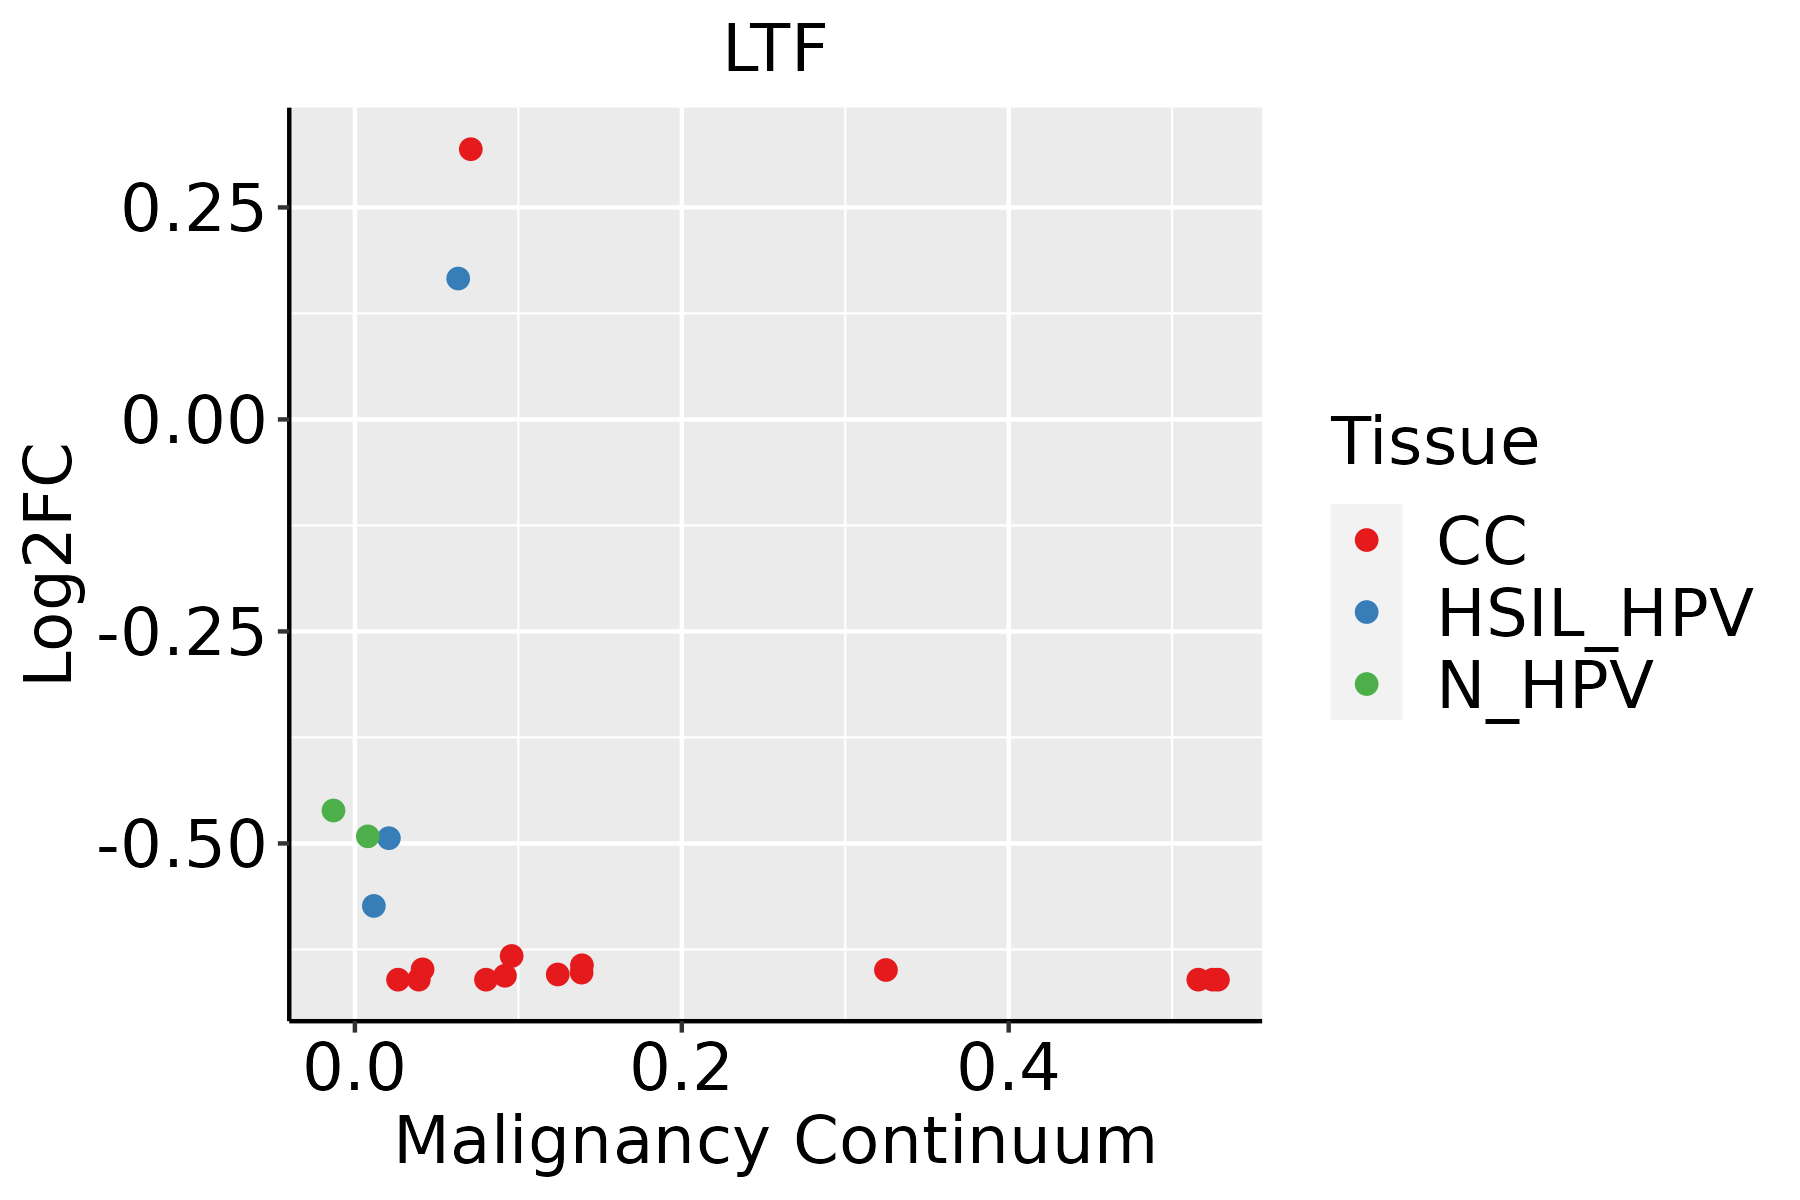 | CC: Cervix cancer |
| HSIL_HPV: HPV-infected high-grade squamous intraepithelial lesions | ||
| N_HPV: HPV-infected normal cervix | ||
| Esophagus | 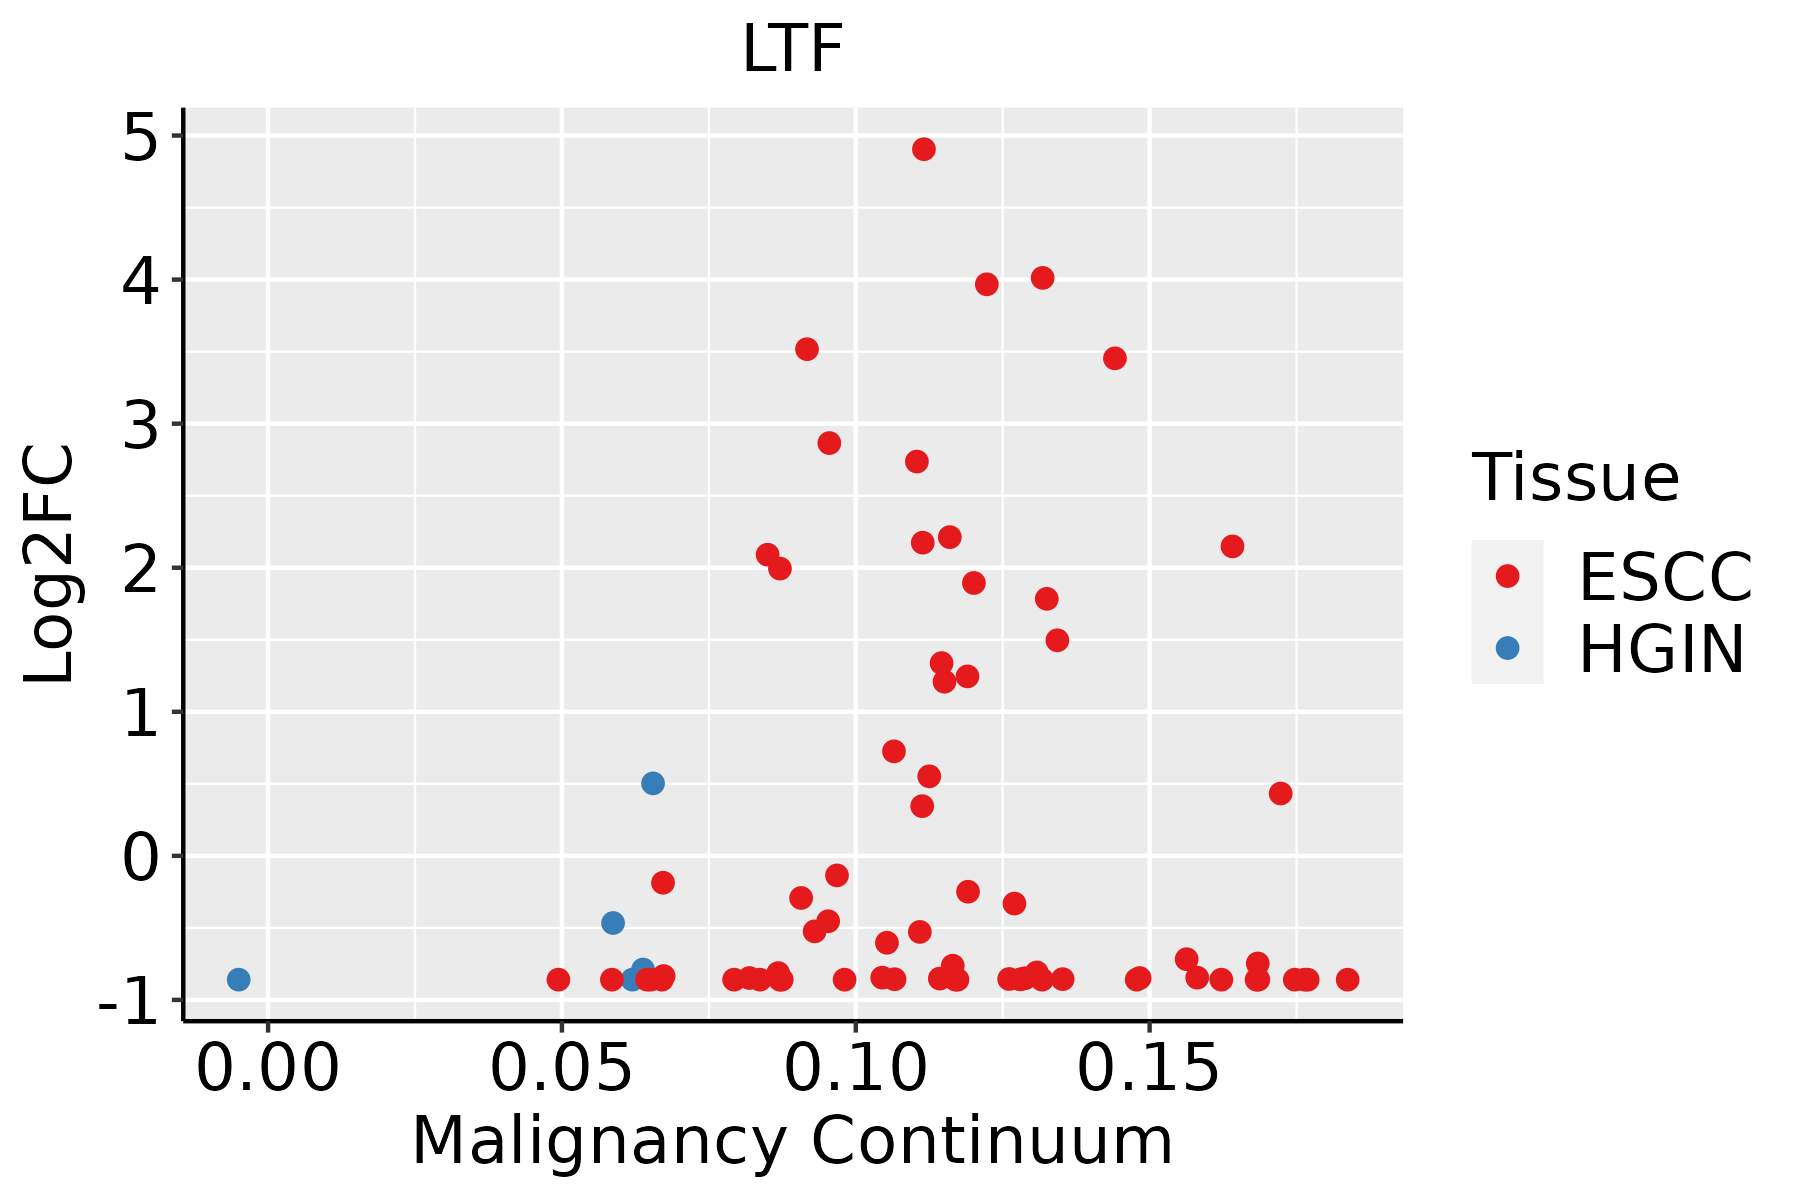 | ESCC: Esophageal squamous cell carcinoma |
| HGIN: High-grade intraepithelial neoplasias | ||
| LGIN: Low-grade intraepithelial neoplasias | ||
| GC |  | CAG: Chronic atrophic gastritis |
| CAG with IM: Chronic atrophic gastritis with intestinal metaplasia | ||
| CSG: Chronic superficial gastritis | ||
| GC: Gastric cancer | ||
| SIM: Severe intestinal metaplasia | ||
| WIM: Wild intestinal metaplasia | ||
| Oral Cavity |  | EOLP: Erosive Oral lichen planus |
| LP: leukoplakia | ||
| NEOLP: Non-erosive oral lichen planus | ||
| OSCC: Oral squamous cell carcinoma | ||
| Prostate | 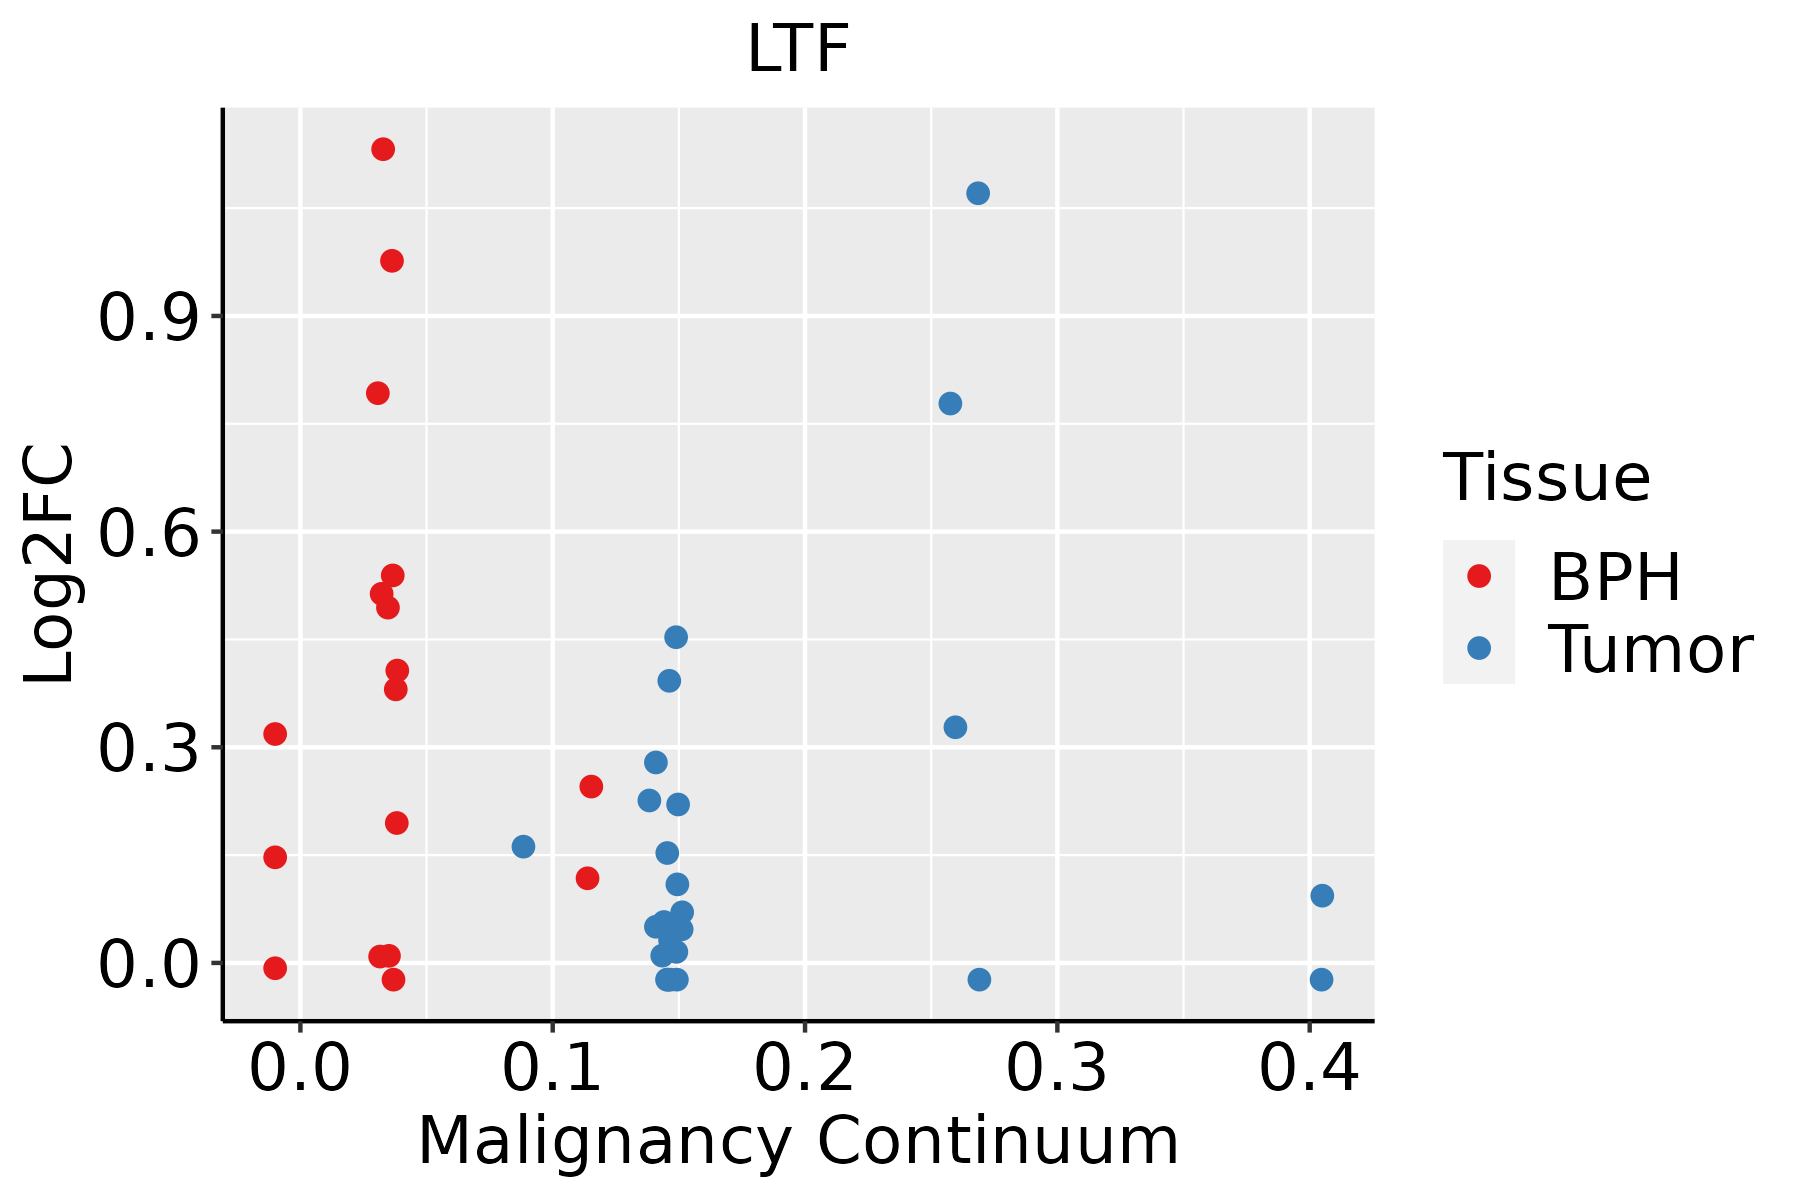 | BPH: Benign Prostatic Hyperplasia |
| Skin |  | AK: Actinic keratosis |
| cSCC: Cutaneous squamous cell carcinoma | ||
| SCCIS:squamous cell carcinoma in situ |
| ∗log2FC in expression of this searched gene in stem-like cells from each diseased tissue sample relative to stem-like cells in normal samples in each tissue plotted against the malignancy continuum. Samples are colored based on if they are from different disease stage. |
Top |
Malignant transformation related pathway analysis |
| Find out the enriched GO biological processes and KEGG pathways involved in transition from healthy to precancer to cancer |
| Tissue | Disease Stage | Enriched GO biological Processes |
| Colorectum | AD |  |
| Colorectum | SER |  |
| Colorectum | MSS |  |
| Colorectum | MSI-H |  |
| Colorectum | FAP |  |
| ∗Top 15 enriched GO BP terms are showed in the bar plot of each disease state in each tissue. Each row represents a significant GO biological process which is colored according to the -log10(p.adjust). |
| Page: 1 2 3 4 5 6 7 8 9 |
| GO ID | Tissue | Disease Stage | Description | Gene Ratio | Bg Ratio | pvalue | p.adjust | Count |
| GO:00525479 | Breast | Precancer | regulation of peptidase activity | 71/1080 | 461/18723 | 2.72e-14 | 6.94e-12 | 71 |
| GO:00525489 | Breast | Precancer | regulation of endopeptidase activity | 67/1080 | 432/18723 | 1.06e-13 | 2.36e-11 | 67 |
| GO:20001169 | Breast | Precancer | regulation of cysteine-type endopeptidase activity | 43/1080 | 235/18723 | 1.30e-11 | 1.83e-09 | 43 |
| GO:00160329 | Breast | Precancer | viral process | 58/1080 | 415/18723 | 3.42e-10 | 3.16e-08 | 58 |
| GO:00190589 | Breast | Precancer | viral life cycle | 47/1080 | 317/18723 | 2.42e-09 | 1.99e-07 | 47 |
| GO:00458619 | Breast | Precancer | negative regulation of proteolysis | 50/1080 | 351/18723 | 2.99e-09 | 2.39e-07 | 50 |
| GO:00444039 | Breast | Precancer | biological process involved in symbiotic interaction | 42/1080 | 290/18723 | 3.40e-08 | 2.11e-06 | 42 |
| GO:00513468 | Breast | Precancer | negative regulation of hydrolase activity | 50/1080 | 379/18723 | 3.85e-08 | 2.34e-06 | 50 |
| GO:00104668 | Breast | Precancer | negative regulation of peptidase activity | 38/1080 | 262/18723 | 1.46e-07 | 7.82e-06 | 38 |
| GO:00109519 | Breast | Precancer | negative regulation of endopeptidase activity | 37/1080 | 252/18723 | 1.55e-07 | 8.05e-06 | 37 |
| GO:20001179 | Breast | Precancer | negative regulation of cysteine-type endopeptidase activity | 19/1080 | 86/18723 | 3.36e-07 | 1.58e-05 | 19 |
| GO:00507929 | Breast | Precancer | regulation of viral process | 27/1080 | 164/18723 | 7.59e-07 | 3.05e-05 | 27 |
| GO:00300999 | Breast | Precancer | myeloid cell differentiation | 45/1080 | 381/18723 | 4.00e-06 | 1.25e-04 | 45 |
| GO:00190799 | Breast | Precancer | viral genome replication | 22/1080 | 131/18723 | 5.63e-06 | 1.66e-04 | 22 |
| GO:00022378 | Breast | Precancer | response to molecule of bacterial origin | 43/1080 | 363/18723 | 6.05e-06 | 1.72e-04 | 43 |
| GO:00324968 | Breast | Precancer | response to lipopolysaccharide | 41/1080 | 343/18723 | 7.94e-06 | 2.17e-04 | 41 |
| GO:00439039 | Breast | Precancer | regulation of biological process involved in symbiotic interaction | 15/1080 | 72/18723 | 1.23e-05 | 3.17e-04 | 15 |
| GO:19039009 | Breast | Precancer | regulation of viral life cycle | 23/1080 | 148/18723 | 1.31e-05 | 3.30e-04 | 23 |
| GO:00456379 | Breast | Precancer | regulation of myeloid cell differentiation | 28/1080 | 210/18723 | 3.05e-05 | 6.72e-04 | 28 |
| GO:19037069 | Breast | Precancer | regulation of hemopoiesis | 41/1080 | 367/18723 | 3.95e-05 | 8.52e-04 | 41 |
| Page: 1 2 3 4 5 6 7 8 9 10 11 12 13 14 15 16 17 18 19 20 21 22 23 24 25 26 27 28 29 30 31 32 33 34 35 36 37 38 39 40 41 42 43 44 45 46 47 48 49 |
| Pathway ID | Tissue | Disease Stage | Description | Gene Ratio | Bg Ratio | pvalue | p.adjust | qvalue | Count |
| Page: 1 |
Top |
Cell-cell communication analysis |
| Identification of potential cell-cell interactions between two cell types and their ligand-receptor pairs for different disease states |
| Ligand | Receptor | LRpair | Pathway | Tissue | Disease Stage |
| Page: 1 |
Top |
Single-cell gene regulatory network inference analysis |
| Find out the significant the regulons (TFs) and the target genes of each regulon across cell types for different disease states |
| TF | Cell Type | Tissue | Disease Stage | Target Gene | RSS | Regulon Activity |
| LTF | CD8TCM | Cervix | ADJ | LCN2,MUC5B,WFDC2, etc. | 7.56e-02 |  |
| LTF | M1MAC | Cervix | CC | LCN2,MUC5B,WFDC2, etc. | 4.60e-02 |  |
| LTF | CD8TRM | Cervix | HSIL_HPV | LCN2,MUC5B,WFDC2, etc. | 1.35e-01 |  |
| LTF | FIB | Cervix | ADJ | WFDC2,MUC1,LCN2, etc. | 1.05e-01 | |
| LTF | ICAF | Cervix | ADJ | WFDC2,MUC1,LCN2, etc. | 2.22e-01 | |
| LTF | STML | Cervix | CC | WFDC2,MUC1,LCN2, etc. | 2.79e-01 | |
| LTF | END | Cervix | Healthy | WFDC2,MUC1,LCN2, etc. | 1.38e-01 |  |
| LTF | STM | Endometrium | Healthy | MUC5B,C3,WFDC2, etc. | 1.78e-01 |  |
| LTF | URO | Prostate | ADJ | C3,CP,CFB, etc. | 2.98e-01 |  |
| LTF | URO | Prostate | Tumor | C3,CP,CFB, etc. | 1.34e-01 |  |
| ∗The dot plots of a searched regulon are shown for all cell subpopulations in each disease state of each tissue based on the regulon specific score inferred using pySCENIC and by calculating the average expression. |
| Page: 1 2 |
Top |
Somatic mutation of malignant transformation related genes |
| Annotation of somatic variants for genes involved in malignant transformation |
| Hugo Symbol | Variant Class | Variant Classification | dbSNP RS | HGVSc | HGVSp | HGVSp Short | SWISSPROT | BIOTYPE | SIFT | PolyPhen | Tumor Sample Barcode | Tissue | Histology | Sex | Age | Stage | Therapy Types | Drugs | Outcome |
| LTF | SNV | Missense_Mutation | novel | c.1299C>G | p.Asn433Lys | p.N433K | P02788 | protein_coding | tolerated(0.1) | probably_damaging(0.927) | TCGA-A2-A3Y0-01 | Breast | breast invasive carcinoma | Female | <65 | I/II | Chemotherapy | adriamycin | CR |
| LTF | SNV | Missense_Mutation | c.2090N>T | p.Ser697Leu | p.S697L | P02788 | protein_coding | tolerated(0.21) | benign(0.083) | TCGA-BH-A0HF-01 | Breast | breast invasive carcinoma | Female | >=65 | I/II | Hormone Therapy | arimidex | SD | |
| LTF | SNV | Missense_Mutation | c.513N>G | p.Phe171Leu | p.F171L | P02788 | protein_coding | deleterious(0.01) | benign(0.24) | TCGA-D8-A1JA-01 | Breast | breast invasive carcinoma | Female | <65 | III/IV | Chemotherapy | adriamycin | PD | |
| LTF | insertion | Frame_Shift_Ins | novel | c.1876_1877insTGAGAGAGCT | p.Glu626ValfsTer16 | p.E626Vfs*16 | P02788 | protein_coding | TCGA-A8-A09C-01 | Breast | breast invasive carcinoma | Female | >=65 | I/II | Unknown | Unknown | SD | ||
| LTF | SNV | Missense_Mutation | novel | c.676G>A | p.Ala226Thr | p.A226T | P02788 | protein_coding | deleterious(0) | probably_damaging(0.957) | TCGA-2W-A8YY-01 | Cervix | cervical & endocervical cancer | Female | <65 | I/II | Chemotherapy | cisplatin | CR |
| LTF | SNV | Missense_Mutation | c.286G>T | p.Val96Leu | p.V96L | P02788 | protein_coding | deleterious(0.03) | possibly_damaging(0.455) | TCGA-EA-A5ZF-01 | Cervix | cervical & endocervical cancer | Female | <65 | I/II | Unknown | Unknown | PD | |
| LTF | SNV | Missense_Mutation | c.1963N>C | p.Ser655Pro | p.S655P | P02788 | protein_coding | deleterious(0.02) | possibly_damaging(0.836) | TCGA-A6-6780-01 | Colorectum | colon adenocarcinoma | Male | >=65 | I/II | Unknown | Unknown | SD | |
| LTF | SNV | Missense_Mutation | rs776865450 | c.145N>T | p.Arg49Cys | p.R49C | P02788 | protein_coding | deleterious(0.04) | possibly_damaging(0.79) | TCGA-AA-3492-01 | Colorectum | colon adenocarcinoma | Female | >=65 | I/II | Unknown | Unknown | SD |
| LTF | SNV | Missense_Mutation | rs776865450 | c.145N>T | p.Arg49Cys | p.R49C | P02788 | protein_coding | deleterious(0.04) | possibly_damaging(0.79) | TCGA-AA-3977-01 | Colorectum | colon adenocarcinoma | Male | >=65 | I/II | Unknown | Unknown | SD |
| LTF | SNV | Missense_Mutation | rs765686239 | c.206N>T | p.Ala69Val | p.A69V | P02788 | protein_coding | tolerated(0.24) | benign(0.023) | TCGA-AA-A01P-01 | Colorectum | colon adenocarcinoma | Female | >=65 | III/IV | Unknown | Unknown | PD |
| Page: 1 2 3 4 5 6 7 8 9 10 |
Top |
Related drugs of malignant transformation related genes |
| Identification of chemicals and drugs interact with genes involved in malignant transfromation |
| (DGIdb 4.0) |
| Entrez ID | Symbol | Category | Interaction Types | Drug Claim Name | Drug Name | PMIDs |
| 4057 | LTF | CELL SURFACE, TRANSCRIPTION FACTOR, DRUGGABLE GENOME, PROTEASE | BACITRACIN | BACITRACIN | 12042436 | |
| 4057 | LTF | CELL SURFACE, TRANSCRIPTION FACTOR, DRUGGABLE GENOME, PROTEASE | HLF 1-11 | |||
| 4057 | LTF | CELL SURFACE, TRANSCRIPTION FACTOR, DRUGGABLE GENOME, PROTEASE | Talactoferrin | TALACTOFERRIN ALFA | ||
| 4057 | LTF | CELL SURFACE, TRANSCRIPTION FACTOR, DRUGGABLE GENOME, PROTEASE | RESERPINE | RESERPINE | 3608900 | |
| 4057 | LTF | CELL SURFACE, TRANSCRIPTION FACTOR, DRUGGABLE GENOME, PROTEASE | Parecoxib | PARECOXIB |
| Page: 1 |

Copyright 2023-Present -The University of Texas Health Science Center at Houston |