
|
|||||
|
 | |
| |
| |
| |
| |
| |
|
Gene: LTC4S |
Gene summary for LTC4S |
| Gene information | Species | Human | Gene symbol | LTC4S | Gene ID | 4056 |
| Gene name | leukotriene C4 synthase | |
| Gene Alias | LTC4S | |
| Cytomap | 5q35.3 | |
| Gene Type | protein-coding | GO ID | GO:0001676 | UniProtAcc | Q16873 |
Top |
Malignant transformation analysis |
| Identification of the aberrant gene expression in precancerous and cancerous lesions by comparing the gene expression of stem-like cells in diseased tissues with normal stem cells |
| Entrez ID | Symbol | Replicates | Species | Organ | Tissue | Adj P-value | Log2FC | Malignancy |
| 4056 | LTC4S | CA_HPV_1 | Human | Cervix | CC | 2.50e-26 | -8.33e-01 | 0.0264 |
| 4056 | LTC4S | CA_HPV_3 | Human | Cervix | CC | 1.99e-05 | -3.49e-01 | 0.0414 |
| 4056 | LTC4S | N_HPV_2 | Human | Cervix | N_HPV | 5.88e-10 | -6.23e-01 | -0.0131 |
| 4056 | LTC4S | CCI_1 | Human | Cervix | CC | 3.11e-09 | -1.01e+00 | 0.528 |
| 4056 | LTC4S | CCI_2 | Human | Cervix | CC | 1.96e-08 | -1.01e+00 | 0.5249 |
| 4056 | LTC4S | CCI_3 | Human | Cervix | CC | 1.90e-12 | -1.01e+00 | 0.516 |
| 4056 | LTC4S | CCII_1 | Human | Cervix | CC | 2.31e-17 | -1.01e+00 | 0.3249 |
| 4056 | LTC4S | Tumor | Human | Cervix | CC | 4.20e-37 | -1.00e+00 | 0.1241 |
| 4056 | LTC4S | sample1 | Human | Cervix | CC | 1.01e-11 | -9.86e-01 | 0.0959 |
| 4056 | LTC4S | sample3 | Human | Cervix | CC | 7.77e-37 | -9.73e-01 | 0.1387 |
| 4056 | LTC4S | H2 | Human | Cervix | HSIL_HPV | 3.78e-27 | -9.09e-01 | 0.0632 |
| 4056 | LTC4S | L1 | Human | Cervix | CC | 1.93e-15 | -9.91e-01 | 0.0802 |
| 4056 | LTC4S | T1 | Human | Cervix | CC | 1.16e-23 | -9.66e-01 | 0.0918 |
| 4056 | LTC4S | T2 | Human | Cervix | CC | 8.54e-04 | -7.86e-01 | 0.0709 |
| 4056 | LTC4S | T3 | Human | Cervix | CC | 8.76e-32 | -9.66e-01 | 0.1389 |
| 4056 | LTC4S | C08 | Human | Oral cavity | OSCC | 1.90e-02 | 1.09e-01 | 0.1919 |
| 4056 | LTC4S | C09 | Human | Oral cavity | OSCC | 6.81e-06 | 3.09e-01 | 0.1431 |
| 4056 | LTC4S | EOLP-1 | Human | Oral cavity | EOLP | 9.69e-09 | 5.65e-01 | -0.0202 |
| 4056 | LTC4S | EOLP-2 | Human | Oral cavity | EOLP | 2.17e-30 | 1.12e+00 | -0.0203 |
| 4056 | LTC4S | SYSMH1 | Human | Oral cavity | OSCC | 2.86e-05 | 7.05e-02 | 0.1127 |
| Page: 1 2 |
| Tissue | Expression Dynamics | Abbreviation |
| Cervix | 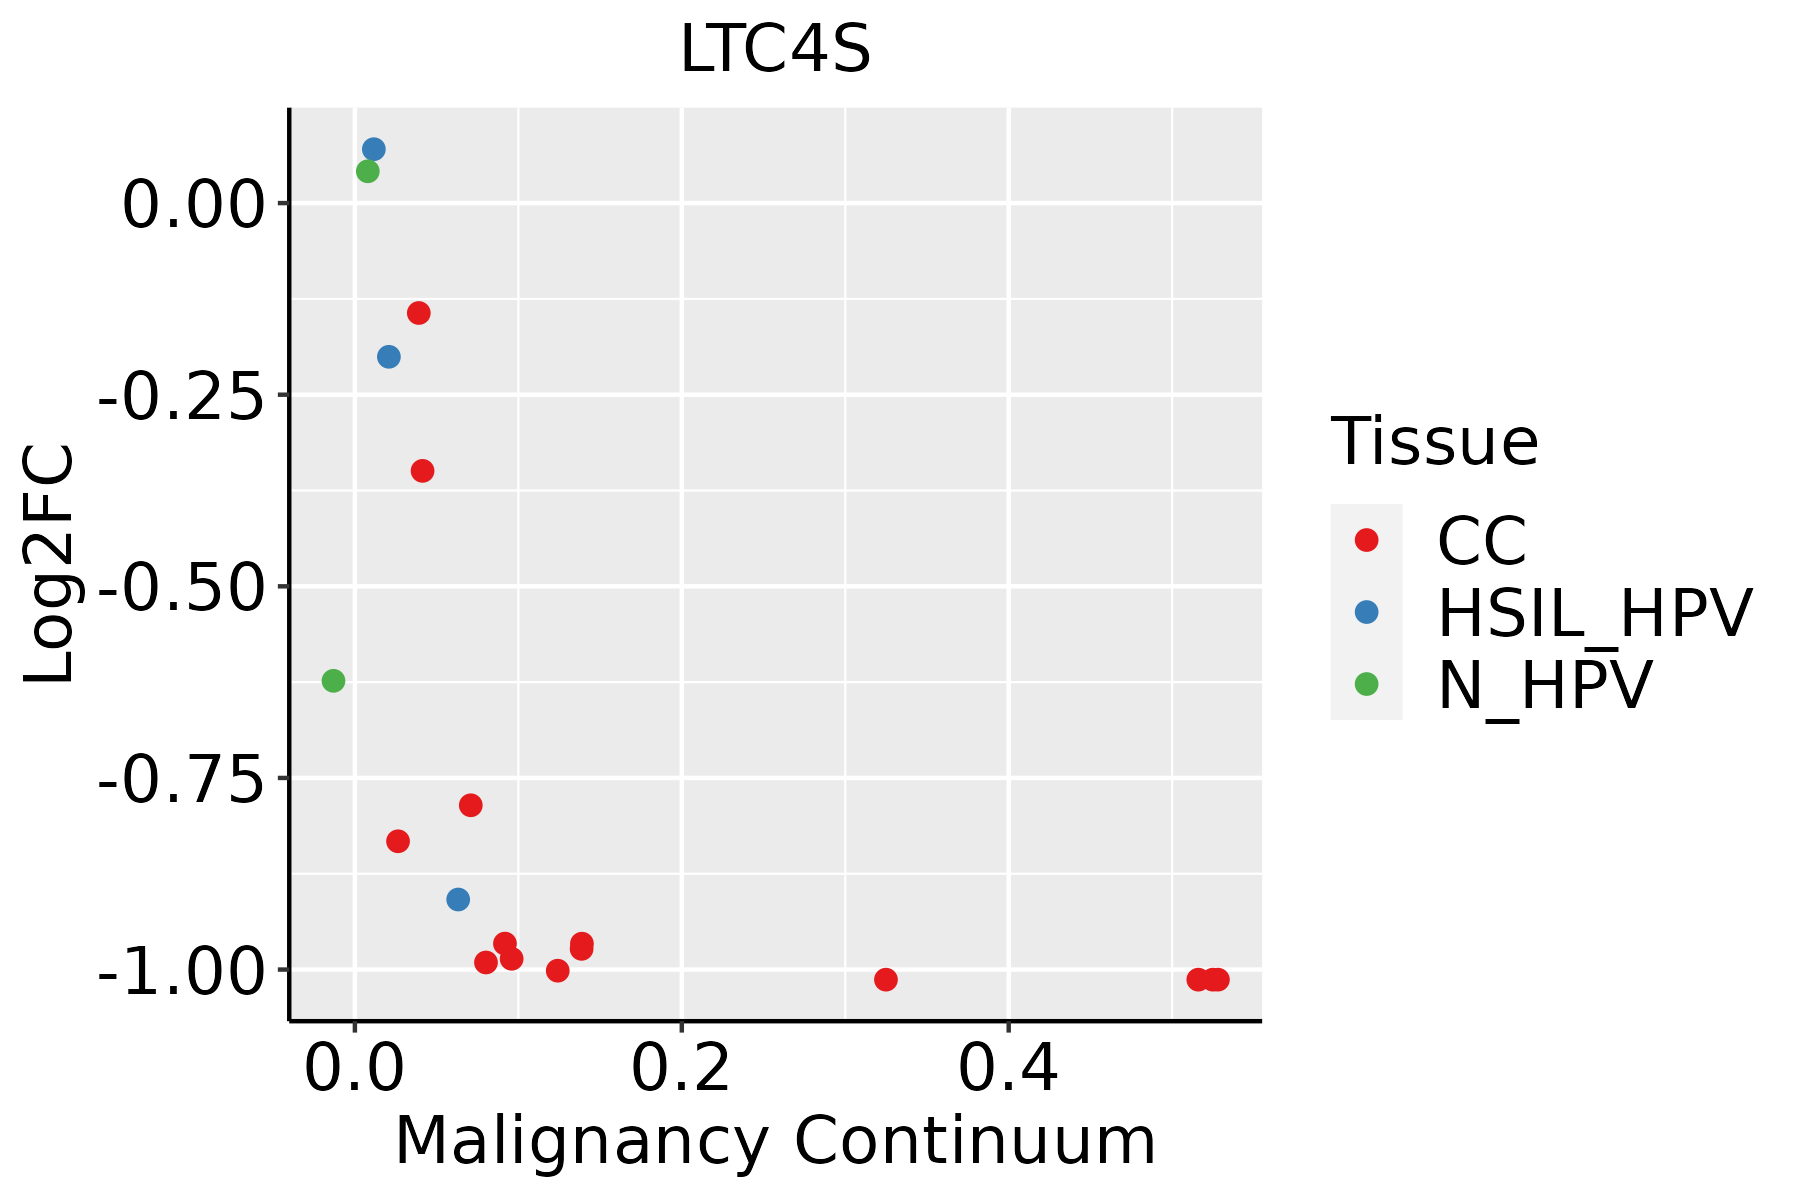 | CC: Cervix cancer |
| HSIL_HPV: HPV-infected high-grade squamous intraepithelial lesions | ||
| N_HPV: HPV-infected normal cervix | ||
| Oral Cavity | 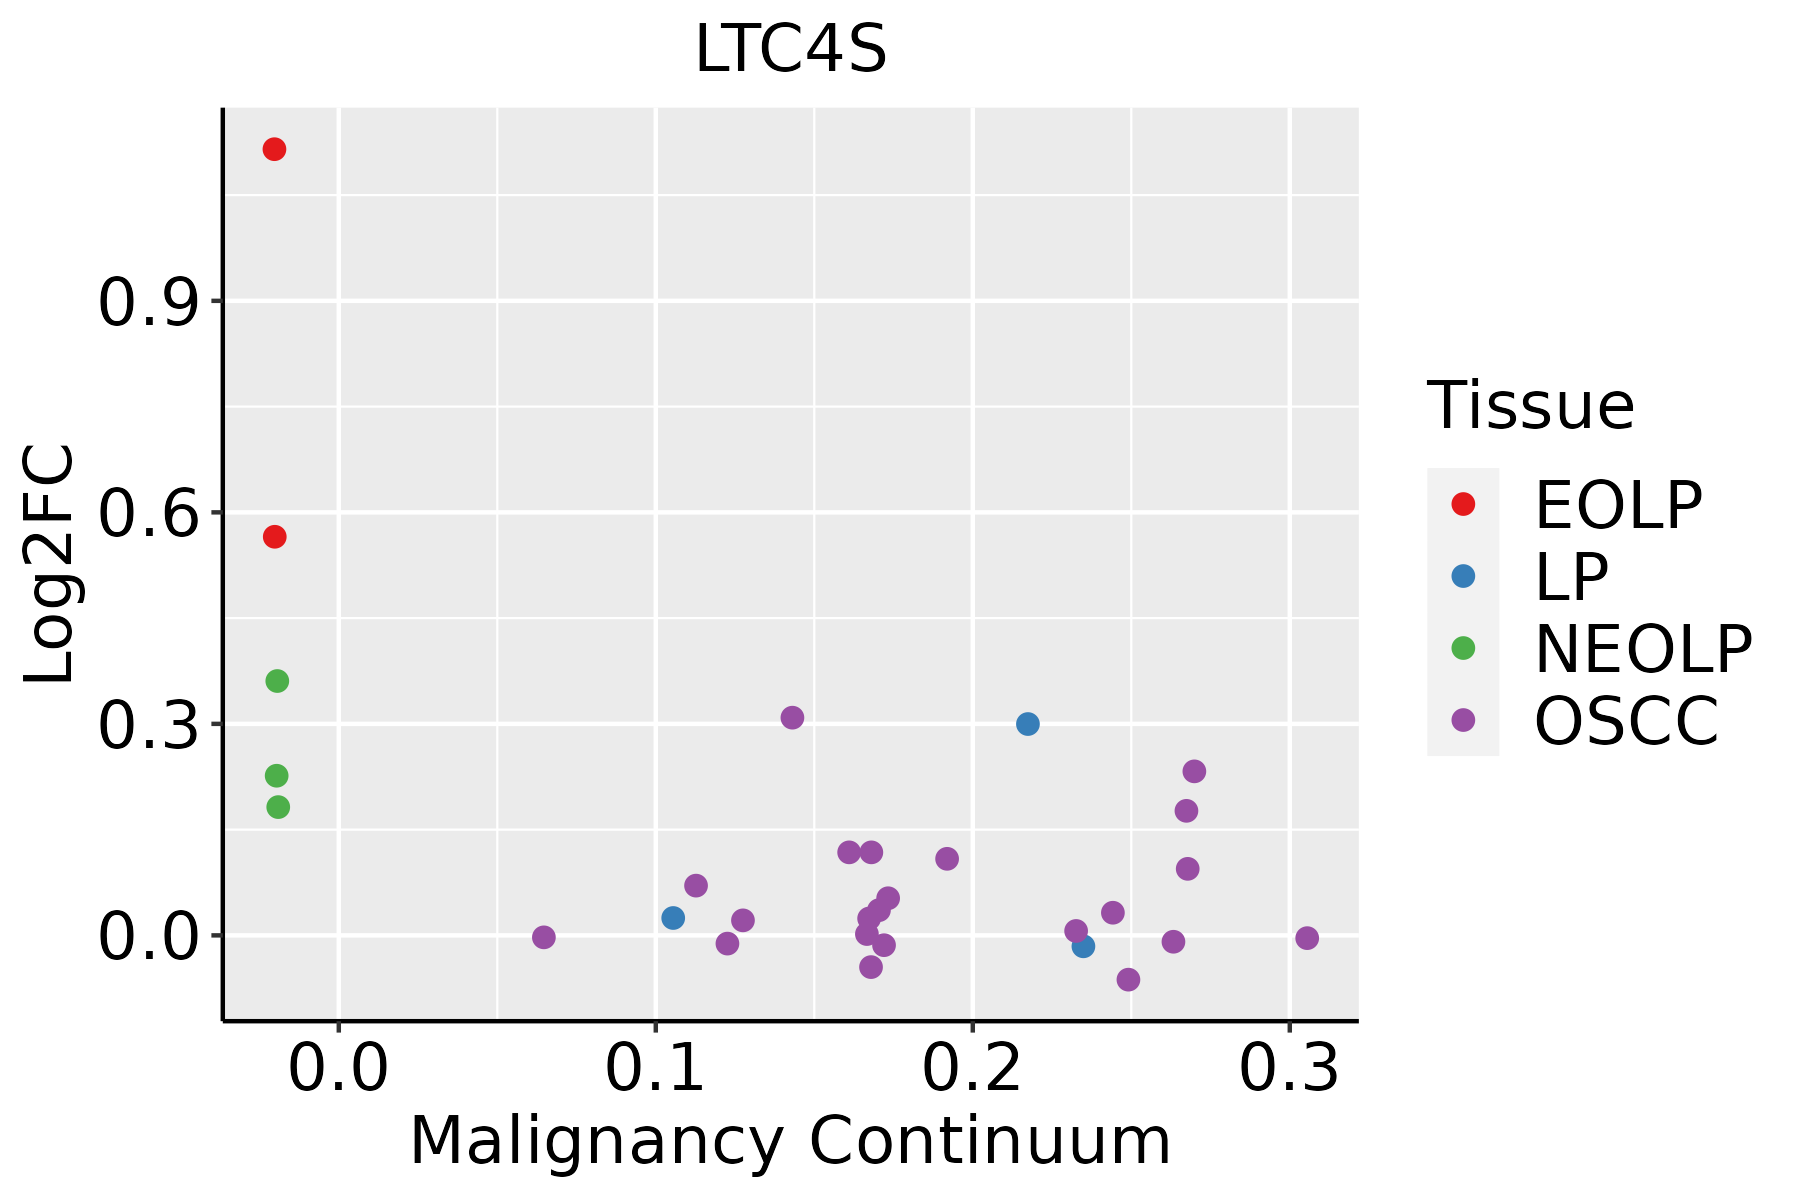 | EOLP: Erosive Oral lichen planus |
| LP: leukoplakia | ||
| NEOLP: Non-erosive oral lichen planus | ||
| OSCC: Oral squamous cell carcinoma | ||
| Thyroid | 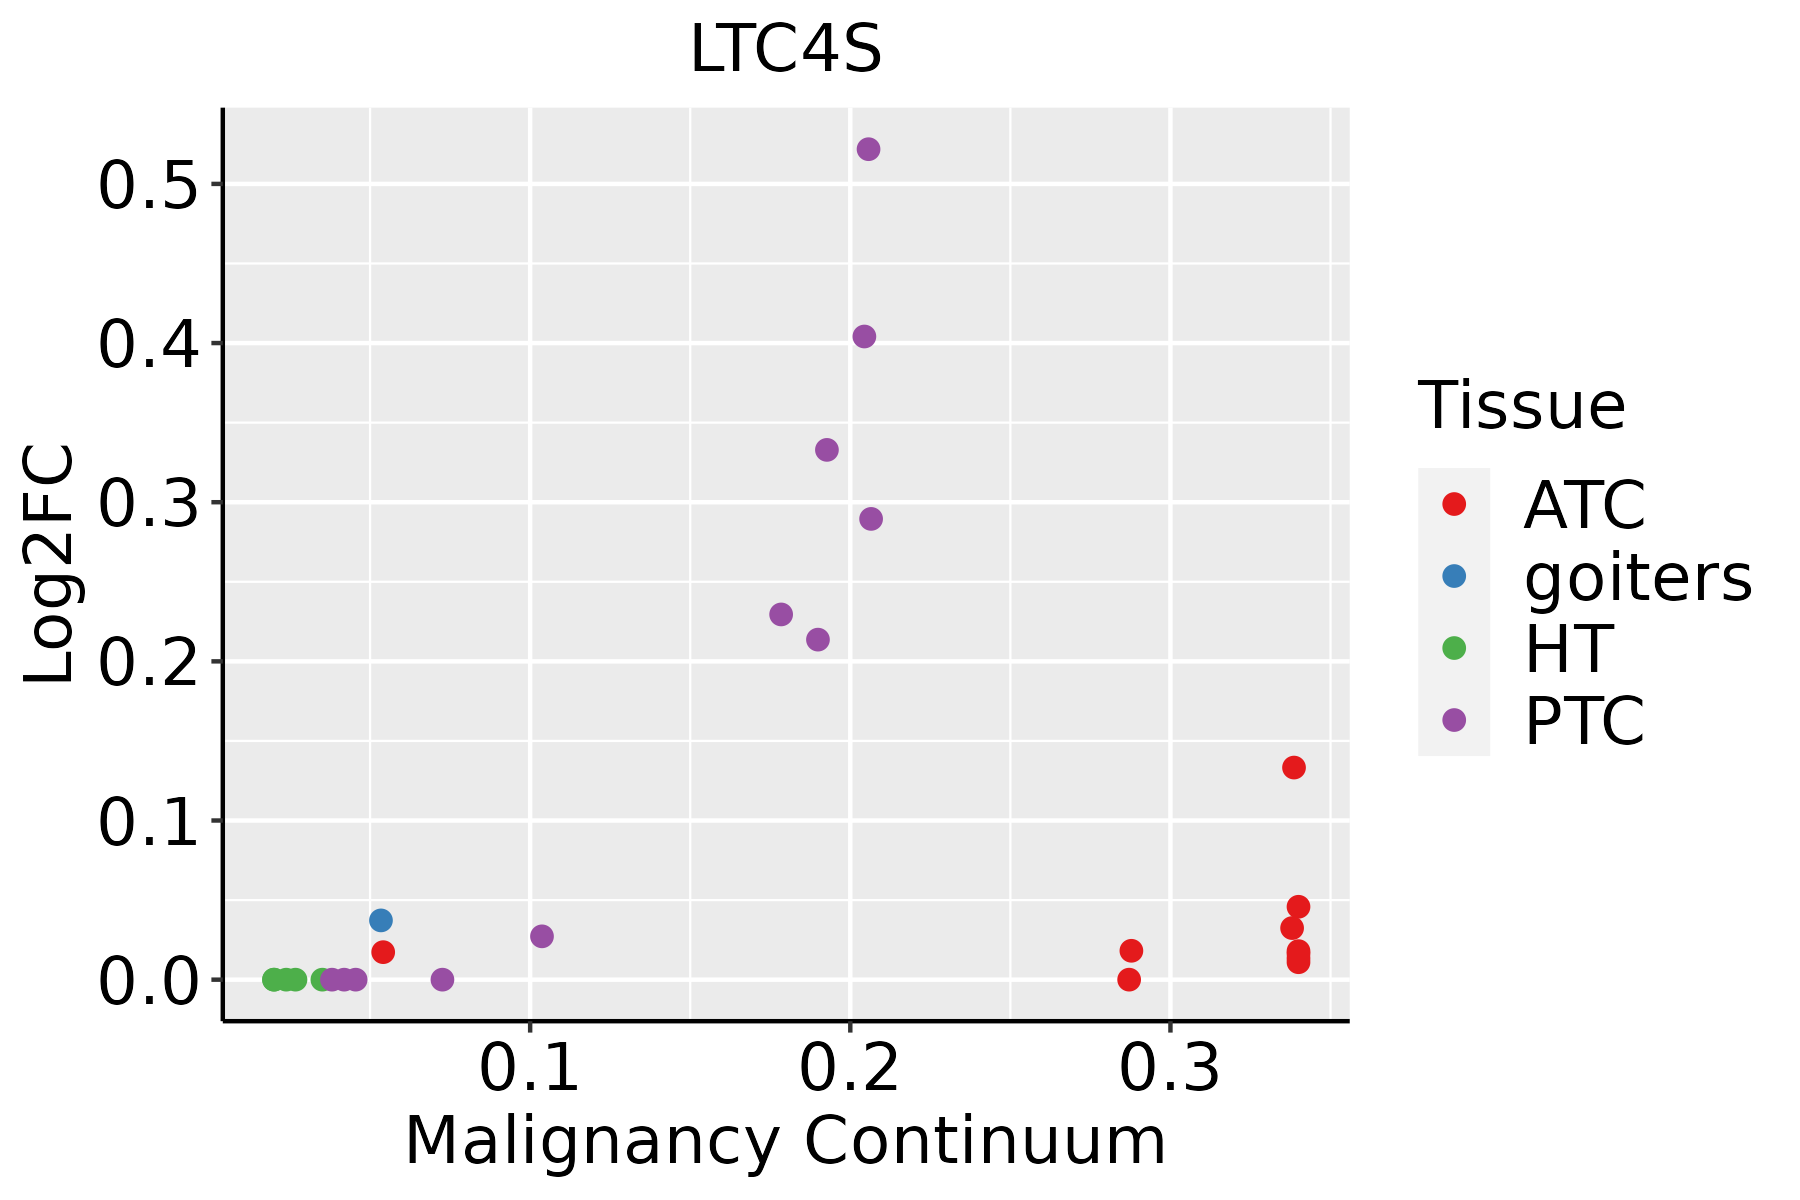 | ATC: Anaplastic thyroid cancer |
| HT: Hashimoto's thyroiditis | ||
| PTC: Papillary thyroid cancer |
| ∗log2FC in expression of this searched gene in stem-like cells from each diseased tissue sample relative to stem-like cells in normal samples in each tissue plotted against the malignancy continuum. Samples are colored based on if they are from different disease stage. |
Top |
Malignant transformation related pathway analysis |
| Find out the enriched GO biological processes and KEGG pathways involved in transition from healthy to precancer to cancer |
| Tissue | Disease Stage | Enriched GO biological Processes |
| Colorectum | AD |  |
| Colorectum | SER |  |
| Colorectum | MSS |  |
| Colorectum | MSI-H |  |
| Colorectum | FAP |  |
| ∗Top 15 enriched GO BP terms are showed in the bar plot of each disease state in each tissue. Each row represents a significant GO biological process which is colored according to the -log10(p.adjust). |
| Page: 1 2 3 4 5 6 7 8 9 |
| GO ID | Tissue | Disease Stage | Description | Gene Ratio | Bg Ratio | pvalue | p.adjust | Count |
| GO:00988699 | Cervix | CC | cellular oxidant detoxification | 30/2311 | 101/18723 | 2.72e-06 | 7.93e-05 | 30 |
| GO:19907489 | Cervix | CC | cellular detoxification | 30/2311 | 116/18723 | 5.34e-05 | 7.94e-04 | 30 |
| GO:00972379 | Cervix | CC | cellular response to toxic substance | 31/2311 | 124/18723 | 8.09e-05 | 1.10e-03 | 31 |
| GO:00096369 | Cervix | CC | response to toxic substance | 52/2311 | 262/18723 | 3.34e-04 | 3.52e-03 | 52 |
| GO:00987549 | Cervix | CC | detoxification | 33/2311 | 152/18723 | 7.97e-04 | 7.00e-03 | 33 |
| GO:00464564 | Cervix | CC | icosanoid biosynthetic process | 15/2311 | 56/18723 | 2.60e-03 | 1.80e-02 | 15 |
| GO:004645611 | Cervix | HSIL_HPV | icosanoid biosynthetic process | 10/737 | 56/18723 | 5.80e-05 | 1.40e-03 | 10 |
| GO:000963614 | Cervix | HSIL_HPV | response to toxic substance | 24/737 | 262/18723 | 1.14e-04 | 2.36e-03 | 24 |
| GO:009886914 | Cervix | HSIL_HPV | cellular oxidant detoxification | 13/737 | 101/18723 | 1.64e-04 | 3.14e-03 | 13 |
| GO:009875414 | Cervix | HSIL_HPV | detoxification | 16/737 | 152/18723 | 3.32e-04 | 5.31e-03 | 16 |
| GO:009723714 | Cervix | HSIL_HPV | cellular response to toxic substance | 14/737 | 124/18723 | 3.76e-04 | 5.89e-03 | 14 |
| GO:199074814 | Cervix | HSIL_HPV | cellular detoxification | 13/737 | 116/18723 | 6.46e-04 | 8.85e-03 | 13 |
| GO:00066907 | Cervix | HSIL_HPV | icosanoid metabolic process | 12/737 | 123/18723 | 3.36e-03 | 3.04e-02 | 12 |
| GO:000963624 | Cervix | N_HPV | response to toxic substance | 27/534 | 262/18723 | 9.00e-09 | 1.71e-06 | 27 |
| GO:009886924 | Cervix | N_HPV | cellular oxidant detoxification | 13/534 | 101/18723 | 5.89e-06 | 2.15e-04 | 13 |
| GO:009723724 | Cervix | N_HPV | cellular response to toxic substance | 14/534 | 124/18723 | 1.22e-05 | 4.06e-04 | 14 |
| GO:199074824 | Cervix | N_HPV | cellular detoxification | 13/534 | 116/18723 | 2.69e-05 | 7.30e-04 | 13 |
| GO:009875424 | Cervix | N_HPV | detoxification | 15/534 | 152/18723 | 3.05e-05 | 8.02e-04 | 15 |
| GO:004645621 | Cervix | N_HPV | icosanoid biosynthetic process | 7/534 | 56/18723 | 1.02e-03 | 1.20e-02 | 7 |
| GO:000963618 | Oral cavity | OSCC | response to toxic substance | 137/7305 | 262/18723 | 7.94e-06 | 8.52e-05 | 137 |
| Page: 1 2 |
| Pathway ID | Tissue | Disease Stage | Description | Gene Ratio | Bg Ratio | pvalue | p.adjust | qvalue | Count |
| Page: 1 |
Top |
Cell-cell communication analysis |
| Identification of potential cell-cell interactions between two cell types and their ligand-receptor pairs for different disease states |
| Ligand | Receptor | LRpair | Pathway | Tissue | Disease Stage |
| Page: 1 |
Top |
Single-cell gene regulatory network inference analysis |
| Find out the significant the regulons (TFs) and the target genes of each regulon across cell types for different disease states |
| TF | Cell Type | Tissue | Disease Stage | Target Gene | RSS | Regulon Activity |
| ∗The dot plots of a searched regulon are shown for all cell subpopulations in each disease state of each tissue based on the regulon specific score inferred using pySCENIC and by calculating the average expression. |
| Page: 1 |
Top |
Somatic mutation of malignant transformation related genes |
| Annotation of somatic variants for genes involved in malignant transformation |
| Hugo Symbol | Variant Class | Variant Classification | dbSNP RS | HGVSc | HGVSp | HGVSp Short | SWISSPROT | BIOTYPE | SIFT | PolyPhen | Tumor Sample Barcode | Tissue | Histology | Sex | Age | Stage | Therapy Types | Drugs | Outcome |
| LTC4S | SNV | Missense_Mutation | novel | c.68C>A | p.Ser23Tyr | p.S23Y | Q16873 | protein_coding | deleterious(0) | possibly_damaging(0.726) | TCGA-56-8504-01 | Lung | lung squamous cell carcinoma | Male | >=65 | I/II | Unknown | Unknown | SD |
| LTC4S | SNV | Missense_Mutation | rs370555009 | c.10G>A | p.Glu4Lys | p.E4K | Q16873 | protein_coding | tolerated(0.16) | benign(0.097) | TCGA-YL-A8S8-01 | Prostate | prostate adenocarcinoma | Male | >=65 | 9 | Unknown | Unknown | PD |
| Page: 1 |
Top |
Related drugs of malignant transformation related genes |
| Identification of chemicals and drugs interact with genes involved in malignant transfromation |
| (DGIdb 4.0) |
| Entrez ID | Symbol | Category | Interaction Types | Drug Claim Name | Drug Name | PMIDs |
| 4056 | LTC4S | ENZYME, DRUGGABLE GENOME | inhibitor | 385612238 | ||
| 4056 | LTC4S | ENZYME, DRUGGABLE GENOME | US20160326143, 3 | |||
| 4056 | LTC4S | ENZYME, DRUGGABLE GENOME | montelukast | MONTELUKAST | ||
| 4056 | LTC4S | ENZYME, DRUGGABLE GENOME | inhibitor | 252827532 | ||
| 4056 | LTC4S | ENZYME, DRUGGABLE GENOME | inhibitor | 336446942 | ||
| 4056 | LTC4S | ENZYME, DRUGGABLE GENOME | inhibitor | 336446941 | ||
| 4056 | LTC4S | ENZYME, DRUGGABLE GENOME | US20160326143, 28 | |||
| 4056 | LTC4S | ENZYME, DRUGGABLE GENOME | US20160326143, 38 | |||
| 4056 | LTC4S | ENZYME, DRUGGABLE GENOME | aspirin | ASPIRIN | 19862937,15100686,16433794 | |
| 4056 | LTC4S | ENZYME, DRUGGABLE GENOME | US20160326143, 50 |
| Page: 1 |

Copyright 2023-Present -The University of Texas Health Science Center at Houston |