Schematic overview of the cellular and molecular mechanisms involved in the cancer progression, including the proposed cellular and molecular mechanisms in cancer cells trajectory. AT1: alveolar type 1 cells; AT2: alveolar type 2 cells; AAH: atypical adenomatous hyperplasia; AIS: adenocarcinoma in situ; MIA: minimally invasive adenocarcinoma; IA: invasive adenocarcinoma; EMT: epithelial-mesenchymal transition

Home

Download

Statistics

Help

Contact

Center for Computational Systems Medicine
leaf

Gene summary

leaf

Malignant transformation analysis

leaf

Malignant transformation related pathway analysis

leaf

Cell-cell communication analysis

leaf

Single-cell gene regulatory network inference analysis

leaf

Somatic mutation of malignant transformation related genes

leaf

Related drugs of malignant transformation related genes

Gene: LTBP4

Gene summary for LTBP4

check button Gene summary.

Gene informationSpeciesHuman
Gene symbol

LTBP4

Gene ID

8425

Gene namelatent transforming growth factor beta binding protein 4
Gene AliasARCL1C
Cytomap19q13.2
Gene Typeprotein-coding
GO ID

GO:0001558

UniProtAcc

B3KXY6


Top

Malignant transformation analysis

check button Identification of the aberrant gene expression in precancerous and cancerous lesions by comparing the gene expression of stem-like cells in diseased tissues with normal stem cells
check button Malignant transformation involving gene list.
Entrez IDSymbolReplicatesSpeciesOrganTissueAdj P-valueLog2FCMalignancy
8425LTBP4AEH-subject1HumanEndometriumAEH1.71e-37-6.89e-01-0.3059
8425LTBP4AEH-subject2HumanEndometriumAEH2.06e-13-5.08e-01-0.2525
8425LTBP4AEH-subject3HumanEndometriumAEH9.13e-24-6.14e-01-0.2576
8425LTBP4AEH-subject4HumanEndometriumAEH1.18e-16-5.80e-01-0.2657
8425LTBP4AEH-subject5HumanEndometriumAEH3.18e-32-7.12e-01-0.2953
8425LTBP4EEC-subject1HumanEndometriumEEC5.85e-30-7.23e-01-0.2682
8425LTBP4EEC-subject2HumanEndometriumEEC1.38e-24-6.37e-01-0.2607
8425LTBP4EEC-subject3HumanEndometriumEEC7.50e-37-6.77e-01-0.2525
8425LTBP4EEC-subject4HumanEndometriumEEC1.75e-24-6.19e-01-0.2571
8425LTBP4EEC-subject5HumanEndometriumEEC2.74e-42-7.35e-01-0.249
8425LTBP4GSM5276935HumanEndometriumEEC4.33e-43-7.54e-01-0.123
8425LTBP4GSM5276937HumanEndometriumEEC1.79e-03-3.37e-01-0.0897
8425LTBP4GSM6177620_NYU_UCEC1_lib1_lib1HumanEndometriumEEC1.28e-34-7.58e-01-0.1869
8425LTBP4GSM6177620_NYU_UCEC1_lib2_lib2HumanEndometriumEEC7.73e-31-7.56e-01-0.1875
8425LTBP4GSM6177620_NYU_UCEC1_lib3_lib3HumanEndometriumEEC1.02e-35-7.60e-01-0.1883
8425LTBP4GSM6177621_NYU_UCEC2_lib1_lib1HumanEndometriumEEC1.08e-29-6.00e-01-0.1934
8425LTBP4GSM6177622_NYU_UCEC3_lib1_lib1HumanEndometriumEEC2.68e-38-6.98e-01-0.1917
8425LTBP4GSM6177622_NYU_UCEC3_lib2_lib2HumanEndometriumEEC7.53e-39-7.21e-01-0.1916
8425LTBP4GSM6177623_NYU_UCEC3_VisHumanEndometriumEEC1.76e-30-7.11e-01-0.1269
8425LTBP4LZE4THumanEsophagusESCC1.61e-101.03e-020.0811
Page: 1 2 3 4 5 6 

check button Transcriptomic changes along malignancy continuum.
TissueExpression DynamicsAbbreviation
EndometriumThe image shows the transcriptomic changes along malignancy continuum.log2FC in expression of this searched gene in stem-like cells from each diseased tissue sample relative to stem-like cells in normal samples in each tissue plotted against the malignancy continuum. Samples are colored based on if they are from different disease stage.
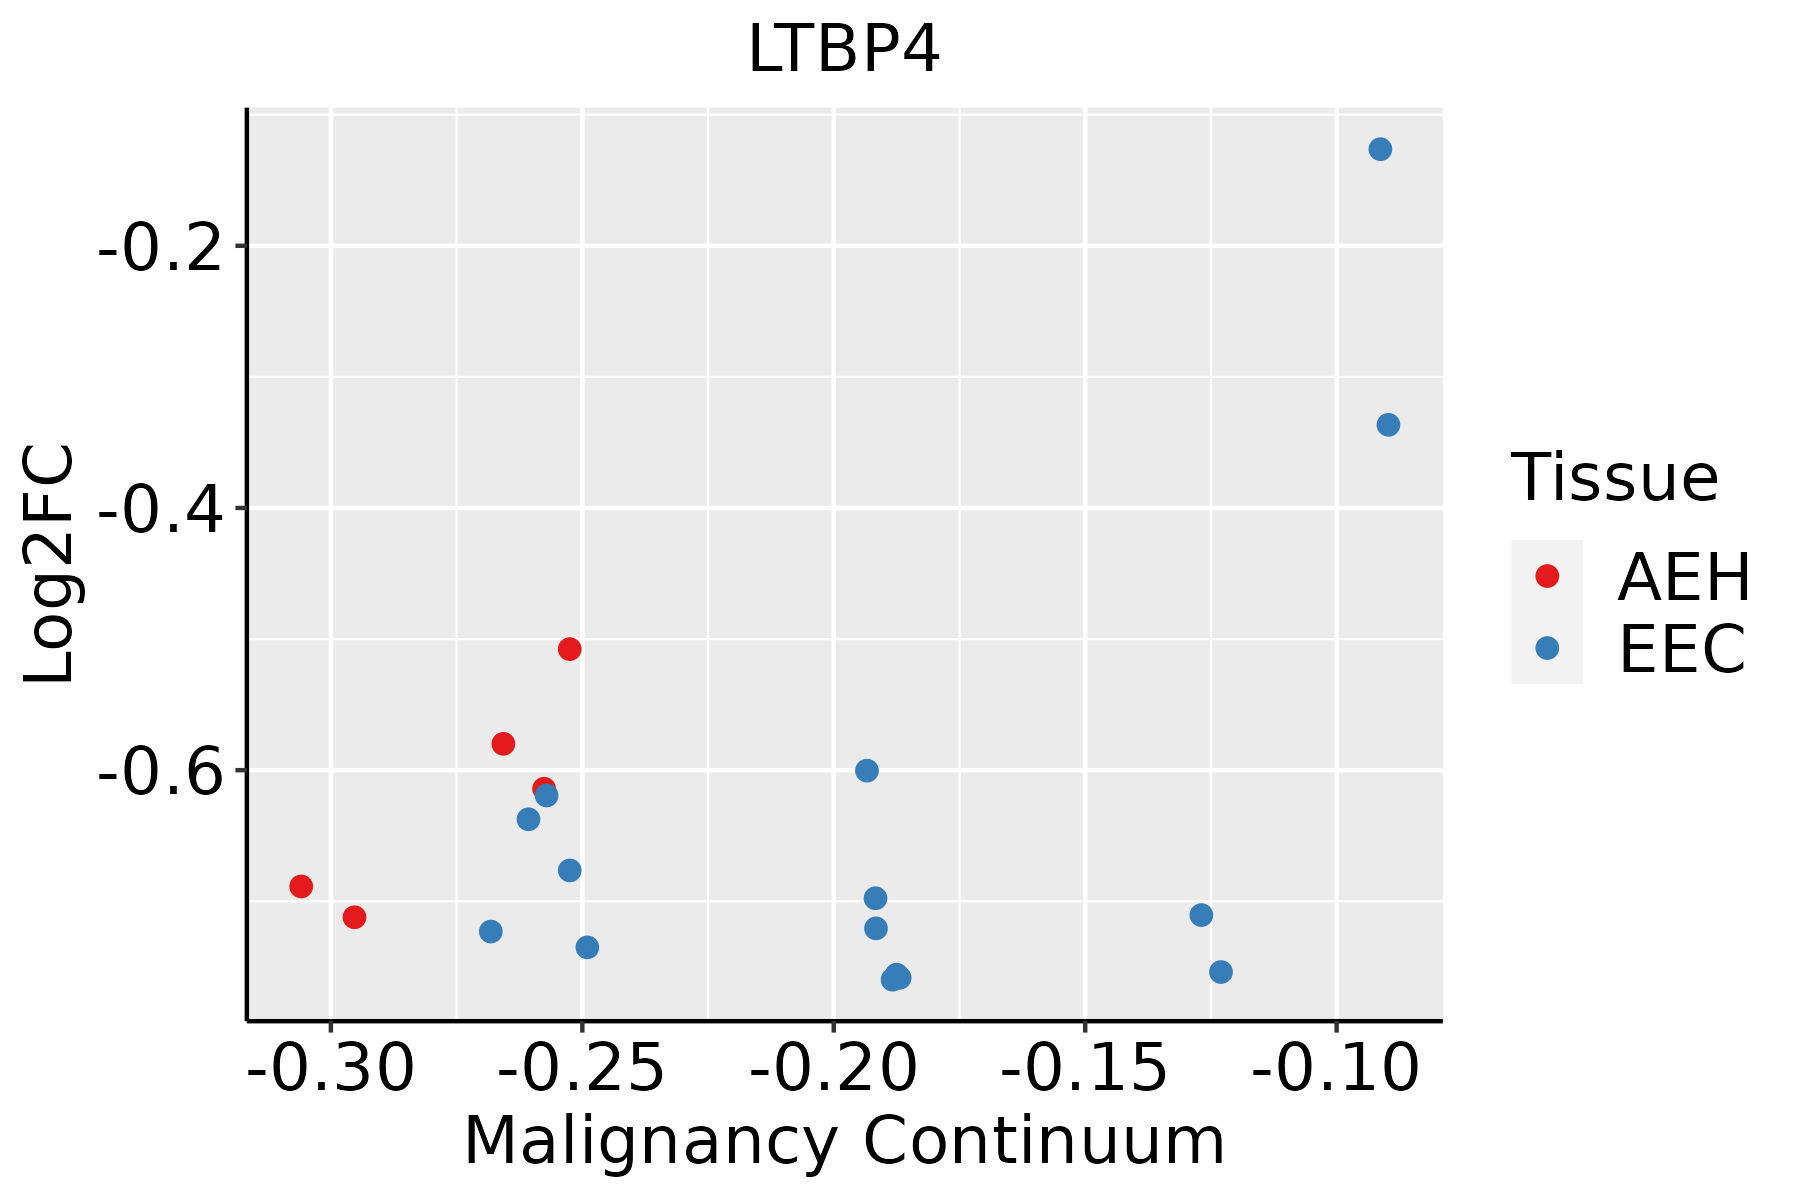
AEH: Atypical endometrial hyperplasia
EEC: Endometrioid Cancer
EsophagusThe image shows the transcriptomic changes along malignancy continuum.log2FC in expression of this searched gene in stem-like cells from each diseased tissue sample relative to stem-like cells in normal samples in each tissue plotted against the malignancy continuum. Samples are colored based on if they are from different disease stage.
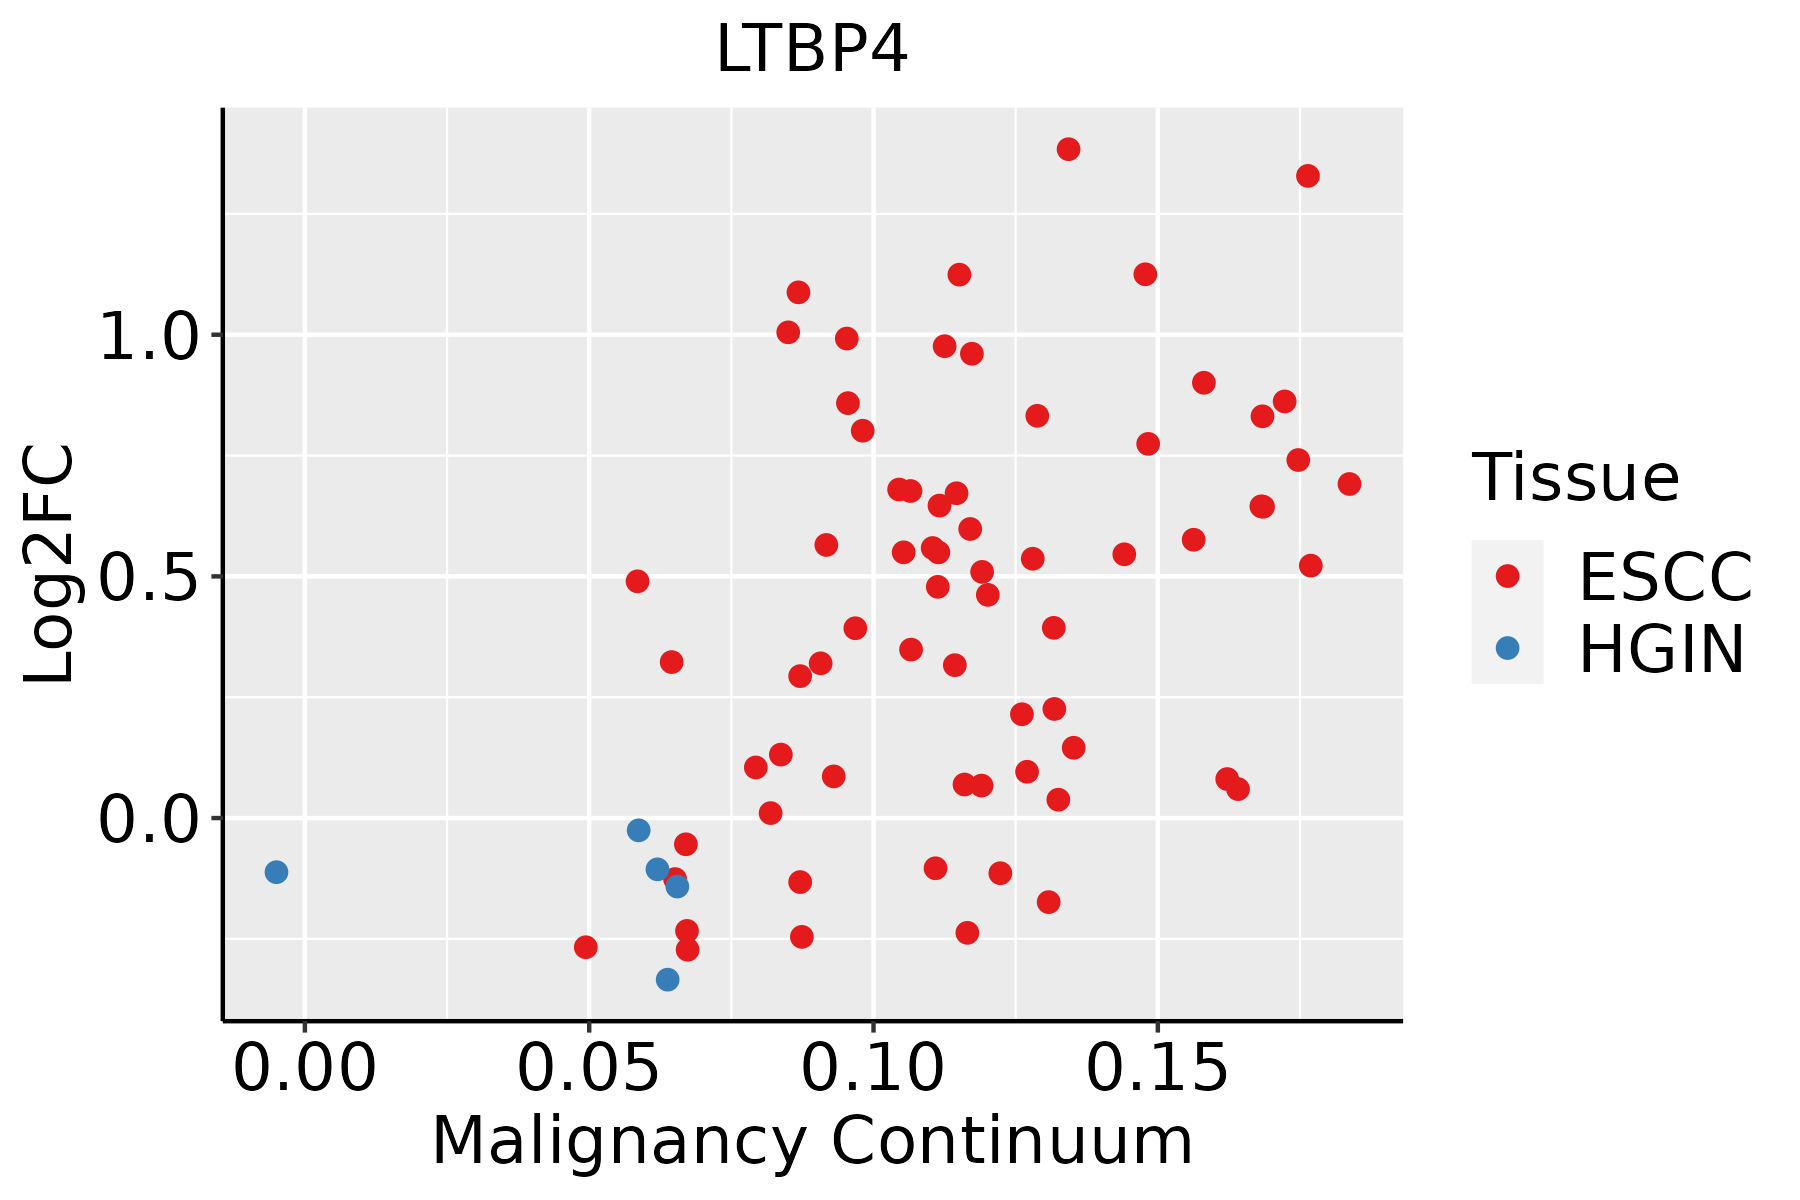
ESCC: Esophageal squamous cell carcinoma
HGIN: High-grade intraepithelial neoplasias
LGIN: Low-grade intraepithelial neoplasias
LiverThe image shows the transcriptomic changes along malignancy continuum.log2FC in expression of this searched gene in stem-like cells from each diseased tissue sample relative to stem-like cells in normal samples in each tissue plotted against the malignancy continuum. Samples are colored based on if they are from different disease stage.HCC: Hepatocellular carcinoma
NAFLD: Non-alcoholic fatty liver disease
Oral CavityThe image shows the transcriptomic changes along malignancy continuum.log2FC in expression of this searched gene in stem-like cells from each diseased tissue sample relative to stem-like cells in normal samples in each tissue plotted against the malignancy continuum. Samples are colored based on if they are from different disease stage.EOLP: Erosive Oral lichen planus
LP: leukoplakia
NEOLP: Non-erosive oral lichen planus
OSCC: Oral squamous cell carcinoma
ThyroidThe image shows the transcriptomic changes along malignancy continuum.log2FC in expression of this searched gene in stem-like cells from each diseased tissue sample relative to stem-like cells in normal samples in each tissue plotted against the malignancy continuum. Samples are colored based on if they are from different disease stage.
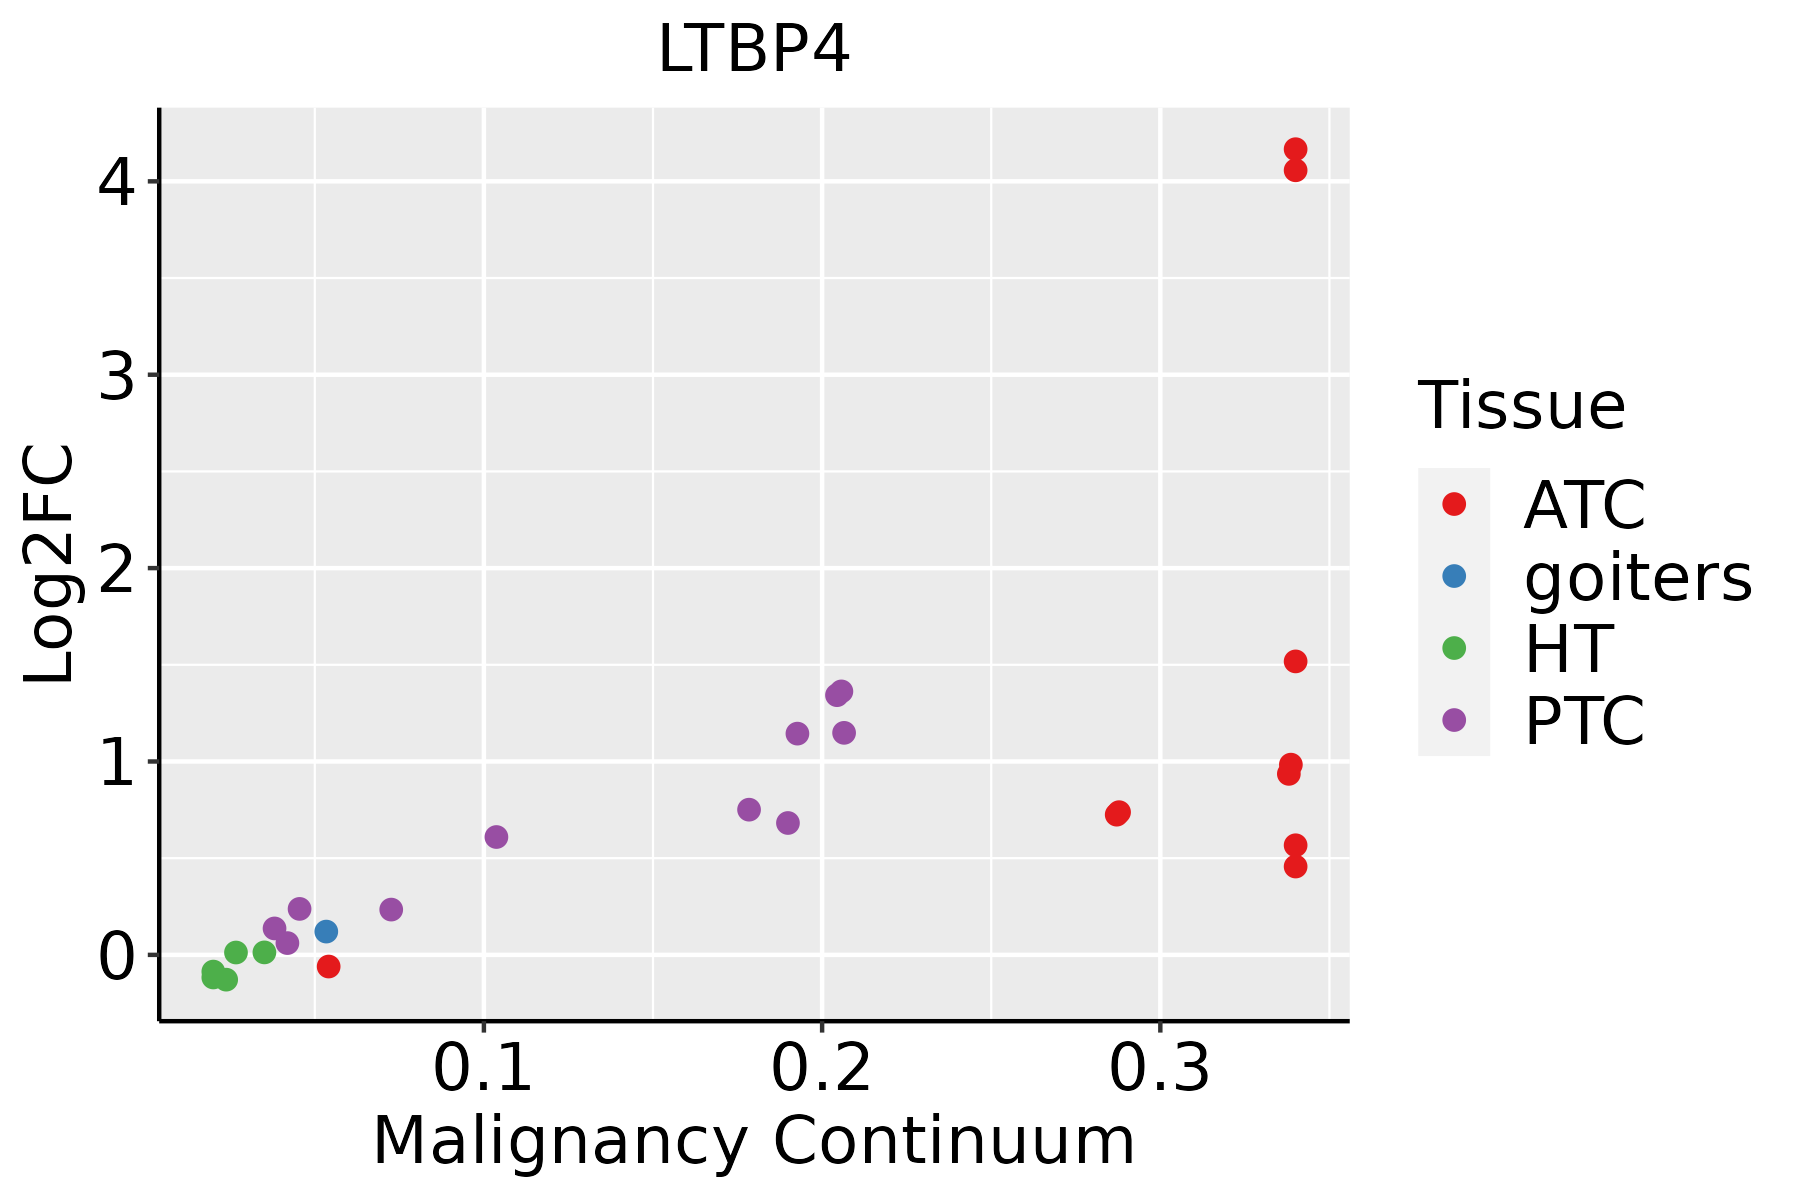
ATC: Anaplastic thyroid cancer
HT: Hashimoto's thyroiditis
PTC: Papillary thyroid cancer
∗log2FC in expression of this searched gene in stem-like cells from each diseased tissue sample relative to stem-like cells in normal samples in each tissue plotted against the malignancy continuum. Samples are colored based on if they are from different disease stage.

Top

Malignant transformation related pathway analysis

check buttonFind out the enriched GO biological processes and KEGG pathways involved in transition from healthy to precancer to cancer
check button Figure of enriched GO biological processes.
TissueDisease StageEnriched GO biological Processes
ColorectumADGO analysis - Figure of enriched GO biological processes: Top 15 enriched GO BP terms are showed in the bar plot of each disease state in each tissue. Each row represents a significant GO biological process which is colored according to the -log10(p.adjust).
ColorectumSERGO analysis - Figure of enriched GO biological processes: Top 15 enriched GO BP terms are showed in the bar plot of each disease state in each tissue. Each row represents a significant GO biological process which is colored according to the -log10(p.adjust).
ColorectumMSSGO analysis - Figure of enriched GO biological processes: Top 15 enriched GO BP terms are showed in the bar plot of each disease state in each tissue. Each row represents a significant GO biological process which is colored according to the -log10(p.adjust).
ColorectumMSI-HGO analysis - Figure of enriched GO biological processes: Top 15 enriched GO BP terms are showed in the bar plot of each disease state in each tissue. Each row represents a significant GO biological process which is colored according to the -log10(p.adjust).
ColorectumFAPGO analysis - Figure of enriched GO biological processes: Top 15 enriched GO BP terms are showed in the bar plot of each disease state in each tissue. Each row represents a significant GO biological process which is colored according to the -log10(p.adjust).
∗Top 15 enriched GO BP terms are showed in the bar plot of each disease state in each tissue. Each row represents a significant GO biological process which is colored according to the -log10(p.adjust).
Page: 1 2 3 4 5 6 7 8 9 

check button Enriched GO biological processes.
GO IDTissueDisease StageDescriptionGene RatioBg Ratiopvaluep.adjustCount
GO:000645710EndometriumAEHprotein folding61/2100212/187231.86e-123.48e-1061
GO:00160499EndometriumAEHcell growth93/2100482/187231.00e-074.99e-0693
GO:00715596EndometriumAEHresponse to transforming growth factor beta53/2100256/187237.01e-061.69e-0453
GO:00071787EndometriumAEHtransmembrane receptor protein serine/threonine kinase signaling pathway67/2100355/187231.28e-052.80e-0467
GO:00715606EndometriumAEHcellular response to transforming growth factor beta stimulus51/2100250/187231.59e-053.32e-0451
GO:00015589EndometriumAEHregulation of cell growth75/2100414/187231.79e-053.65e-0475
GO:00071796EndometriumAEHtransforming growth factor beta receptor signaling pathway38/2100198/187236.41e-046.23e-0338
GO:00900922EndometriumAEHregulation of transmembrane receptor protein serine/threonine kinase signaling pathway43/2100256/187234.47e-032.93e-0243
GO:000645715EndometriumEECprotein folding63/2168212/187236.82e-131.40e-1063
GO:001604915EndometriumEECcell growth95/2168482/187231.16e-075.54e-0695
GO:007155914EndometriumEECresponse to transforming growth factor beta54/2168256/187238.25e-061.83e-0454
GO:000155814EndometriumEECregulation of cell growth77/2168414/187231.64e-053.16e-0477
GO:007156014EndometriumEECcellular response to transforming growth factor beta stimulus52/2168250/187231.81e-053.41e-0452
GO:000717814EndometriumEECtransmembrane receptor protein serine/threonine kinase signaling pathway68/2168355/187231.90e-053.50e-0468
GO:000717914EndometriumEECtransforming growth factor beta receptor signaling pathway39/2168198/187236.03e-045.98e-0339
GO:009009211EndometriumEECregulation of transmembrane receptor protein serine/threonine kinase signaling pathway44/2168256/187234.72e-033.00e-0244
GO:0006457110EsophagusESCCprotein folding163/8552212/187231.13e-201.74e-18163
GO:0016049110EsophagusESCCcell growth289/8552482/187231.29e-103.77e-09289
GO:000155819EsophagusESCCregulation of cell growth248/8552414/187232.97e-096.45e-08248
GO:00715599EsophagusESCCresponse to transforming growth factor beta157/8552256/187232.95e-074.23e-06157
Page: 1 2 3 4 

check button Enriched KEGG pathways.
Pathway IDTissueDisease StageDescriptionGene RatioBg Ratiopvaluep.adjustqvalueCount
Page: 1 

Top

Cell-cell communication analysis

check buttonIdentification of potential cell-cell interactions between two cell types and their ligand-receptor pairs for different disease states
LigandReceptorLRpairPathwayTissueDisease Stage
Page: 1 

Top

Single-cell gene regulatory network inference analysis

check buttonFind out the significant the regulons (TFs) and the target genes of each regulon across cell types for different disease states
TFCell TypeTissueDisease StageTarget GeneRSSRegulon Activity
∗The dot plots of a searched regulon are shown for all cell subpopulations in each disease state of each tissue based on the regulon specific score inferred using pySCENIC and by calculating the average expression.
Page: 1 

Top

Somatic mutation of malignant transformation related genes

check buttonAnnotation of somatic variants for genes involved in malignant transformation
Hugo SymbolVariant ClassVariant ClassificationdbSNP RSHGVScHGVSpHGVSp ShortSWISSPROTBIOTYPESIFTPolyPhenTumor Sample BarcodeTissueHistologySexAgeStageTherapy TypesDrugsOutcome
LTBP4SNVMissense_Mutationrs776226657c.2903G>Ap.Arg968Glnp.R968QQ8N2S1protein_codingtolerated(0.33)possibly_damaging(0.792)TCGA-A2-A1FV-01Breastbreast invasive carcinomaFemale>=65I/IIChemotherapycyclophosphamideSD
LTBP4SNVMissense_Mutationnovelc.1721N>Gp.Ser574Cysp.S574CQ8N2S1protein_codingdeleterious(0.03)benign(0.41)TCGA-A7-A4SF-01Breastbreast invasive carcinomaFemale<65I/IIChemotherapycarboplatinCR
LTBP4SNVMissense_Mutationrs764846754c.3161N>Ap.Arg1054Glnp.R1054QQ8N2S1protein_codingtolerated(0.22)probably_damaging(0.937)TCGA-A8-A09B-01Breastbreast invasive carcinomaFemale<65III/IVChemotherapy5-fluorouracilSD
LTBP4SNVMissense_Mutationrs748078658c.3190G>Ap.Val1064Metp.V1064MQ8N2S1protein_codingtolerated(0.22)benign(0.031)TCGA-AO-A128-01Breastbreast invasive carcinomaFemale<65I/IIChemotherapydoxorubicinSD
LTBP4SNVMissense_Mutationrs759424524c.3614N>Gp.Glu1205Glyp.E1205GQ8N2S1protein_codingdeleterious(0)probably_damaging(0.963)TCGA-B6-A0IA-01Breastbreast invasive carcinomaFemale<65I/IIUnknownUnknownSD
LTBP4SNVMissense_Mutationnovelc.4691N>Ap.Arg1564Hisp.R1564HQ8N2S1protein_codingtolerated(0.08)possibly_damaging(0.866)TCGA-B6-A402-01Breastbreast invasive carcinomaFemale<65I/IIChemotherapycyclophosphamidePD
LTBP4SNVMissense_Mutationc.1495N>Gp.Arg499Glyp.R499GQ8N2S1protein_codingtolerated(0.05)benign(0.056)TCGA-BH-A0HP-01Breastbreast invasive carcinomaFemale>=65III/IVChemotherapydoxorubicinSD
LTBP4SNVMissense_Mutationrs768448054c.2108N>Ap.Arg703Glnp.R703QQ8N2S1protein_codingtolerated(0.14)benign(0.006)TCGA-D8-A1Y2-01Breastbreast invasive carcinomaFemale>=65I/IIHormone TherapytamoxiphenSD
LTBP4SNVMissense_Mutationnovelc.1520N>Tp.Thr507Ilep.T507IQ8N2S1protein_codingtolerated(0.07)possibly_damaging(0.878)TCGA-D8-A27N-01Breastbreast invasive carcinomaFemale<65III/IVChemotherapytaxol+adriamycin+cyclophosphamide+herceptinSD
LTBP4SNVMissense_Mutationc.2051N>Tp.Arg684Leup.R684LQ8N2S1protein_codingdeleterious(0.05)benign(0.217)TCGA-E2-A152-01Breastbreast invasive carcinomaFemale<65I/IITargeted Molecular therapytrastuzumabPD
Page: 1 2 3 4 5 6 7 8 9 10 11 12 13 14 15 16 

Top

Related drugs of malignant transformation related genes

check buttonIdentification of chemicals and drugs interact with genes involved in malignant transfromation
(DGIdb 4.0)
Entrez IDSymbolCategoryInteraction TypesDrug Claim NameDrug NamePMIDs
Page: 1