Schematic overview of the cellular and molecular mechanisms involved in the cancer progression, including the proposed cellular and molecular mechanisms in cancer cells trajectory. AT1: alveolar type 1 cells; AT2: alveolar type 2 cells; AAH: atypical adenomatous hyperplasia; AIS: adenocarcinoma in situ; MIA: minimally invasive adenocarcinoma; IA: invasive adenocarcinoma; EMT: epithelial-mesenchymal transition

Home

Download

Statistics

Help

Contact

Center for Computational Systems Medicine
leaf

Gene summary

leaf

Malignant transformation analysis

leaf

Malignant transformation related pathway analysis

leaf

Cell-cell communication analysis

leaf

Single-cell gene regulatory network inference analysis

leaf

Somatic mutation of malignant transformation related genes

leaf

Related drugs of malignant transformation related genes

Gene: LTBP3

Gene summary for LTBP3

check button Gene summary.

Gene informationSpeciesHuman
Gene symbol

LTBP3

Gene ID

4054

Gene namelatent transforming growth factor beta binding protein 3
Gene AliasDASS
Cytomap11q13.1
Gene Typeprotein-coding
GO ID

GO:0001501

UniProtAcc

Q8WYU6


Top

Malignant transformation analysis

check button Identification of the aberrant gene expression in precancerous and cancerous lesions by comparing the gene expression of stem-like cells in diseased tissues with normal stem cells
check button Malignant transformation involving gene list.
Entrez IDSymbolReplicatesSpeciesOrganTissueAdj P-valueLog2FCMalignancy
4054LTBP3LZE2THumanEsophagusESCC3.36e-022.69e-010.082
4054LTBP3LZE4THumanEsophagusESCC1.18e-121.92e-010.0811
4054LTBP3LZE20THumanEsophagusESCC2.28e-136.39e-010.0662
4054LTBP3LZE22THumanEsophagusESCC1.96e-085.19e-010.068
4054LTBP3LZE24THumanEsophagusESCC1.18e-103.80e-010.0596
4054LTBP3P1T-EHumanEsophagusESCC4.58e-158.46e-010.0875
4054LTBP3P2T-EHumanEsophagusESCC2.14e-142.41e-010.1177
4054LTBP3P4T-EHumanEsophagusESCC3.10e-421.09e+000.1323
4054LTBP3P5T-EHumanEsophagusESCC2.41e-721.73e+000.1327
4054LTBP3P8T-EHumanEsophagusESCC9.44e-681.21e+000.0889
4054LTBP3P9T-EHumanEsophagusESCC4.73e-214.68e-010.1131
4054LTBP3P10T-EHumanEsophagusESCC4.51e-551.17e+000.116
4054LTBP3P11T-EHumanEsophagusESCC5.38e-118.03e-010.1426
4054LTBP3P12T-EHumanEsophagusESCC5.31e-386.64e-010.1122
4054LTBP3P15T-EHumanEsophagusESCC2.98e-348.06e-010.1149
4054LTBP3P16T-EHumanEsophagusESCC9.95e-193.55e-010.1153
4054LTBP3P17T-EHumanEsophagusESCC4.65e-155.62e-010.1278
4054LTBP3P19T-EHumanEsophagusESCC2.29e-067.83e-010.1662
4054LTBP3P20T-EHumanEsophagusESCC1.41e-286.20e-010.1124
4054LTBP3P21T-EHumanEsophagusESCC1.42e-611.48e+000.1617
Page: 1 2 3 4 5 6 

check button Transcriptomic changes along malignancy continuum.
TissueExpression DynamicsAbbreviation
EsophagusThe image shows the transcriptomic changes along malignancy continuum.log2FC in expression of this searched gene in stem-like cells from each diseased tissue sample relative to stem-like cells in normal samples in each tissue plotted against the malignancy continuum. Samples are colored based on if they are from different disease stage.
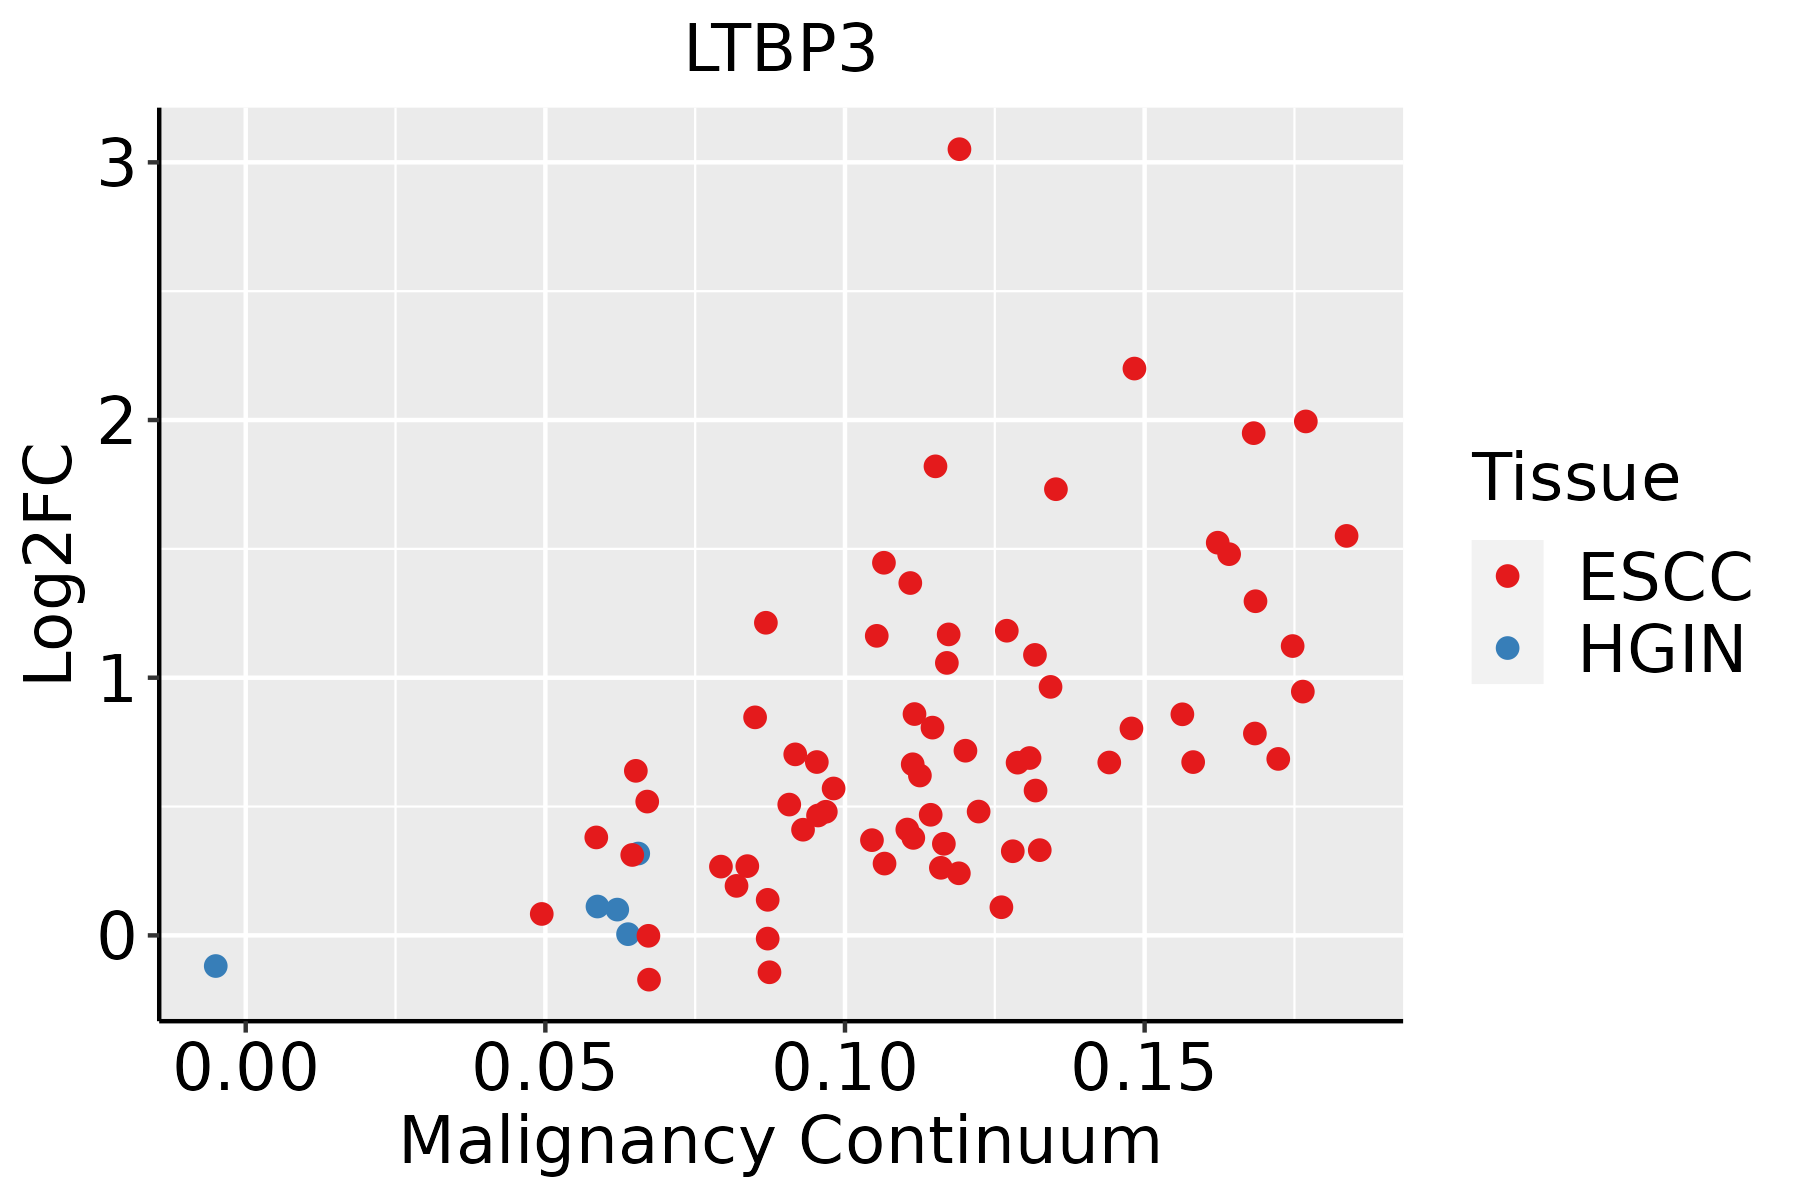
ESCC: Esophageal squamous cell carcinoma
HGIN: High-grade intraepithelial neoplasias
LGIN: Low-grade intraepithelial neoplasias
LiverThe image shows the transcriptomic changes along malignancy continuum.log2FC in expression of this searched gene in stem-like cells from each diseased tissue sample relative to stem-like cells in normal samples in each tissue plotted against the malignancy continuum. Samples are colored based on if they are from different disease stage.
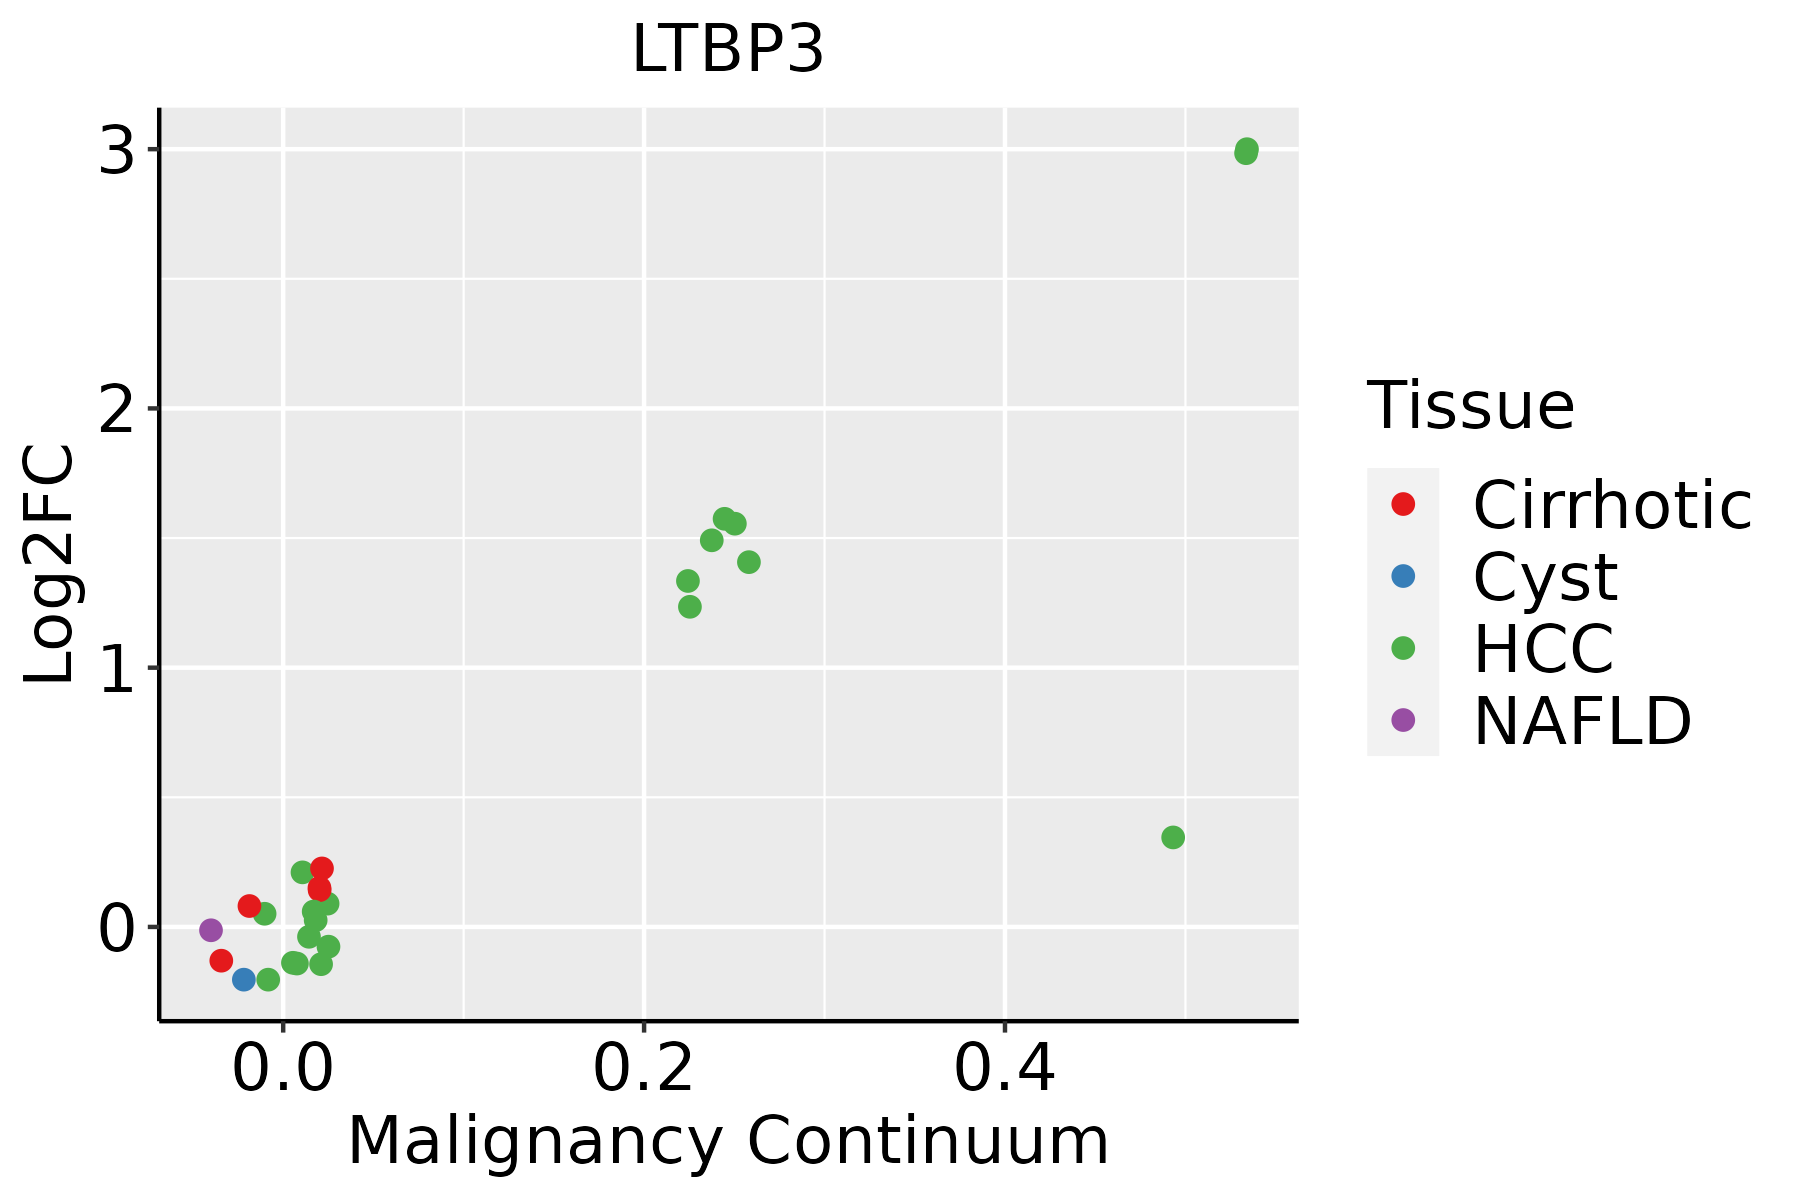
HCC: Hepatocellular carcinoma
NAFLD: Non-alcoholic fatty liver disease
Oral CavityThe image shows the transcriptomic changes along malignancy continuum.log2FC in expression of this searched gene in stem-like cells from each diseased tissue sample relative to stem-like cells in normal samples in each tissue plotted against the malignancy continuum. Samples are colored based on if they are from different disease stage.
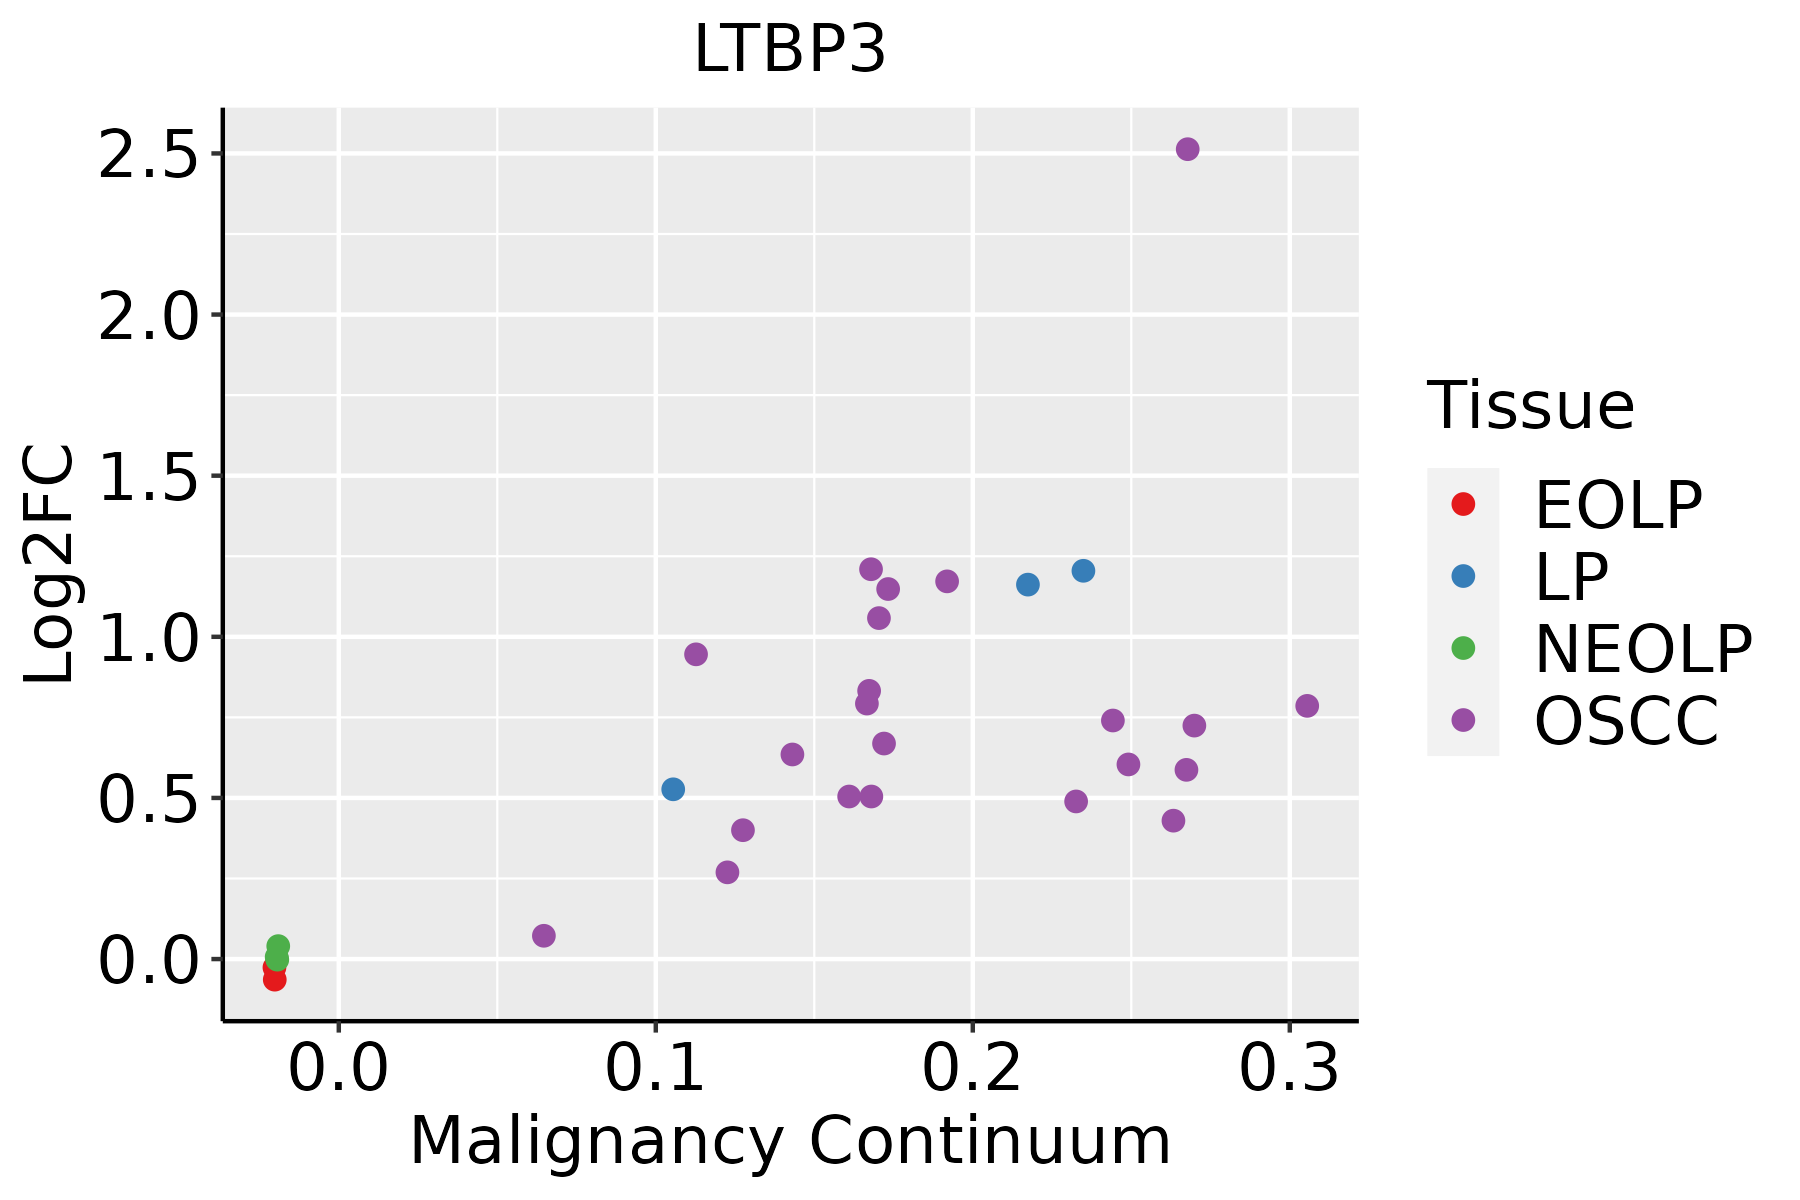
EOLP: Erosive Oral lichen planus
LP: leukoplakia
NEOLP: Non-erosive oral lichen planus
OSCC: Oral squamous cell carcinoma
SkinThe image shows the transcriptomic changes along malignancy continuum.log2FC in expression of this searched gene in stem-like cells from each diseased tissue sample relative to stem-like cells in normal samples in each tissue plotted against the malignancy continuum. Samples are colored based on if they are from different disease stage.
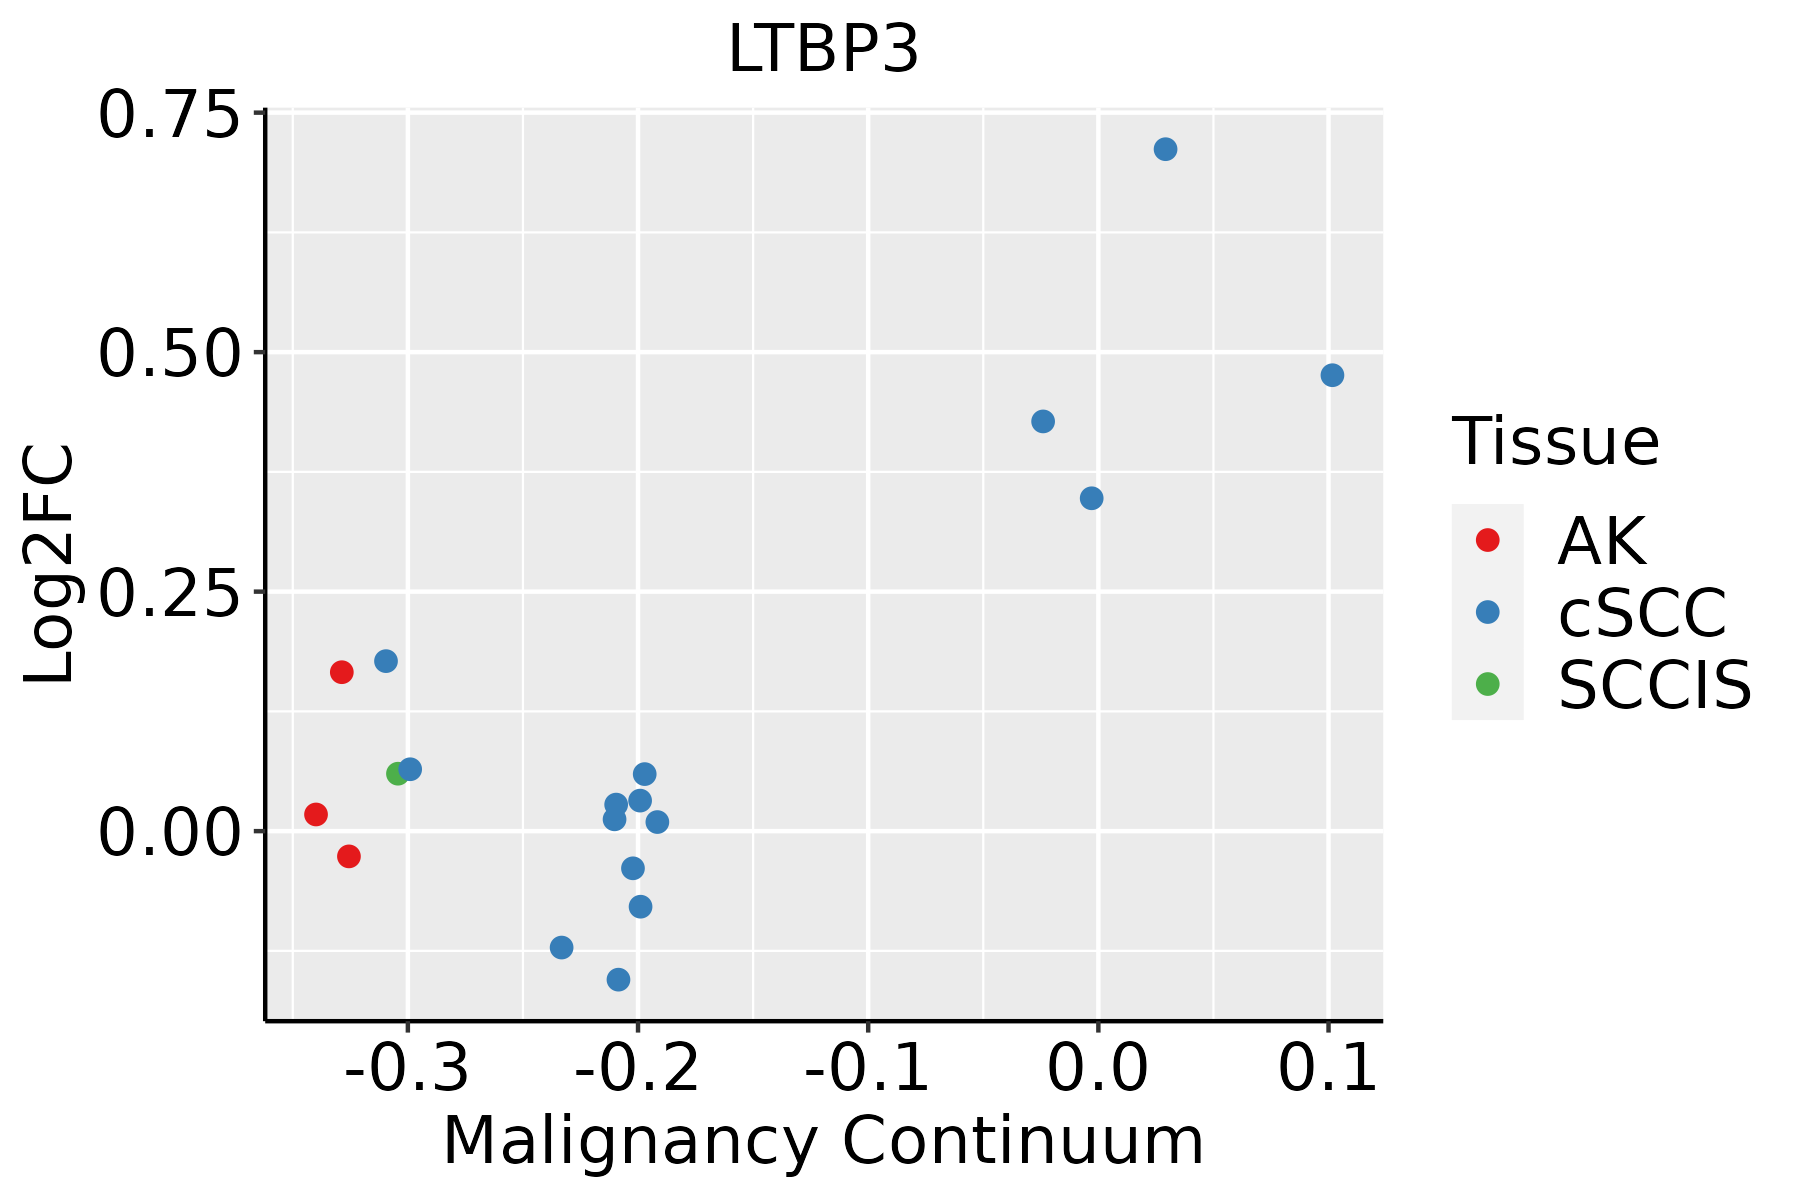
AK: Actinic keratosis
cSCC: Cutaneous squamous cell carcinoma
SCCIS:squamous cell carcinoma in situ
ThyroidThe image shows the transcriptomic changes along malignancy continuum.log2FC in expression of this searched gene in stem-like cells from each diseased tissue sample relative to stem-like cells in normal samples in each tissue plotted against the malignancy continuum. Samples are colored based on if they are from different disease stage.ATC: Anaplastic thyroid cancer
HT: Hashimoto's thyroiditis
PTC: Papillary thyroid cancer
∗log2FC in expression of this searched gene in stem-like cells from each diseased tissue sample relative to stem-like cells in normal samples in each tissue plotted against the malignancy continuum. Samples are colored based on if they are from different disease stage.

Top

Malignant transformation related pathway analysis

check buttonFind out the enriched GO biological processes and KEGG pathways involved in transition from healthy to precancer to cancer
check button Figure of enriched GO biological processes.
TissueDisease StageEnriched GO biological Processes
ColorectumADGO analysis - Figure of enriched GO biological processes: Top 15 enriched GO BP terms are showed in the bar plot of each disease state in each tissue. Each row represents a significant GO biological process which is colored according to the -log10(p.adjust).
ColorectumSERGO analysis - Figure of enriched GO biological processes: Top 15 enriched GO BP terms are showed in the bar plot of each disease state in each tissue. Each row represents a significant GO biological process which is colored according to the -log10(p.adjust).
ColorectumMSSGO analysis - Figure of enriched GO biological processes: Top 15 enriched GO BP terms are showed in the bar plot of each disease state in each tissue. Each row represents a significant GO biological process which is colored according to the -log10(p.adjust).
ColorectumMSI-HGO analysis - Figure of enriched GO biological processes: Top 15 enriched GO BP terms are showed in the bar plot of each disease state in each tissue. Each row represents a significant GO biological process which is colored according to the -log10(p.adjust).
ColorectumFAPGO analysis - Figure of enriched GO biological processes: Top 15 enriched GO BP terms are showed in the bar plot of each disease state in each tissue. Each row represents a significant GO biological process which is colored according to the -log10(p.adjust).
∗Top 15 enriched GO BP terms are showed in the bar plot of each disease state in each tissue. Each row represents a significant GO biological process which is colored according to the -log10(p.adjust).
Page: 1 2 3 4 5 6 7 8 9 

check button Enriched GO biological processes.
GO IDTissueDisease StageDescriptionGene RatioBg Ratiopvaluep.adjustCount
GO:00715599EsophagusESCCresponse to transforming growth factor beta157/8552256/187232.95e-074.23e-06157
GO:00715609EsophagusESCCcellular response to transforming growth factor beta stimulus151/8552250/187231.78e-062.10e-05151
GO:000150317EsophagusESCCossification232/8552408/187233.00e-063.40e-05232
GO:00303239EsophagusESCCrespiratory tube development112/8552181/187237.82e-067.69e-05112
GO:00071799EsophagusESCCtransforming growth factor beta receptor signaling pathway121/8552198/187238.26e-068.03e-05121
GO:00605417EsophagusESCCrespiratory system development123/8552203/187231.26e-051.15e-04123
GO:00303249EsophagusESCClung development109/8552177/187231.40e-051.27e-04109
GO:00488638EsophagusESCCstem cell differentiation122/8552206/187235.95e-054.59e-04122
GO:00301984EsophagusESCCextracellular matrix organization171/8552301/187236.08e-054.67e-04171
GO:00430624EsophagusESCCextracellular structure organization171/8552302/187237.73e-055.76e-04171
GO:00452294EsophagusESCCexternal encapsulating structure organization172/8552304/187237.80e-055.80e-04172
GO:000717810EsophagusESCCtransmembrane receptor protein serine/threonine kinase signaling pathway195/8552355/187232.58e-041.58e-03195
GO:200073614EsophagusESCCregulation of stem cell differentiation39/855258/187237.43e-043.86e-0339
GO:00603485EsophagusESCCbone development115/8552205/187231.67e-037.72e-03115
GO:00716046EsophagusESCCtransforming growth factor beta production29/855243/187233.25e-031.35e-0229
GO:00487052EsophagusESCCskeletal system morphogenesis120/8552220/187234.90e-031.89e-02120
GO:00850292EsophagusESCCextracellular matrix assembly29/855245/187238.63e-033.04e-0229
GO:00512161EsophagusESCCcartilage development103/8552190/187231.08e-023.67e-02103
GO:00020623EsophagusESCCchondrocyte differentiation60/8552106/187231.53e-024.94e-0260
GO:007155911LiverCirrhoticresponse to transforming growth factor beta96/4634256/187233.55e-066.09e-0596
Page: 1 2 3 4 5 6 

check button Enriched KEGG pathways.
Pathway IDTissueDisease StageDescriptionGene RatioBg Ratiopvaluep.adjustqvalueCount
Page: 1 

Top

Cell-cell communication analysis

check buttonIdentification of potential cell-cell interactions between two cell types and their ligand-receptor pairs for different disease states
LigandReceptorLRpairPathwayTissueDisease Stage
Page: 1 

Top

Single-cell gene regulatory network inference analysis

check buttonFind out the significant the regulons (TFs) and the target genes of each regulon across cell types for different disease states
TFCell TypeTissueDisease StageTarget GeneRSSRegulon Activity
∗The dot plots of a searched regulon are shown for all cell subpopulations in each disease state of each tissue based on the regulon specific score inferred using pySCENIC and by calculating the average expression.
Page: 1 

Top

Somatic mutation of malignant transformation related genes

check buttonAnnotation of somatic variants for genes involved in malignant transformation
Hugo SymbolVariant ClassVariant ClassificationdbSNP RSHGVScHGVSpHGVSp ShortSWISSPROTBIOTYPESIFTPolyPhenTumor Sample BarcodeTissueHistologySexAgeStageTherapy TypesDrugsOutcome
LTBP3SNVMissense_Mutationrs761955225c.1534G>Tp.Val512Leup.V512LQ9NS15protein_codingtolerated(0.16)benign(0)TCGA-AC-A23H-01Breastbreast invasive carcinomaFemale>=65I/IIUnknownUnknownPD
LTBP3SNVMissense_Mutationnovelc.2171G>Ap.Ser724Asnp.S724NQ9NS15protein_codingdeleterious(0)benign(0.149)TCGA-C8-A12V-01Breastbreast invasive carcinomaFemale<65I/IIUnknownUnknownSD
LTBP3insertionFrame_Shift_Insnovelc.1998_1999insGGAGCTTCAAGTGCATp.Pro667GlyfsTer129p.P667Gfs*129Q9NS15protein_codingTCGA-A8-A08S-01Breastbreast invasive carcinomaFemale>=65I/IIHormone TherapyanastrozoleSD
LTBP3deletionFrame_Shift_Delrs752375653c.2216delNp.Gly739AlafsTer7p.G739Afs*7Q9NS15protein_codingTCGA-BH-A18G-01Breastbreast invasive carcinomaFemale>=65I/IIUnknownUnknownSD
LTBP3SNVMissense_Mutationnovelc.1133N>Ap.Arg378Hisp.R378HQ9NS15protein_codingdeleterious(0)probably_damaging(0.966)TCGA-2W-A8YY-01Cervixcervical & endocervical cancerFemale<65I/IIChemotherapycisplatinCR
LTBP3SNVMissense_Mutationc.3115N>Cp.Glu1039Glnp.E1039QQ9NS15protein_codingdeleterious(0)probably_damaging(0.998)TCGA-EK-A2PG-01Cervixcervical & endocervical cancerFemale>=65I/IIUnknownUnknownSD
LTBP3SNVMissense_Mutationc.2896N>Ap.Glu966Lysp.E966KQ9NS15protein_codingdeleterious(0)benign(0.153)TCGA-EK-A3GK-01Cervixcervical & endocervical cancerFemale<65I/IIUnknownUnknownSD
LTBP3SNVMissense_Mutationnovelc.1598N>Ap.Thr533Lysp.T533KQ9NS15protein_codingdeleterious(0.01)benign(0.224)TCGA-EX-A69M-01Cervixcervical & endocervical cancerFemale<65I/IIUnknownUnknownPD
LTBP3SNVMissense_Mutationnovelc.3643G>Cp.Glu1215Glnp.E1215QQ9NS15protein_codingdeleterious(0.01)probably_damaging(0.994)TCGA-VS-A9UR-01Cervixcervical & endocervical cancerFemale<65I/IIChemotherapycisplatinPD
LTBP3SNVMissense_Mutationnovelc.1297G>Ap.Gly433Serp.G433SQ9NS15protein_codingdeleterious(0)probably_damaging(1)TCGA-VS-A9V0-01Cervixcervical & endocervical cancerFemale<65I/IIChemotherapycisplatinPD
Page: 1 2 3 4 5 6 7 8 9 10 

Top

Related drugs of malignant transformation related genes

check buttonIdentification of chemicals and drugs interact with genes involved in malignant transfromation
(DGIdb 4.0)
Entrez IDSymbolCategoryInteraction TypesDrug Claim NameDrug NamePMIDs
Page: 1