Schematic overview of the cellular and molecular mechanisms involved in the cancer progression, including the proposed cellular and molecular mechanisms in cancer cells trajectory. AT1: alveolar type 1 cells; AT2: alveolar type 2 cells; AAH: atypical adenomatous hyperplasia; AIS: adenocarcinoma in situ; MIA: minimally invasive adenocarcinoma; IA: invasive adenocarcinoma; EMT: epithelial-mesenchymal transition

Home

Download

Statistics

Help

Contact

Center for Computational Systems Medicine
leaf

Gene summary

leaf

Malignant transformation analysis

leaf

Malignant transformation related pathway analysis

leaf

Cell-cell communication analysis

leaf

Single-cell gene regulatory network inference analysis

leaf

Somatic mutation of malignant transformation related genes

leaf

Related drugs of malignant transformation related genes

Gene: LTBP2

Gene summary for LTBP2

check button Gene summary.

Gene informationSpeciesHuman
Gene symbol

LTBP2

Gene ID

4053

Gene namelatent transforming growth factor beta binding protein 2
Gene AliasC14orf141
Cytomap14q24.3
Gene Typeprotein-coding
GO ID

GO:0006605

UniProtAcc

Q14767


Top

Malignant transformation analysis

check button Identification of the aberrant gene expression in precancerous and cancerous lesions by comparing the gene expression of stem-like cells in diseased tissues with normal stem cells
check button Malignant transformation involving gene list.
Entrez IDSymbolReplicatesSpeciesOrganTissueAdj P-valueLog2FCMalignancy
4053LTBP2P8T-EHumanEsophagusESCC2.99e-081.38e-010.0889
4053LTBP2P12T-EHumanEsophagusESCC1.07e-04-4.07e-020.1122
4053LTBP2P15T-EHumanEsophagusESCC6.46e-064.83e-020.1149
4053LTBP2P21T-EHumanEsophagusESCC5.39e-045.08e-020.1617
4053LTBP2P24T-EHumanEsophagusESCC2.14e-039.88e-020.1287
4053LTBP2P26T-EHumanEsophagusESCC1.38e-10-7.24e-030.1276
4053LTBP2P27T-EHumanEsophagusESCC3.55e-071.51e-010.1055
4053LTBP2P36T-EHumanEsophagusESCC1.11e-022.13e-010.1187
4053LTBP2P37T-EHumanEsophagusESCC7.66e-184.22e-010.1371
4053LTBP2P42T-EHumanEsophagusESCC5.05e-032.49e-010.1175
4053LTBP2P47T-EHumanEsophagusESCC4.85e-021.85e-020.1067
4053LTBP2P48T-EHumanEsophagusESCC1.96e-023.30e-030.0959
4053LTBP2P52T-EHumanEsophagusESCC3.59e-041.01e-010.1555
4053LTBP2P61T-EHumanEsophagusESCC5.00e-046.31e-020.099
4053LTBP2P62T-EHumanEsophagusESCC5.75e-102.71e-010.1302
4053LTBP2P65T-EHumanEsophagusESCC3.09e-101.58e-010.0978
4053LTBP2P76T-EHumanEsophagusESCC5.45e-055.94e-020.1207
4053LTBP2P79T-EHumanEsophagusESCC5.61e-102.75e-010.1154
4053LTBP2P83T-EHumanEsophagusESCC3.13e-071.37e-010.1738
4053LTBP2P89T-EHumanEsophagusESCC6.29e-045.85e-010.1752
Page: 1 2 3 4 

check button Transcriptomic changes along malignancy continuum.
TissueExpression DynamicsAbbreviation
EsophagusThe image shows the transcriptomic changes along malignancy continuum.log2FC in expression of this searched gene in stem-like cells from each diseased tissue sample relative to stem-like cells in normal samples in each tissue plotted against the malignancy continuum. Samples are colored based on if they are from different disease stage.
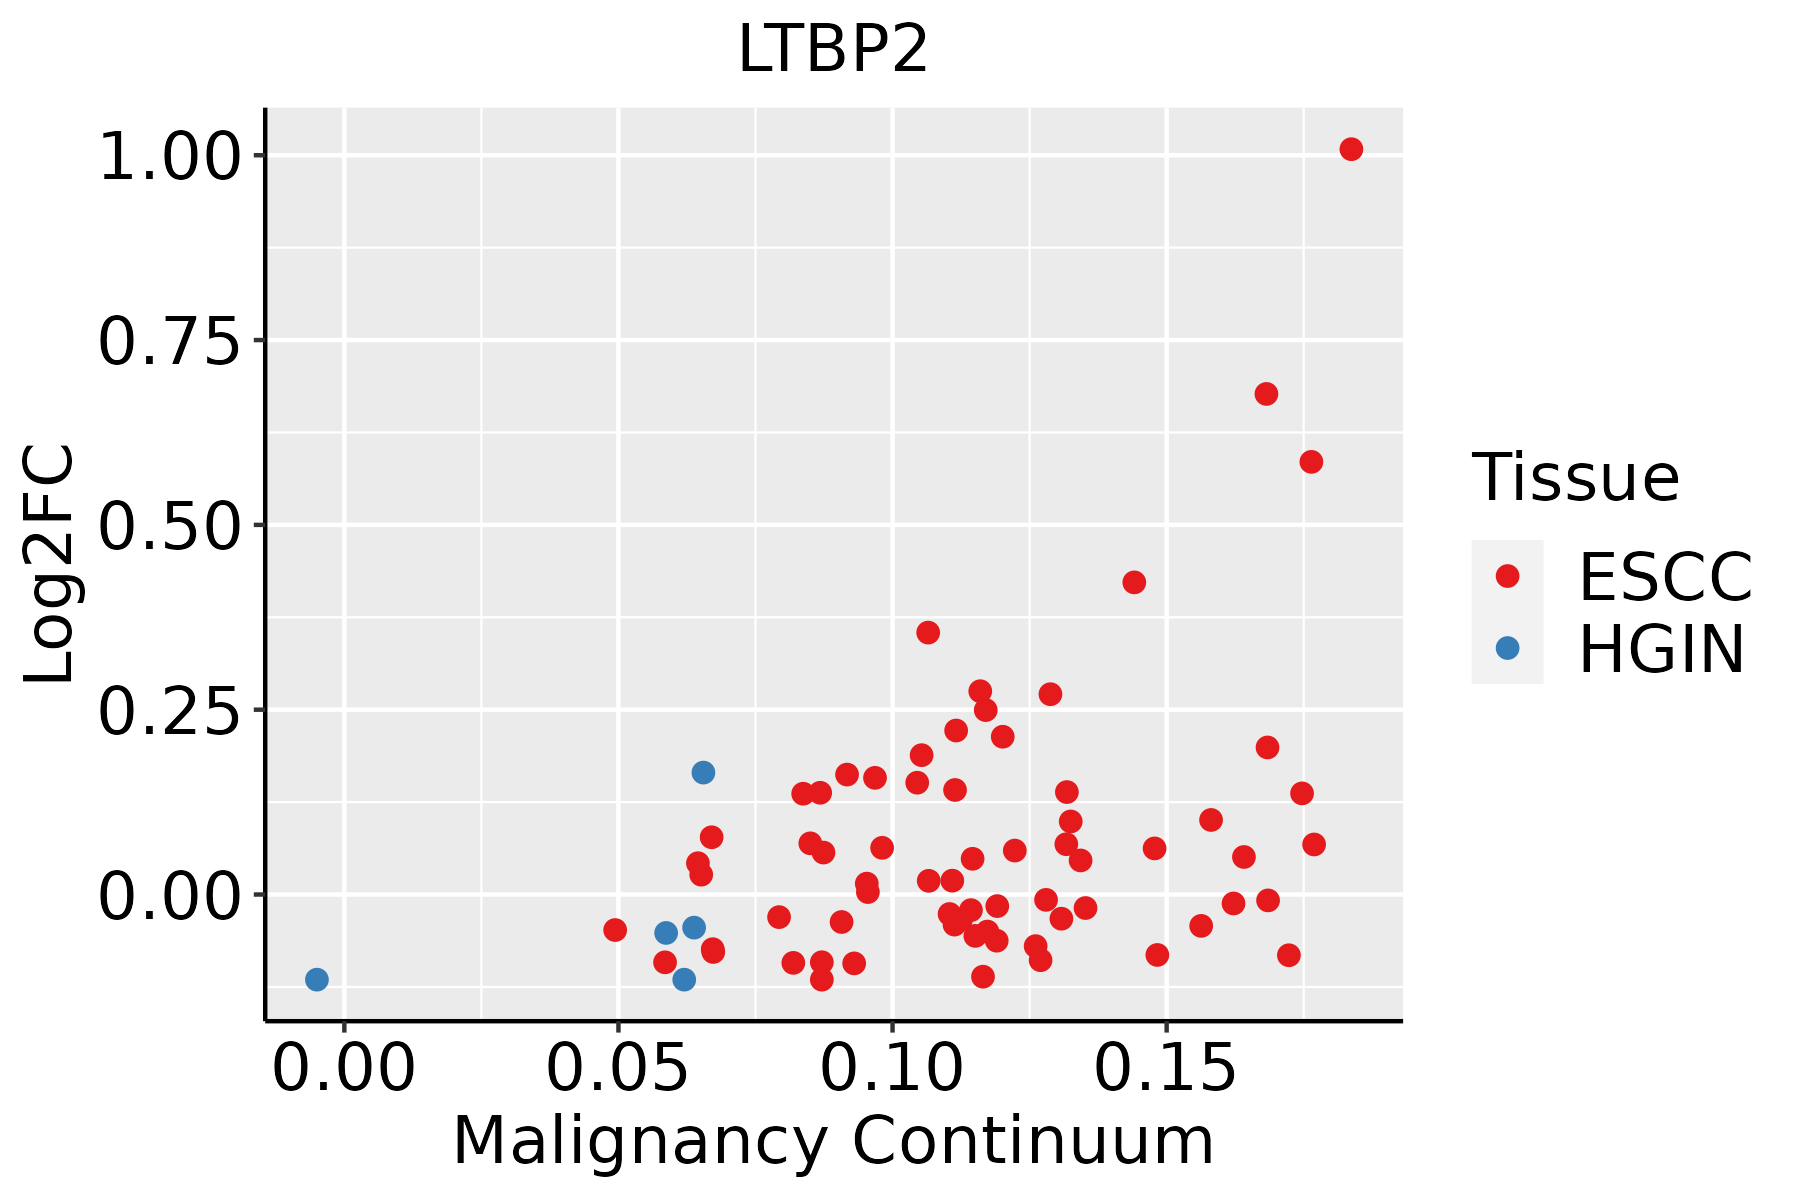
ESCC: Esophageal squamous cell carcinoma
HGIN: High-grade intraepithelial neoplasias
LGIN: Low-grade intraepithelial neoplasias
Oral CavityThe image shows the transcriptomic changes along malignancy continuum.log2FC in expression of this searched gene in stem-like cells from each diseased tissue sample relative to stem-like cells in normal samples in each tissue plotted against the malignancy continuum. Samples are colored based on if they are from different disease stage.
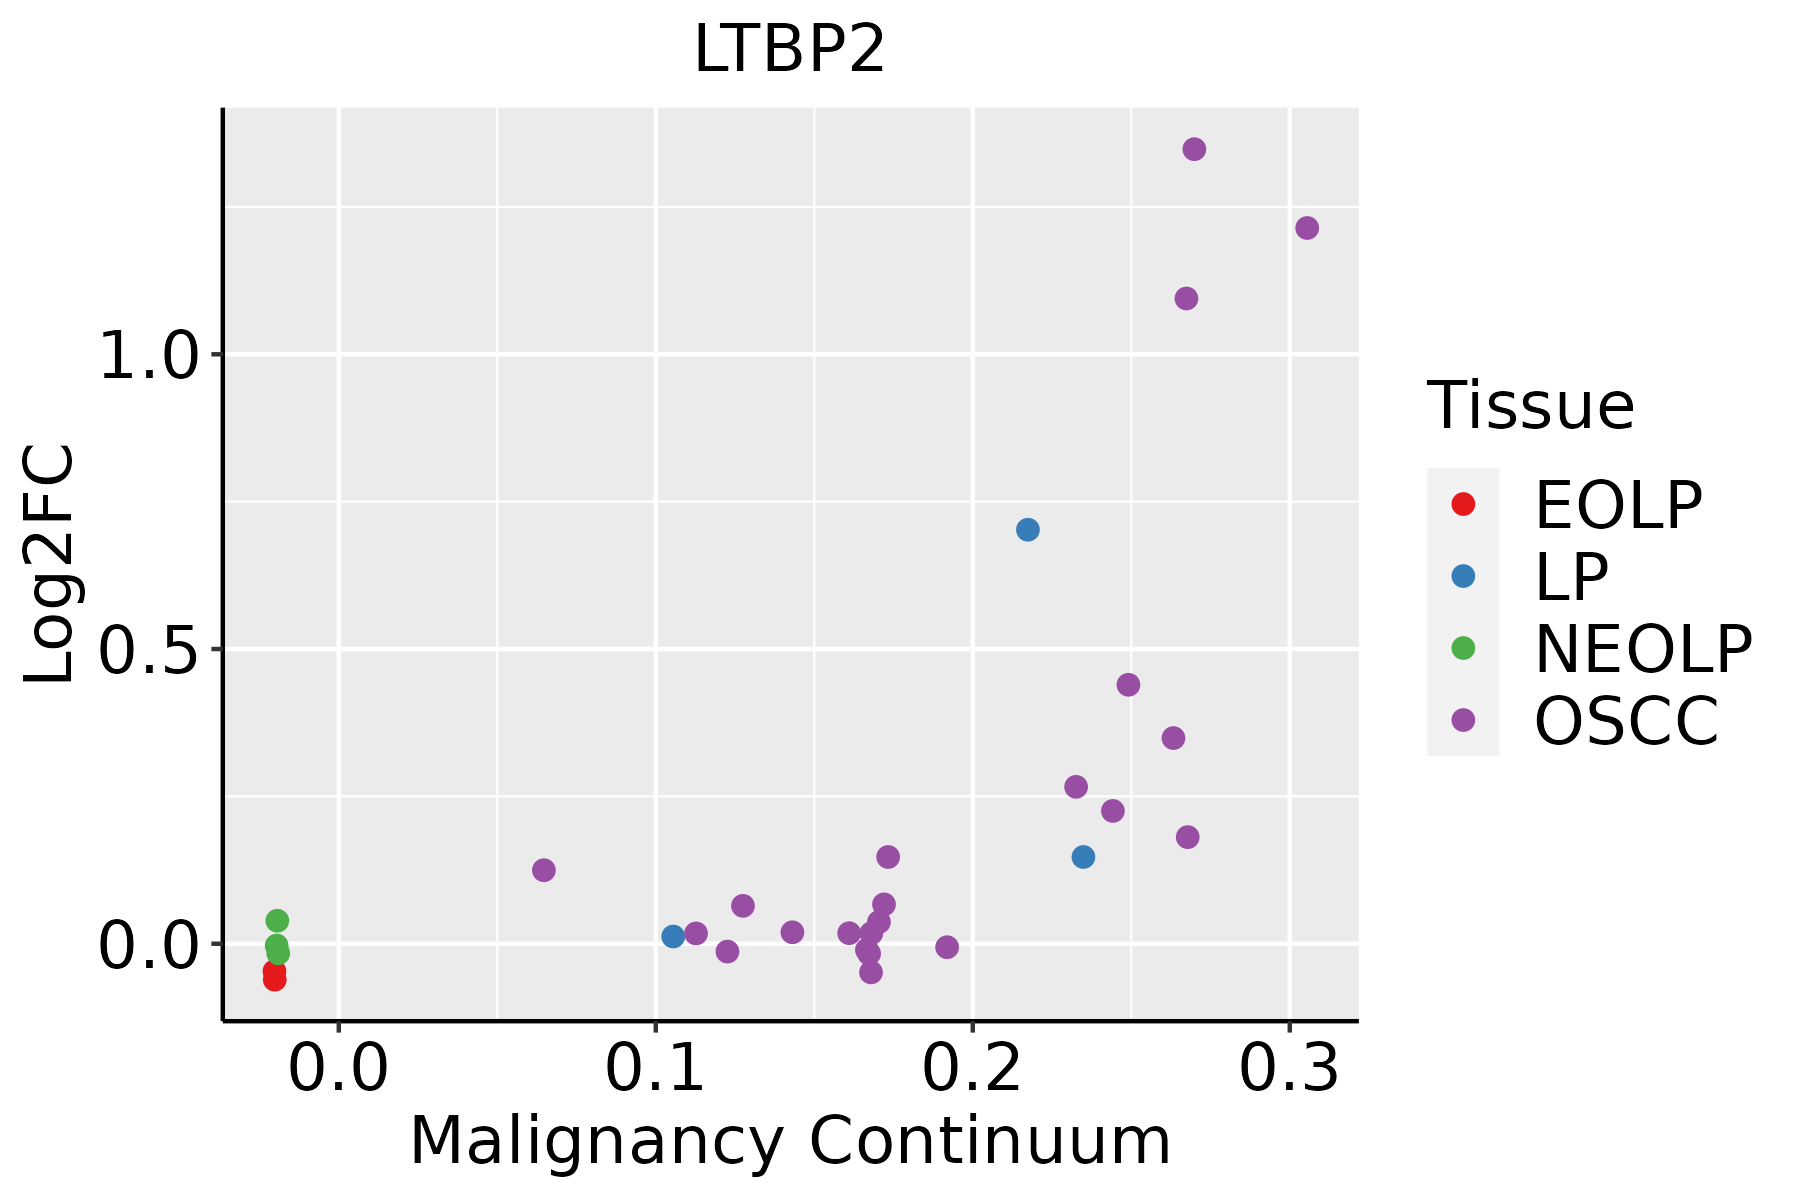
EOLP: Erosive Oral lichen planus
LP: leukoplakia
NEOLP: Non-erosive oral lichen planus
OSCC: Oral squamous cell carcinoma
ProstateThe image shows the transcriptomic changes along malignancy continuum.log2FC in expression of this searched gene in stem-like cells from each diseased tissue sample relative to stem-like cells in normal samples in each tissue plotted against the malignancy continuum. Samples are colored based on if they are from different disease stage.
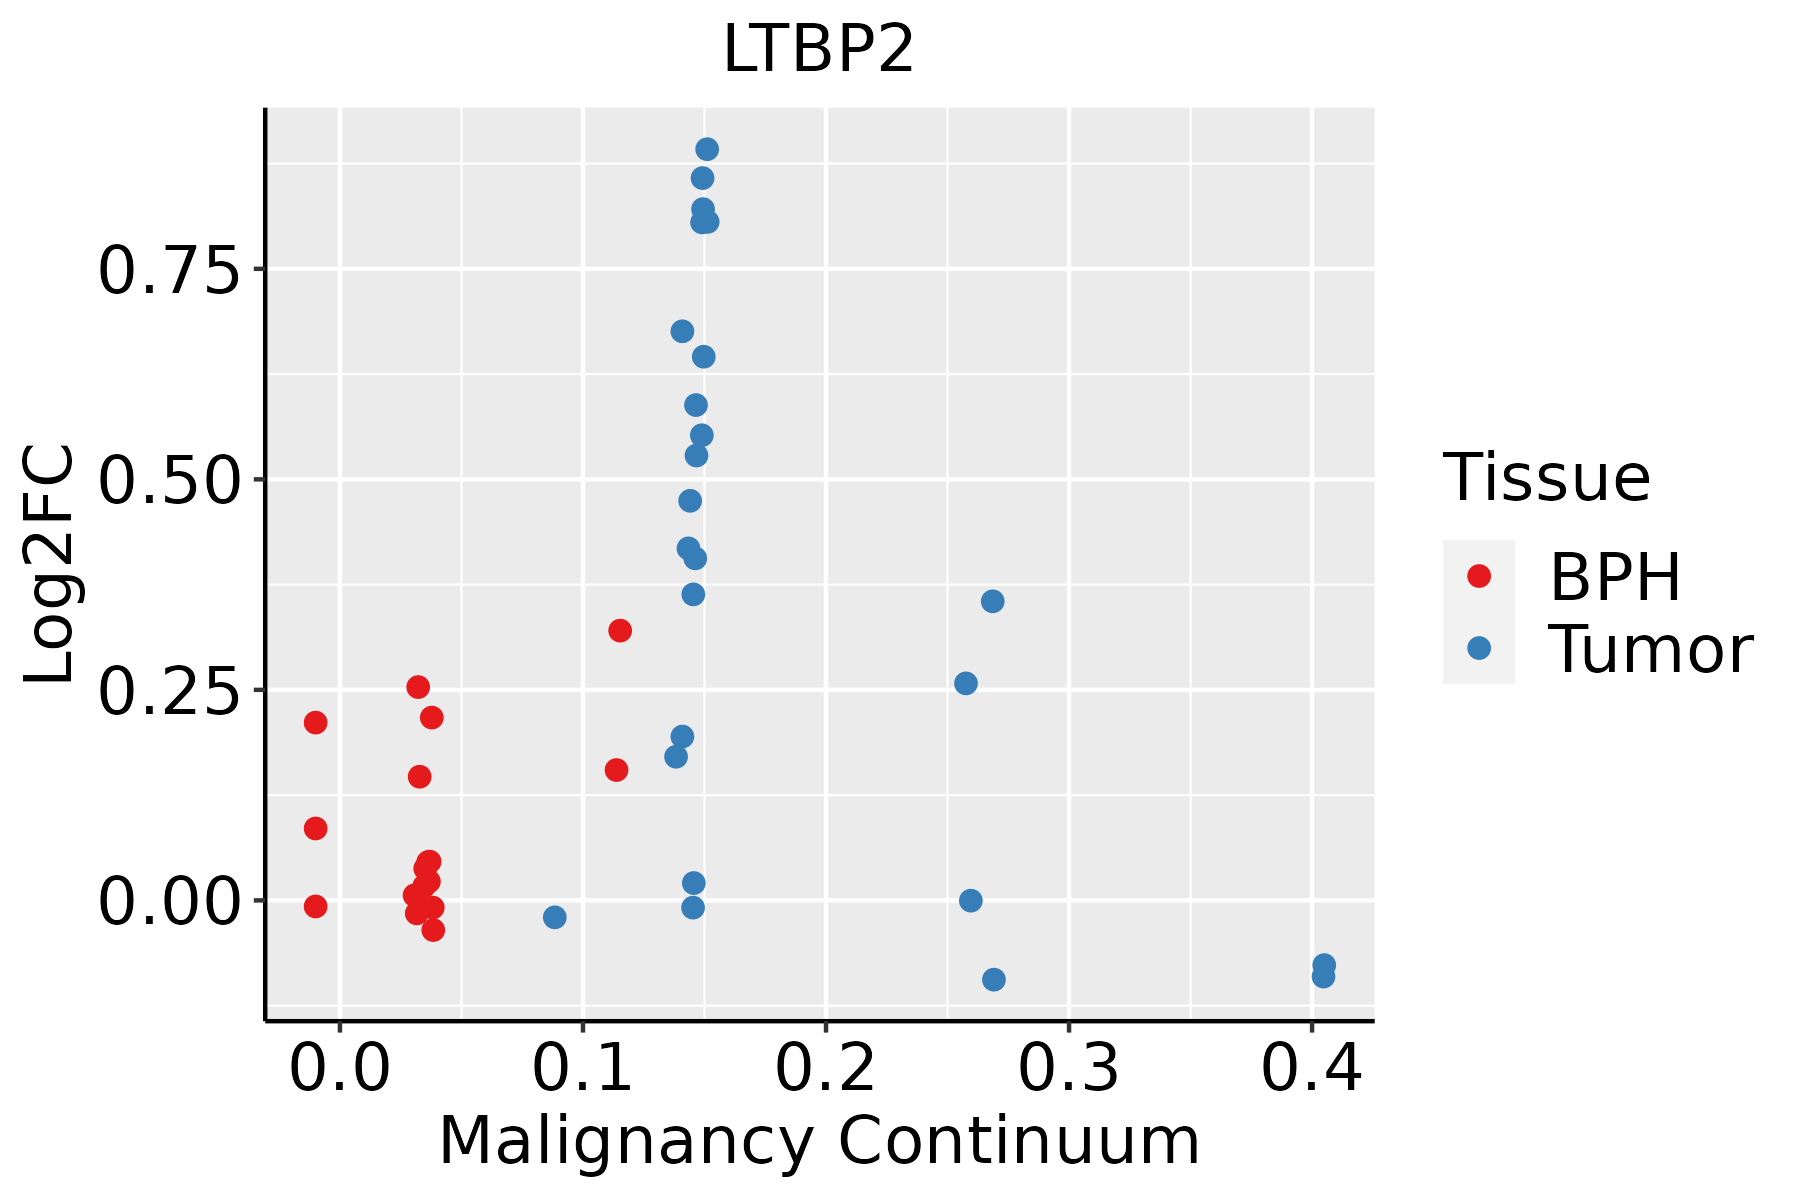
BPH: Benign Prostatic Hyperplasia
ThyroidThe image shows the transcriptomic changes along malignancy continuum.log2FC in expression of this searched gene in stem-like cells from each diseased tissue sample relative to stem-like cells in normal samples in each tissue plotted against the malignancy continuum. Samples are colored based on if they are from different disease stage.
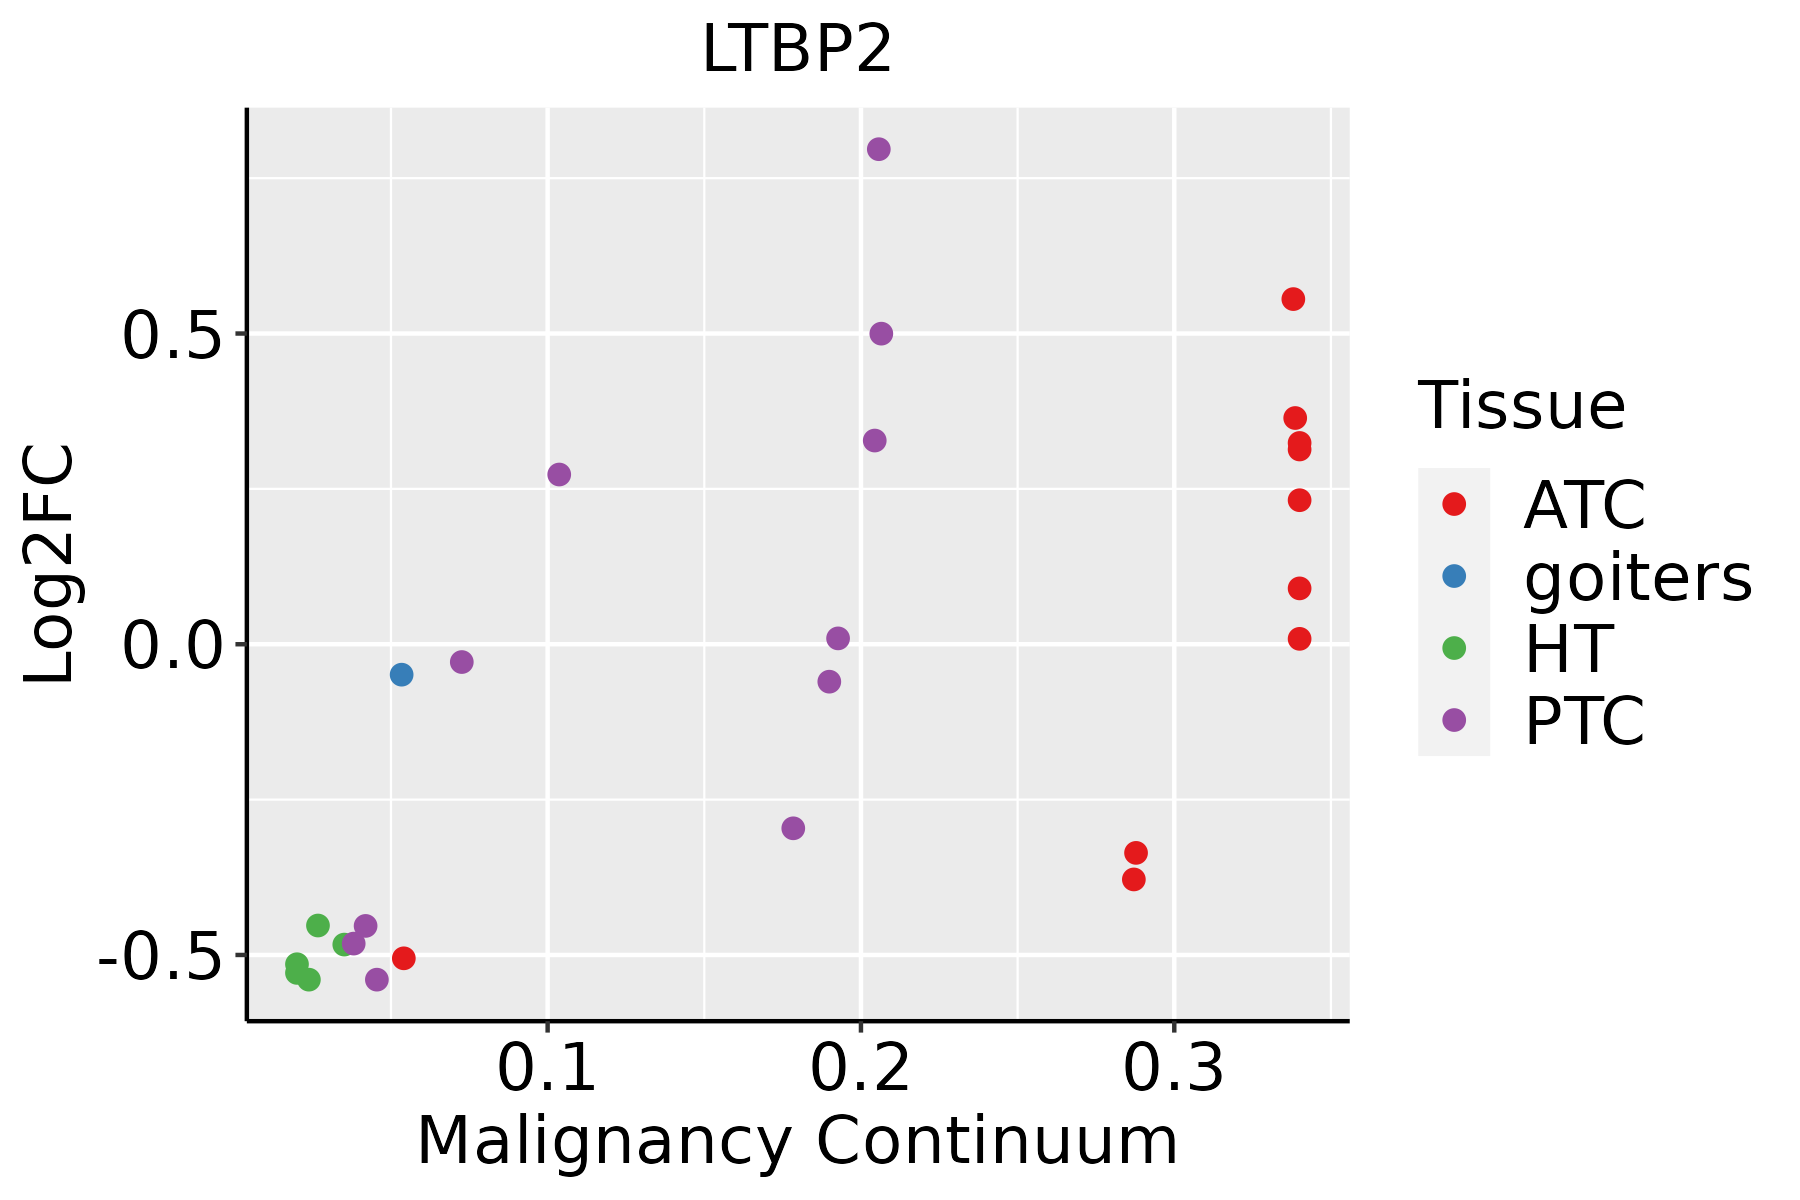
ATC: Anaplastic thyroid cancer
HT: Hashimoto's thyroiditis
PTC: Papillary thyroid cancer
∗log2FC in expression of this searched gene in stem-like cells from each diseased tissue sample relative to stem-like cells in normal samples in each tissue plotted against the malignancy continuum. Samples are colored based on if they are from different disease stage.

Top

Malignant transformation related pathway analysis

check buttonFind out the enriched GO biological processes and KEGG pathways involved in transition from healthy to precancer to cancer
check button Figure of enriched GO biological processes.
TissueDisease StageEnriched GO biological Processes
ColorectumADGO analysis - Figure of enriched GO biological processes: Top 15 enriched GO BP terms are showed in the bar plot of each disease state in each tissue. Each row represents a significant GO biological process which is colored according to the -log10(p.adjust).
ColorectumSERGO analysis - Figure of enriched GO biological processes: Top 15 enriched GO BP terms are showed in the bar plot of each disease state in each tissue. Each row represents a significant GO biological process which is colored according to the -log10(p.adjust).
ColorectumMSSGO analysis - Figure of enriched GO biological processes: Top 15 enriched GO BP terms are showed in the bar plot of each disease state in each tissue. Each row represents a significant GO biological process which is colored according to the -log10(p.adjust).
ColorectumMSI-HGO analysis - Figure of enriched GO biological processes: Top 15 enriched GO BP terms are showed in the bar plot of each disease state in each tissue. Each row represents a significant GO biological process which is colored according to the -log10(p.adjust).
ColorectumFAPGO analysis - Figure of enriched GO biological processes: Top 15 enriched GO BP terms are showed in the bar plot of each disease state in each tissue. Each row represents a significant GO biological process which is colored according to the -log10(p.adjust).
∗Top 15 enriched GO BP terms are showed in the bar plot of each disease state in each tissue. Each row represents a significant GO biological process which is colored according to the -log10(p.adjust).
Page: 1 2 3 4 5 6 7 8 9 

check button Enriched GO biological processes.
GO IDTissueDisease StageDescriptionGene RatioBg Ratiopvaluep.adjustCount
GO:0006605111EsophagusESCCprotein targeting229/8552314/187234.93e-231.01e-20229
GO:00715599EsophagusESCCresponse to transforming growth factor beta157/8552256/187232.95e-074.23e-06157
GO:00715609EsophagusESCCcellular response to transforming growth factor beta stimulus151/8552250/187231.78e-062.10e-05151
GO:00071799EsophagusESCCtransforming growth factor beta receptor signaling pathway121/8552198/187238.26e-068.03e-05121
GO:000717810EsophagusESCCtransmembrane receptor protein serine/threonine kinase signaling pathway195/8552355/187232.58e-041.58e-03195
GO:000930617EsophagusESCCprotein secretion190/8552359/187233.22e-031.34e-02190
GO:003559217EsophagusESCCestablishment of protein localization to extracellular region190/8552360/187233.77e-031.53e-02190
GO:007169210EsophagusESCCprotein localization to extracellular region193/8552368/187235.01e-031.92e-02193
GO:000660520Oral cavityOSCCprotein targeting204/7305314/187236.78e-211.13e-18204
GO:00715598Oral cavityOSCCresponse to transforming growth factor beta140/7305256/187232.34e-073.70e-06140
GO:00715608Oral cavityOSCCcellular response to transforming growth factor beta stimulus137/7305250/187232.68e-074.15e-06137
GO:00071798Oral cavityOSCCtransforming growth factor beta receptor signaling pathway109/7305198/187233.21e-063.86e-05109
GO:000930610Oral cavityOSCCprotein secretion169/7305359/187231.04e-035.34e-03169
GO:003559210Oral cavityOSCCestablishment of protein localization to extracellular region169/7305360/187231.21e-036.08e-03169
GO:00716929Oral cavityOSCCprotein localization to extracellular region172/7305368/187231.40e-036.79e-03172
GO:00071789Oral cavityOSCCtransmembrane receptor protein serine/threonine kinase signaling pathway165/7305355/187232.31e-031.02e-02165
GO:000660518ProstateBPHprotein targeting102/3107314/187232.51e-122.05e-10102
GO:00715597ProstateBPHresponse to transforming growth factor beta76/3107256/187231.14e-072.73e-0676
GO:00715607ProstateBPHcellular response to transforming growth factor beta stimulus72/3107250/187238.71e-071.61e-0572
GO:00071797ProstateBPHtransforming growth factor beta receptor signaling pathway57/3107198/187231.17e-051.58e-0457
Page: 1 2 3 

check button Enriched KEGG pathways.
Pathway IDTissueDisease StageDescriptionGene RatioBg Ratiopvaluep.adjustqvalueCount
Page: 1 

Top

Cell-cell communication analysis

check buttonIdentification of potential cell-cell interactions between two cell types and their ligand-receptor pairs for different disease states
LigandReceptorLRpairPathwayTissueDisease Stage
Page: 1 

Top

Single-cell gene regulatory network inference analysis

check buttonFind out the significant the regulons (TFs) and the target genes of each regulon across cell types for different disease states
TFCell TypeTissueDisease StageTarget GeneRSSRegulon Activity
∗The dot plots of a searched regulon are shown for all cell subpopulations in each disease state of each tissue based on the regulon specific score inferred using pySCENIC and by calculating the average expression.
Page: 1 

Top

Somatic mutation of malignant transformation related genes

check buttonAnnotation of somatic variants for genes involved in malignant transformation
Hugo SymbolVariant ClassVariant ClassificationdbSNP RSHGVScHGVSpHGVSp ShortSWISSPROTBIOTYPESIFTPolyPhenTumor Sample BarcodeTissueHistologySexAgeStageTherapy TypesDrugsOutcome
LTBP2SNVMissense_Mutationrs778443565c.4160G>Ap.Arg1387Hisp.R1387HQ14767protein_codingtolerated(0.06)benign(0.009)TCGA-A2-A0CT-01Breastbreast invasive carcinomaFemale>=65I/IIChemotherapycytoxanSD
LTBP2SNVMissense_Mutationrs144907368c.2714N>Ap.Arg905Hisp.R905HQ14767protein_codingtolerated(0.15)possibly_damaging(0.839)TCGA-A2-A3KD-01Breastbreast invasive carcinomaFemale<65III/IVChemotherapytaxotereSD
LTBP2SNVMissense_Mutationnovelc.4382A>Gp.Glu1461Glyp.E1461GQ14767protein_codingdeleterious(0)possibly_damaging(0.727)TCGA-A8-A09A-01Breastbreast invasive carcinomaFemale<65I/IIHormone TherapytamoxiphenSD
LTBP2SNVMissense_Mutationc.2606N>Cp.Arg869Thrp.R869TQ14767protein_codingtolerated(1)benign(0.003)TCGA-AC-A23H-01Breastbreast invasive carcinomaFemale>=65I/IIUnknownUnknownPD
LTBP2SNVMissense_Mutationc.1265N>Tp.Ser422Phep.S422FQ14767protein_codingdeleterious(0)probably_damaging(0.996)TCGA-AC-A23H-01Breastbreast invasive carcinomaFemale>=65I/IIUnknownUnknownPD
LTBP2SNVMissense_Mutationrs137854858c.1484N>Ap.Arg495Glnp.R495QQ14767protein_codingtolerated(0.37)possibly_damaging(0.849)TCGA-BH-A0BR-01Breastbreast invasive carcinomaFemale<65I/IIUnknownUnknownSD
LTBP2SNVMissense_Mutationc.2105N>Ap.Gly702Aspp.G702DQ14767protein_codingdeleterious(0)possibly_damaging(0.885)TCGA-D8-A1XG-01Breastbreast invasive carcinomaFemale>=65III/IVUnknownUnknownSD
LTBP2SNVMissense_Mutationc.3664N>Cp.Cys1222Argp.C1222RQ14767protein_codingdeleterious(0)probably_damaging(0.999)TCGA-D8-A1XK-01Breastbreast invasive carcinomaFemale<65I/IIChemotherapydoxorubicine+cyclophosphamideSD
LTBP2SNVMissense_Mutationnovelc.3204N>Ap.Asn1068Lysp.N1068KQ14767protein_codingdeleterious(0)possibly_damaging(0.735)TCGA-PL-A8LZ-01Breastbreast invasive carcinomaFemale<65III/IVChemotherapypaclitaxelSD
LTBP2insertionIn_Frame_Insnovelc.751_752insGCCTGTGCTCTGGATTTCTCTACAGCCp.Ala251delinsGlyLeuCysSerGlyPheLeuTyrSerProp.A251delinsGLCSGFLYSPQ14767protein_codingTCGA-B6-A0I8-01Breastbreast invasive carcinomaFemale<65I/IIUnknownUnknownPD
Page: 1 2 3 4 5 6 7 8 9 10 11 12 13 14 15 16 17 18 19 20 21 22 

Top

Related drugs of malignant transformation related genes

check buttonIdentification of chemicals and drugs interact with genes involved in malignant transfromation
(DGIdb 4.0)
Entrez IDSymbolCategoryInteraction TypesDrug Claim NameDrug NamePMIDs
Page: 1