
|
|||||
|
 | |
| |
| |
| |
| |
| |
|
Gene: LTB4R2 |
Gene summary for LTB4R2 |
| Gene information | Species | Human | Gene symbol | LTB4R2 | Gene ID | 56413 |
| Gene name | leukotriene B4 receptor 2 | |
| Gene Alias | BLT2 | |
| Cytomap | 14q12 | |
| Gene Type | protein-coding | GO ID | GO:0001667 | UniProtAcc | B4E292 |
Top |
Malignant transformation analysis |
| Identification of the aberrant gene expression in precancerous and cancerous lesions by comparing the gene expression of stem-like cells in diseased tissues with normal stem cells |
| Entrez ID | Symbol | Replicates | Species | Organ | Tissue | Adj P-value | Log2FC | Malignancy |
| 56413 | LTB4R2 | LZE4T | Human | Esophagus | ESCC | 2.19e-03 | 1.84e-01 | 0.0811 |
| 56413 | LTB4R2 | P2T-E | Human | Esophagus | ESCC | 1.55e-10 | 1.75e-01 | 0.1177 |
| 56413 | LTB4R2 | P4T-E | Human | Esophagus | ESCC | 9.93e-08 | 2.40e-01 | 0.1323 |
| 56413 | LTB4R2 | P5T-E | Human | Esophagus | ESCC | 5.01e-16 | 3.11e-01 | 0.1327 |
| 56413 | LTB4R2 | P9T-E | Human | Esophagus | ESCC | 5.63e-15 | 3.76e-01 | 0.1131 |
| 56413 | LTB4R2 | P10T-E | Human | Esophagus | ESCC | 1.22e-22 | 4.49e-01 | 0.116 |
| 56413 | LTB4R2 | P11T-E | Human | Esophagus | ESCC | 8.87e-09 | 4.70e-01 | 0.1426 |
| 56413 | LTB4R2 | P12T-E | Human | Esophagus | ESCC | 8.69e-03 | 1.73e-01 | 0.1122 |
| 56413 | LTB4R2 | P15T-E | Human | Esophagus | ESCC | 2.87e-47 | 1.19e+00 | 0.1149 |
| 56413 | LTB4R2 | P16T-E | Human | Esophagus | ESCC | 1.83e-06 | 1.57e-01 | 0.1153 |
| 56413 | LTB4R2 | P20T-E | Human | Esophagus | ESCC | 1.34e-22 | 4.40e-01 | 0.1124 |
| 56413 | LTB4R2 | P21T-E | Human | Esophagus | ESCC | 4.18e-21 | 4.11e-01 | 0.1617 |
| 56413 | LTB4R2 | P22T-E | Human | Esophagus | ESCC | 5.75e-10 | 2.45e-01 | 0.1236 |
| 56413 | LTB4R2 | P23T-E | Human | Esophagus | ESCC | 2.18e-08 | 3.41e-01 | 0.108 |
| 56413 | LTB4R2 | P24T-E | Human | Esophagus | ESCC | 7.74e-04 | 1.80e-01 | 0.1287 |
| 56413 | LTB4R2 | P26T-E | Human | Esophagus | ESCC | 5.12e-41 | 7.83e-01 | 0.1276 |
| 56413 | LTB4R2 | P27T-E | Human | Esophagus | ESCC | 5.19e-41 | 8.19e-01 | 0.1055 |
| 56413 | LTB4R2 | P28T-E | Human | Esophagus | ESCC | 3.09e-34 | 6.66e-01 | 0.1149 |
| 56413 | LTB4R2 | P30T-E | Human | Esophagus | ESCC | 1.69e-30 | 9.92e-01 | 0.137 |
| 56413 | LTB4R2 | P31T-E | Human | Esophagus | ESCC | 8.91e-48 | 8.17e-01 | 0.1251 |
| Page: 1 2 3 4 |
| Tissue | Expression Dynamics | Abbreviation |
| Esophagus |  | ESCC: Esophageal squamous cell carcinoma |
| HGIN: High-grade intraepithelial neoplasias | ||
| LGIN: Low-grade intraepithelial neoplasias | ||
| Oral Cavity | 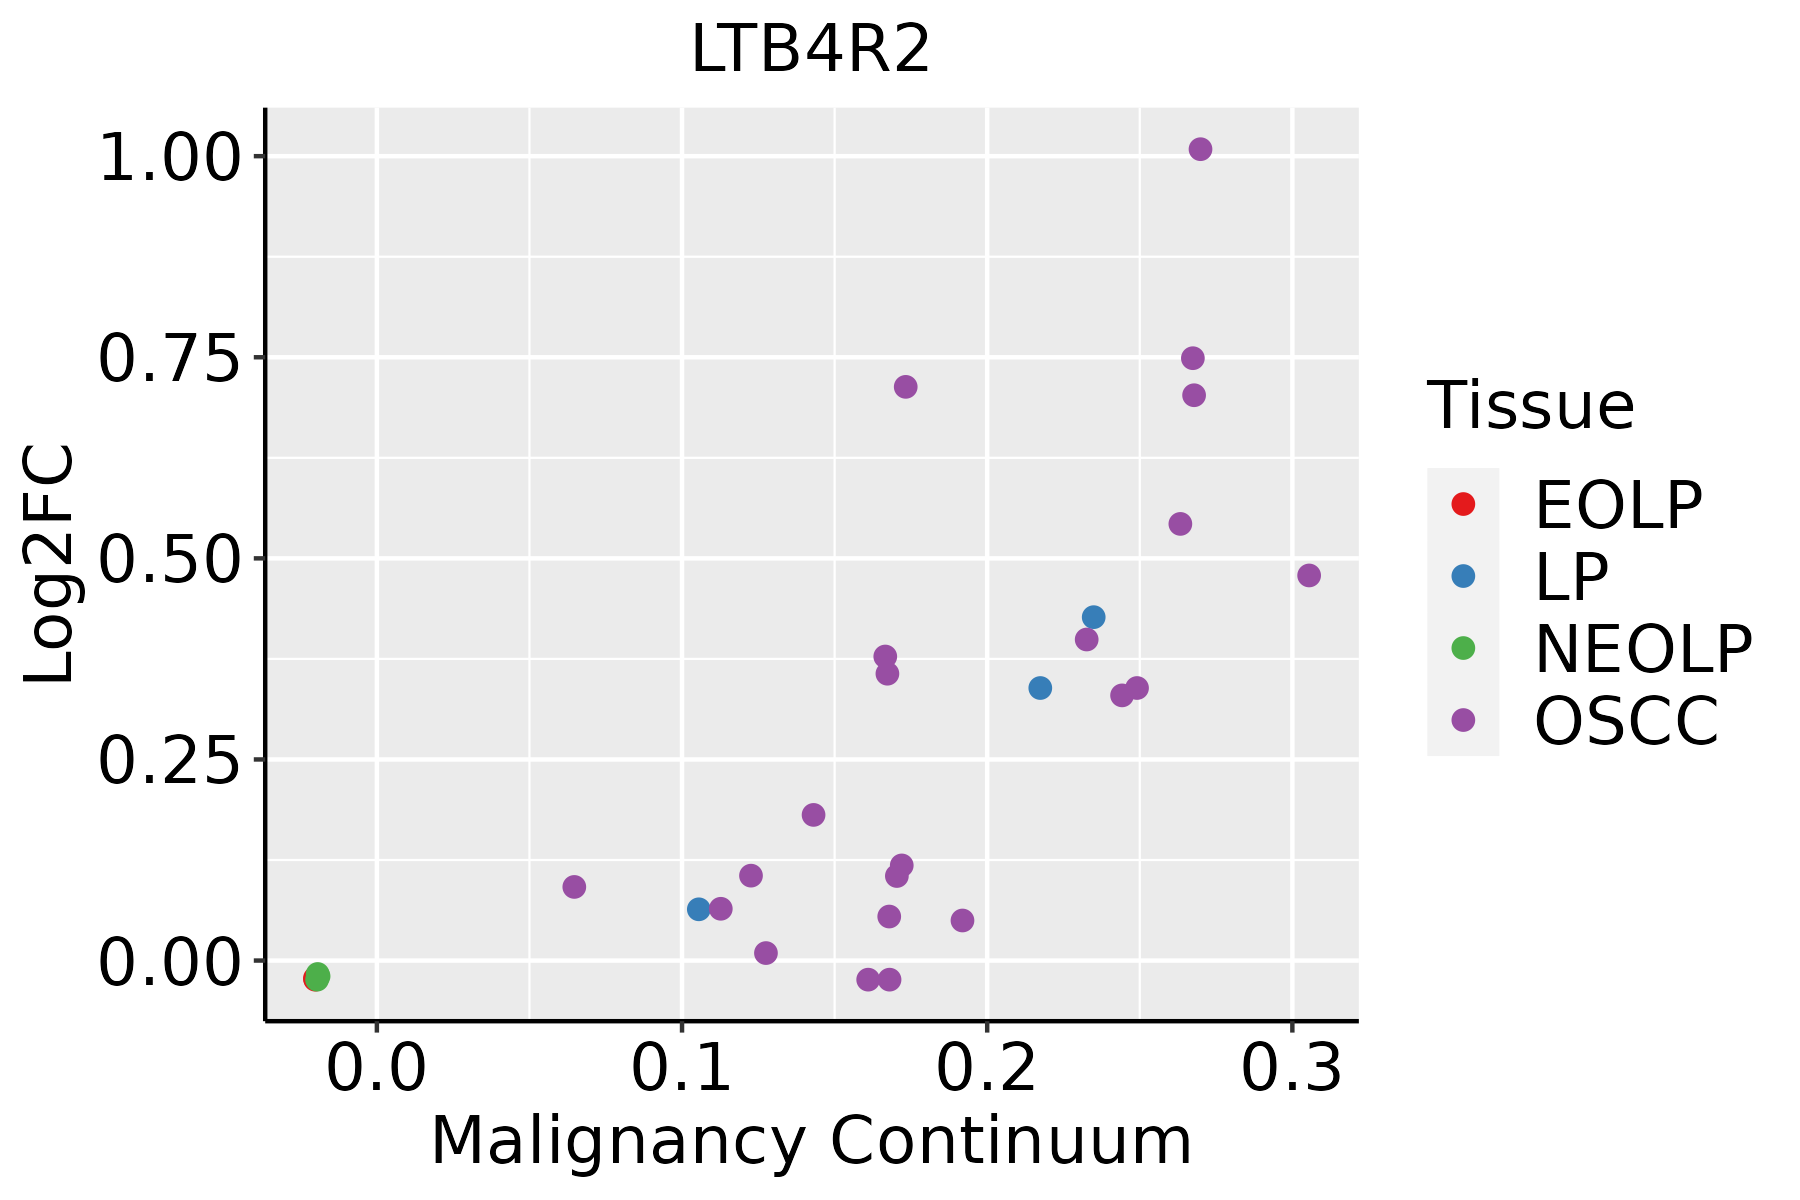 | EOLP: Erosive Oral lichen planus |
| LP: leukoplakia | ||
| NEOLP: Non-erosive oral lichen planus | ||
| OSCC: Oral squamous cell carcinoma |
| ∗log2FC in expression of this searched gene in stem-like cells from each diseased tissue sample relative to stem-like cells in normal samples in each tissue plotted against the malignancy continuum. Samples are colored based on if they are from different disease stage. |
Top |
Malignant transformation related pathway analysis |
| Find out the enriched GO biological processes and KEGG pathways involved in transition from healthy to precancer to cancer |
| Tissue | Disease Stage | Enriched GO biological Processes |
| Colorectum | AD |  |
| Colorectum | SER |  |
| Colorectum | MSS |  |
| Colorectum | MSI-H |  |
| Colorectum | FAP |  |
| ∗Top 15 enriched GO BP terms are showed in the bar plot of each disease state in each tissue. Each row represents a significant GO biological process which is colored according to the -log10(p.adjust). |
| Page: 1 2 3 4 5 6 7 8 9 |
| GO ID | Tissue | Disease Stage | Description | Gene Ratio | Bg Ratio | pvalue | p.adjust | Count |
| GO:000166720 | Esophagus | ESCC | ameboidal-type cell migration | 250/8552 | 475/18723 | 1.22e-03 | 5.97e-03 | 250 |
| GO:001063120 | Esophagus | ESCC | epithelial cell migration | 187/8552 | 357/18723 | 6.05e-03 | 2.23e-02 | 187 |
| GO:009013220 | Esophagus | ESCC | epithelium migration | 188/8552 | 360/18723 | 6.96e-03 | 2.54e-02 | 188 |
| GO:009013020 | Esophagus | ESCC | tissue migration | 190/8552 | 365/18723 | 7.91e-03 | 2.82e-02 | 190 |
| GO:000166719 | Oral cavity | OSCC | ameboidal-type cell migration | 228/7305 | 475/18723 | 3.46e-05 | 3.10e-04 | 228 |
| GO:001063118 | Oral cavity | OSCC | epithelial cell migration | 174/7305 | 357/18723 | 1.04e-04 | 7.70e-04 | 174 |
| GO:009013218 | Oral cavity | OSCC | epithelium migration | 175/7305 | 360/18723 | 1.18e-04 | 8.54e-04 | 175 |
| GO:009013018 | Oral cavity | OSCC | tissue migration | 176/7305 | 365/18723 | 1.92e-04 | 1.29e-03 | 176 |
| Page: 1 |
| Pathway ID | Tissue | Disease Stage | Description | Gene Ratio | Bg Ratio | pvalue | p.adjust | qvalue | Count |
| Page: 1 |
Top |
Cell-cell communication analysis |
| Identification of potential cell-cell interactions between two cell types and their ligand-receptor pairs for different disease states |
| Ligand | Receptor | LRpair | Pathway | Tissue | Disease Stage |
| Page: 1 |
Top |
Single-cell gene regulatory network inference analysis |
| Find out the significant the regulons (TFs) and the target genes of each regulon across cell types for different disease states |
| TF | Cell Type | Tissue | Disease Stage | Target Gene | RSS | Regulon Activity |
| ∗The dot plots of a searched regulon are shown for all cell subpopulations in each disease state of each tissue based on the regulon specific score inferred using pySCENIC and by calculating the average expression. |
| Page: 1 |
Top |
Somatic mutation of malignant transformation related genes |
| Annotation of somatic variants for genes involved in malignant transformation |
| Hugo Symbol | Variant Class | Variant Classification | dbSNP RS | HGVSc | HGVSp | HGVSp Short | SWISSPROT | BIOTYPE | SIFT | PolyPhen | Tumor Sample Barcode | Tissue | Histology | Sex | Age | Stage | Therapy Types | Drugs | Outcome |
| LTB4R2 | SNV | Missense_Mutation | novel | c.944N>A | p.Arg315Gln | p.R315Q | Q9NPC1 | protein_coding | tolerated(0.7) | benign(0.012) | TCGA-A2-A0EY-01 | Breast | breast invasive carcinoma | Female | <65 | I/II | Chemotherapy | adriamycin | SD |
| LTB4R2 | SNV | Missense_Mutation | novel | c.68N>A | p.Gly23Asp | p.G23D | Q9NPC1 | protein_coding | deleterious(0) | probably_damaging(0.989) | TCGA-2W-A8YY-01 | Cervix | cervical & endocervical cancer | Female | <65 | I/II | Chemotherapy | cisplatin | CR |
| LTB4R2 | SNV | Missense_Mutation | novel | c.538G>A | p.Ala180Thr | p.A180T | Q9NPC1 | protein_coding | tolerated(0.11) | benign(0.098) | TCGA-AA-3947-01 | Colorectum | colon adenocarcinoma | Female | <65 | I/II | Unknown | Unknown | SD |
| LTB4R2 | SNV | Missense_Mutation | c.1072N>A | p.Leu358Ile | p.L358I | Q9NPC1 | protein_coding | deleterious_low_confidence(0) | benign(0.011) | TCGA-AP-A059-01 | Endometrium | uterine corpus endometrioid carcinoma | Female | >=65 | I/II | Unknown | Unknown | SD | |
| LTB4R2 | SNV | Missense_Mutation | novel | c.73G>A | p.Ala25Thr | p.A25T | Q9NPC1 | protein_coding | tolerated(0.18) | benign(0.003) | TCGA-AP-A1DK-01 | Endometrium | uterine corpus endometrioid carcinoma | Female | <65 | I/II | Unknown | Unknown | SD |
| LTB4R2 | SNV | Missense_Mutation | c.883N>A | p.Leu295Met | p.L295M | Q9NPC1 | protein_coding | deleterious(0.04) | benign(0.332) | TCGA-D1-A103-01 | Endometrium | uterine corpus endometrioid carcinoma | Female | >=65 | I/II | Unknown | Unknown | SD | |
| LTB4R2 | SNV | Missense_Mutation | c.889N>G | p.Pro297Ala | p.P297A | Q9NPC1 | protein_coding | tolerated(0.09) | benign(0.028) | TCGA-D1-A160-01 | Endometrium | uterine corpus endometrioid carcinoma | Female | >=65 | I/II | Unknown | Unknown | SD | |
| LTB4R2 | SNV | Missense_Mutation | novel | c.115N>T | p.Gly39Cys | p.G39C | Q9NPC1 | protein_coding | tolerated(0.19) | benign(0.054) | TCGA-DF-A2KU-01 | Endometrium | uterine corpus endometrioid carcinoma | Female | Unknown | I/II | Unknown | Unknown | SD |
| LTB4R2 | SNV | Missense_Mutation | novel | c.251N>A | p.Arg84Gln | p.R84Q | Q9NPC1 | protein_coding | tolerated(0.3) | benign(0.003) | TCGA-49-4490-01 | Lung | lung adenocarcinoma | Female | <65 | III/IV | Chemotherapy | cisplatin | PD |
| LTB4R2 | SNV | Missense_Mutation | rs747402319 | c.1018N>T | p.Arg340Cys | p.R340C | Q9NPC1 | protein_coding | tolerated(0.2) | benign(0.17) | TCGA-22-4604-01 | Lung | lung squamous cell carcinoma | Male | >=65 | I/II | Targeted Molecular therapy | iressa | PD |
| Page: 1 2 |
Top |
Related drugs of malignant transformation related genes |
| Identification of chemicals and drugs interact with genes involved in malignant transfromation |
| (DGIdb 4.0) |
| Entrez ID | Symbol | Category | Interaction Types | Drug Claim Name | Drug Name | PMIDs |
| 56413 | LTB4R2 | G PROTEIN COUPLED RECEPTOR, DRUGGABLE GENOME | antagonist | 178100381 | ||
| 56413 | LTB4R2 | G PROTEIN COUPLED RECEPTOR, DRUGGABLE GENOME | antagonist | 178102783 | ||
| 56413 | LTB4R2 | G PROTEIN COUPLED RECEPTOR, DRUGGABLE GENOME | agonist | 135651378 | ||
| 56413 | LTB4R2 | G PROTEIN COUPLED RECEPTOR, DRUGGABLE GENOME | Biomed 101 | |||
| 56413 | LTB4R2 | G PROTEIN COUPLED RECEPTOR, DRUGGABLE GENOME | LTB4 | |||
| 56413 | LTB4R2 | G PROTEIN COUPLED RECEPTOR, DRUGGABLE GENOME | agonist,antagonist | 178102776 | CP-195543 | |
| 56413 | LTB4R2 | G PROTEIN COUPLED RECEPTOR, DRUGGABLE GENOME | agonist | 178102780 | ||
| 56413 | LTB4R2 | G PROTEIN COUPLED RECEPTOR, DRUGGABLE GENOME | agonist | 53801088 | ||
| 56413 | LTB4R2 | G PROTEIN COUPLED RECEPTOR, DRUGGABLE GENOME | agonist | 135651372 | ||
| 56413 | LTB4R2 | G PROTEIN COUPLED RECEPTOR, DRUGGABLE GENOME | agonist | 178102781 |
| Page: 1 2 |

Copyright 2023-Present -The University of Texas Health Science Center at Houston |