Schematic overview of the cellular and molecular mechanisms involved in the cancer progression, including the proposed cellular and molecular mechanisms in cancer cells trajectory. AT1: alveolar type 1 cells; AT2: alveolar type 2 cells; AAH: atypical adenomatous hyperplasia; AIS: adenocarcinoma in situ; MIA: minimally invasive adenocarcinoma; IA: invasive adenocarcinoma; EMT: epithelial-mesenchymal transition

Home

Download

Statistics

Help

Contact

Center for Computational Systems Medicine
leaf

Gene summary

leaf

Malignant transformation analysis

leaf

Malignant transformation related pathway analysis

leaf

Cell-cell communication analysis

leaf

Single-cell gene regulatory network inference analysis

leaf

Somatic mutation of malignant transformation related genes

leaf

Related drugs of malignant transformation related genes

Gene: LTA4H

Gene summary for LTA4H

check button Gene summary.

Gene informationSpeciesHuman
Gene symbol

LTA4H

Gene ID

4048

Gene nameleukotriene A4 hydrolase
Gene AliasLTA4H
Cytomap12q23.1
Gene Typeprotein-coding
GO ID

GO:0006082

UniProtAcc

A0A140VK27


Top

Malignant transformation analysis

check button Identification of the aberrant gene expression in precancerous and cancerous lesions by comparing the gene expression of stem-like cells in diseased tissues with normal stem cells
check button Malignant transformation involving gene list.
Entrez IDSymbolReplicatesSpeciesOrganTissueAdj P-valueLog2FCMalignancy
4048LTA4HHTA11_3410_2000001011HumanColorectumAD1.37e-022.21e-010.0155
4048LTA4HHTA11_1938_2000001011HumanColorectumAD3.26e-096.42e-01-0.0811
4048LTA4HHTA11_78_2000001011HumanColorectumAD1.48e-146.95e-01-0.1088
4048LTA4HHTA11_347_2000001011HumanColorectumAD4.06e-145.47e-01-0.1954
4048LTA4HHTA11_83_2000001011HumanColorectumSER4.42e-045.53e-01-0.1526
4048LTA4HHTA11_1391_2000001011HumanColorectumAD1.67e-106.43e-01-0.059
4048LTA4HHTA11_7862_2000001011HumanColorectumAD4.72e-056.05e-01-0.0179
4048LTA4HHTA11_866_3004761011HumanColorectumAD2.74e-054.25e-010.096
4048LTA4HHTA11_4255_2000001011HumanColorectumSER1.05e-026.46e-010.0446
4048LTA4HHTA11_8622_2000001021HumanColorectumSER4.57e-045.12e-010.0528
4048LTA4HHTA11_7663_2000001011HumanColorectumSER4.86e-025.15e-010.0131
4048LTA4HHTA11_6801_2000001011HumanColorectumSER3.55e-025.91e-010.0171
4048LTA4HHTA11_7696_3000711011HumanColorectumAD5.74e-054.67e-010.0674
4048LTA4HHTA11_99999970781_79442HumanColorectumMSS1.11e-218.15e-010.294
4048LTA4HHTA11_99999965062_69753HumanColorectumMSI-H4.99e-071.35e+000.3487
4048LTA4HHTA11_99999965104_69814HumanColorectumMSS7.28e-137.31e-010.281
4048LTA4HHTA11_99999971662_82457HumanColorectumMSS8.87e-321.06e+000.3859
4048LTA4HA015-C-203HumanColorectumFAP1.97e-04-1.94e-02-0.1294
4048LTA4HA001-C-108HumanColorectumFAP6.16e-03-8.31e-02-0.0272
4048LTA4HA002-C-205HumanColorectumFAP4.44e-02-1.40e-01-0.1236
Page: 1 2 3 4 5 6 7 

check button Transcriptomic changes along malignancy continuum.
TissueExpression DynamicsAbbreviation
Colorectum (GSE201348)The image shows the transcriptomic changes along malignancy continuum.log2FC in expression of this searched gene in stem-like cells from each diseased tissue sample relative to stem-like cells in normal samples in each tissue plotted against the malignancy continuum. Samples are colored based on if they are from different disease stage.FAP: Familial adenomatous polyposis
CRC: Colorectal cancer
Colorectum (HTA11)The image shows the transcriptomic changes along malignancy continuum.log2FC in expression of this searched gene in stem-like cells from each diseased tissue sample relative to stem-like cells in normal samples in each tissue plotted against the malignancy continuum. Samples are colored based on if they are from different disease stage.AD: Adenomas
SER: Sessile serrated lesions
MSI-H: Microsatellite-high colorectal cancer
MSS: Microsatellite stable colorectal cancer
EsophagusThe image shows the transcriptomic changes along malignancy continuum.log2FC in expression of this searched gene in stem-like cells from each diseased tissue sample relative to stem-like cells in normal samples in each tissue plotted against the malignancy continuum. Samples are colored based on if they are from different disease stage.
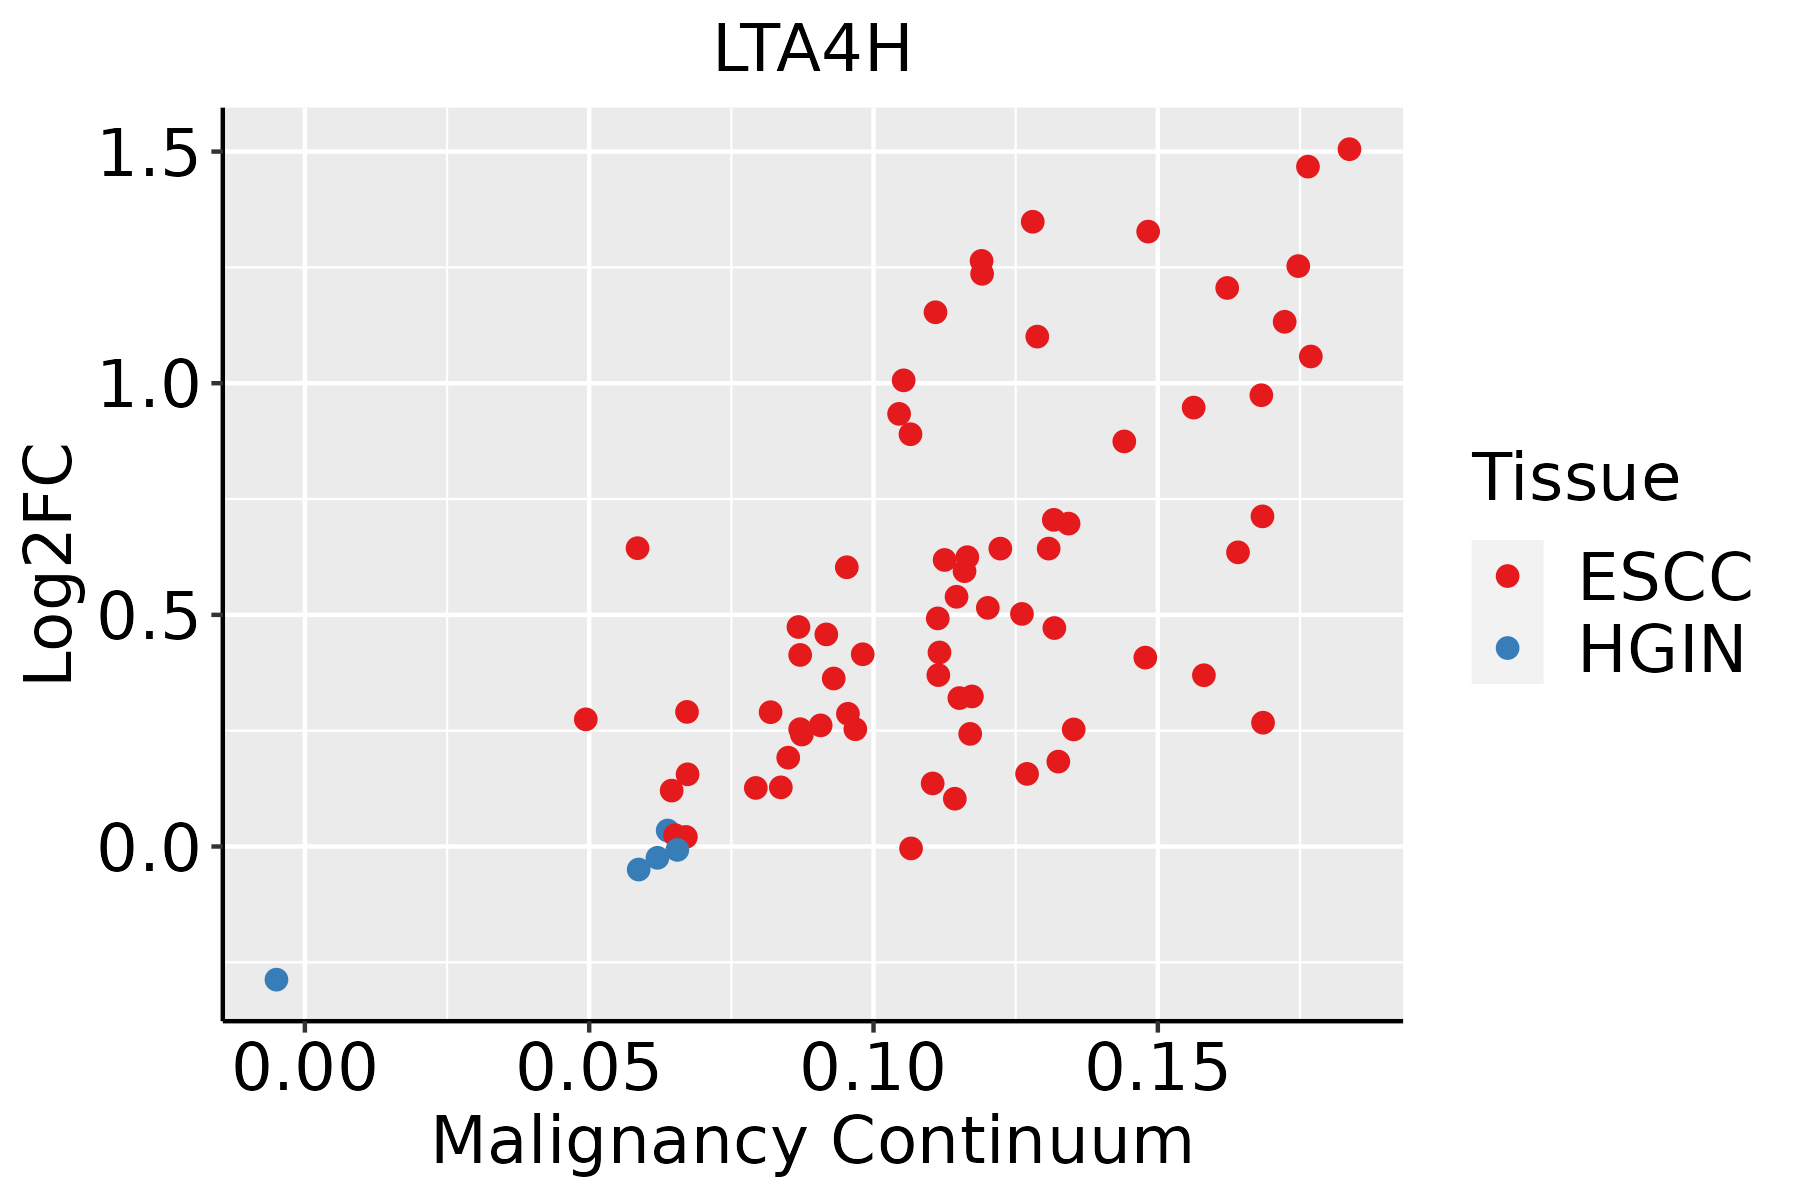
ESCC: Esophageal squamous cell carcinoma
HGIN: High-grade intraepithelial neoplasias
LGIN: Low-grade intraepithelial neoplasias
LiverThe image shows the transcriptomic changes along malignancy continuum.log2FC in expression of this searched gene in stem-like cells from each diseased tissue sample relative to stem-like cells in normal samples in each tissue plotted against the malignancy continuum. Samples are colored based on if they are from different disease stage.
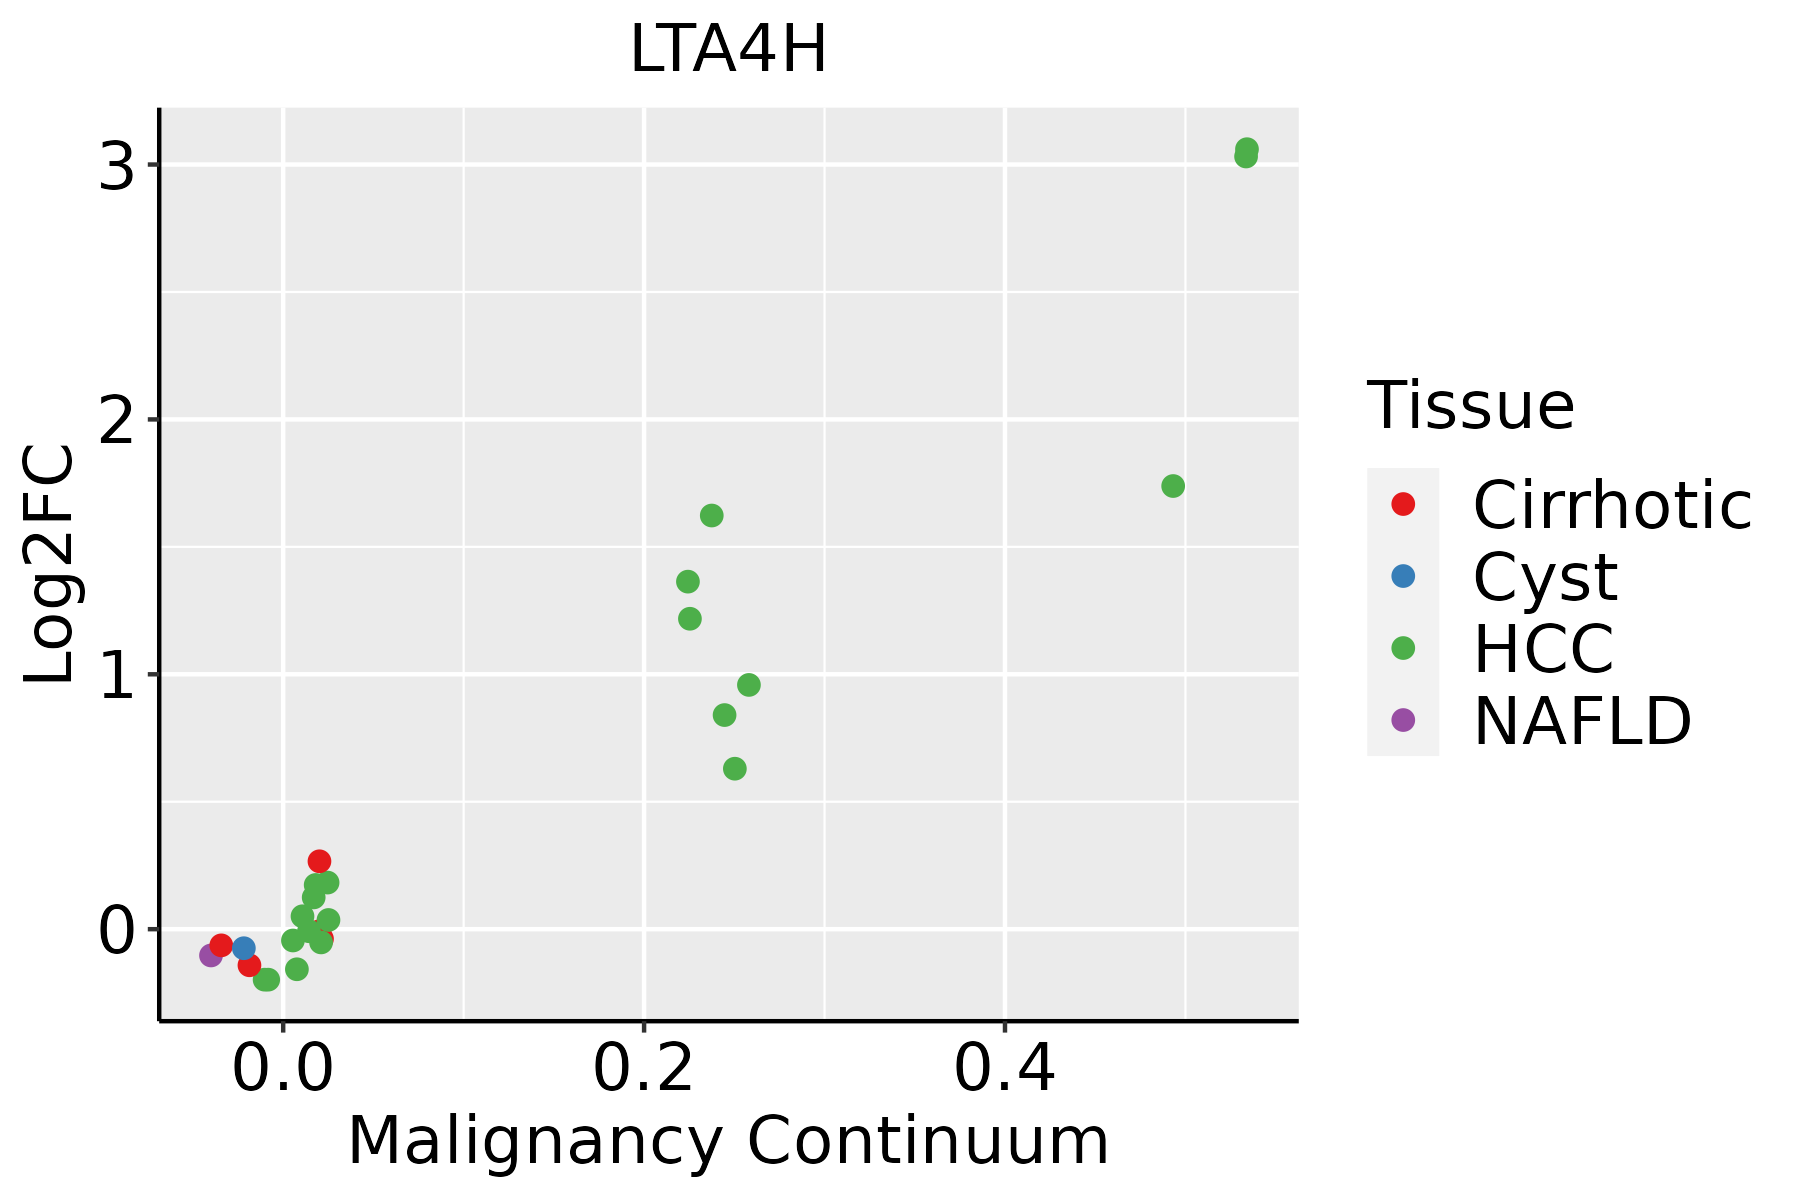
HCC: Hepatocellular carcinoma
NAFLD: Non-alcoholic fatty liver disease
Oral CavityThe image shows the transcriptomic changes along malignancy continuum.log2FC in expression of this searched gene in stem-like cells from each diseased tissue sample relative to stem-like cells in normal samples in each tissue plotted against the malignancy continuum. Samples are colored based on if they are from different disease stage.EOLP: Erosive Oral lichen planus
LP: leukoplakia
NEOLP: Non-erosive oral lichen planus
OSCC: Oral squamous cell carcinoma
SkinThe image shows the transcriptomic changes along malignancy continuum.log2FC in expression of this searched gene in stem-like cells from each diseased tissue sample relative to stem-like cells in normal samples in each tissue plotted against the malignancy continuum. Samples are colored based on if they are from different disease stage.
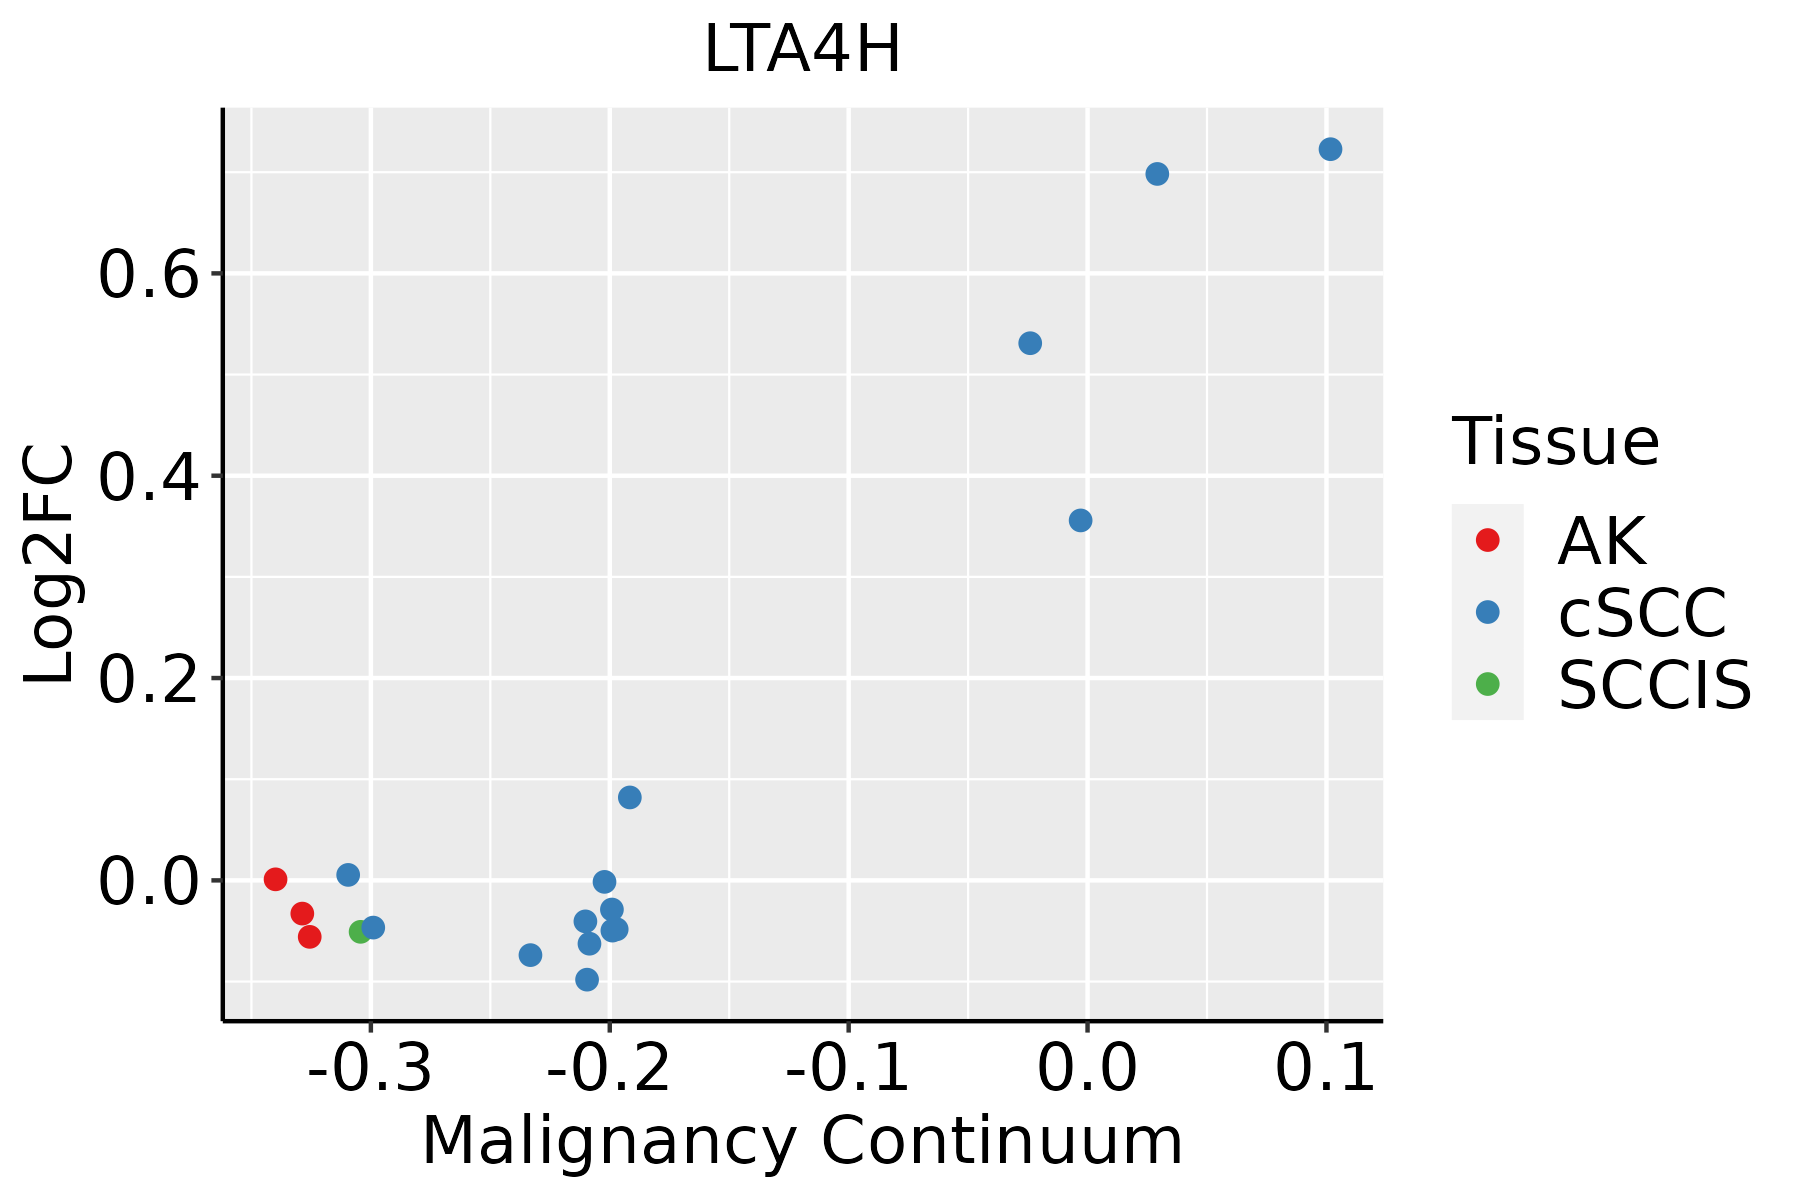
AK: Actinic keratosis
cSCC: Cutaneous squamous cell carcinoma
SCCIS:squamous cell carcinoma in situ
ThyroidThe image shows the transcriptomic changes along malignancy continuum.log2FC in expression of this searched gene in stem-like cells from each diseased tissue sample relative to stem-like cells in normal samples in each tissue plotted against the malignancy continuum. Samples are colored based on if they are from different disease stage.
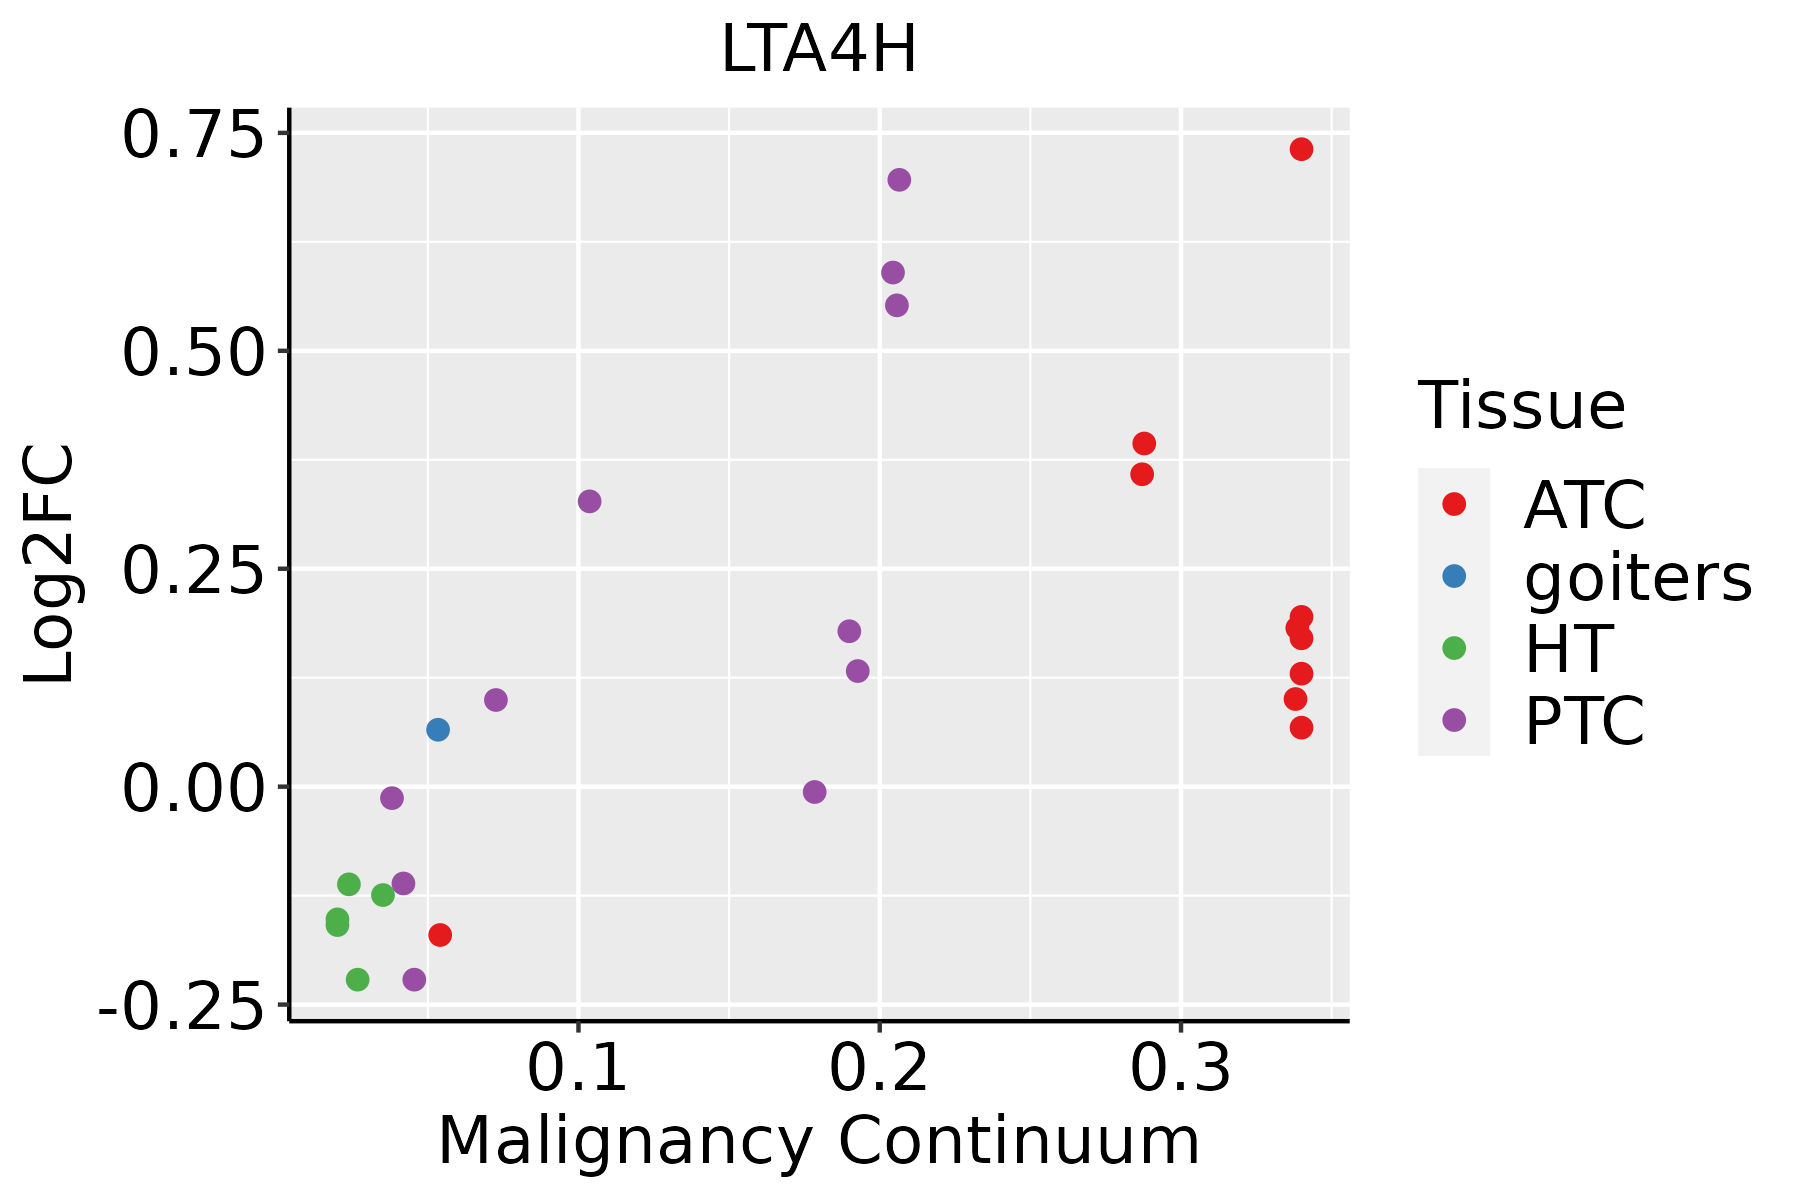
ATC: Anaplastic thyroid cancer
HT: Hashimoto's thyroiditis
PTC: Papillary thyroid cancer
∗log2FC in expression of this searched gene in stem-like cells from each diseased tissue sample relative to stem-like cells in normal samples in each tissue plotted against the malignancy continuum. Samples are colored based on if they are from different disease stage.

Top

Malignant transformation related pathway analysis

check buttonFind out the enriched GO biological processes and KEGG pathways involved in transition from healthy to precancer to cancer
check button Figure of enriched GO biological processes.
TissueDisease StageEnriched GO biological Processes
ColorectumADGO analysis - Figure of enriched GO biological processes: Top 15 enriched GO BP terms are showed in the bar plot of each disease state in each tissue. Each row represents a significant GO biological process which is colored according to the -log10(p.adjust).
ColorectumSERGO analysis - Figure of enriched GO biological processes: Top 15 enriched GO BP terms are showed in the bar plot of each disease state in each tissue. Each row represents a significant GO biological process which is colored according to the -log10(p.adjust).
ColorectumMSSGO analysis - Figure of enriched GO biological processes: Top 15 enriched GO BP terms are showed in the bar plot of each disease state in each tissue. Each row represents a significant GO biological process which is colored according to the -log10(p.adjust).
ColorectumMSI-HGO analysis - Figure of enriched GO biological processes: Top 15 enriched GO BP terms are showed in the bar plot of each disease state in each tissue. Each row represents a significant GO biological process which is colored according to the -log10(p.adjust).
ColorectumFAPGO analysis - Figure of enriched GO biological processes: Top 15 enriched GO BP terms are showed in the bar plot of each disease state in each tissue. Each row represents a significant GO biological process which is colored according to the -log10(p.adjust).
∗Top 15 enriched GO BP terms are showed in the bar plot of each disease state in each tissue. Each row represents a significant GO biological process which is colored according to the -log10(p.adjust).
Page: 1 2 3 4 5 6 7 8 9 

check button Enriched GO biological processes.
GO IDTissueDisease StageDescriptionGene RatioBg Ratiopvaluep.adjustCount
GO:0046394ColorectumMSScarboxylic acid biosynthetic process76/3467314/187236.71e-034.38e-0276
GO:0016053ColorectumMSSorganic acid biosynthetic process76/3467316/187237.88e-034.84e-0276
GO:00463941ColorectumMSI-Hcarboxylic acid biosynthetic process36/1319314/187232.68e-033.48e-0236
GO:00160531ColorectumMSI-Horganic acid biosynthetic process36/1319316/187232.98e-033.78e-0236
GO:00463948EsophagusESCCcarboxylic acid biosynthetic process175/8552314/187231.98e-041.26e-03175
GO:00160538EsophagusESCCorganic acid biosynthetic process175/8552316/187233.04e-041.82e-03175
GO:001605312LiverCirrhoticorganic acid biosynthetic process139/4634316/187234.28e-143.83e-12139
GO:004639412LiverCirrhoticcarboxylic acid biosynthetic process137/4634314/187231.40e-131.14e-11137
GO:001605321LiverHCCorganic acid biosynthetic process200/7958316/187235.24e-143.22e-12200
GO:004639421LiverHCCcarboxylic acid biosynthetic process198/7958314/187231.19e-136.78e-12198
GO:00160537Oral cavityOSCCorganic acid biosynthetic process155/7305316/187231.64e-041.13e-03155
GO:00463947Oral cavityOSCCcarboxylic acid biosynthetic process154/7305314/187231.73e-041.19e-03154
Page: 1 

check button Enriched KEGG pathways.
Pathway IDTissueDisease StageDescriptionGene RatioBg Ratiopvaluep.adjustqvalueCount
Page: 1 

Top

Cell-cell communication analysis

check buttonIdentification of potential cell-cell interactions between two cell types and their ligand-receptor pairs for different disease states
LigandReceptorLRpairPathwayTissueDisease Stage
Page: 1 

Top

Single-cell gene regulatory network inference analysis

check buttonFind out the significant the regulons (TFs) and the target genes of each regulon across cell types for different disease states
TFCell TypeTissueDisease StageTarget GeneRSSRegulon Activity
∗The dot plots of a searched regulon are shown for all cell subpopulations in each disease state of each tissue based on the regulon specific score inferred using pySCENIC and by calculating the average expression.
Page: 1 

Top

Somatic mutation of malignant transformation related genes

check buttonAnnotation of somatic variants for genes involved in malignant transformation
Hugo SymbolVariant ClassVariant ClassificationdbSNP RSHGVScHGVSpHGVSp ShortSWISSPROTBIOTYPESIFTPolyPhenTumor Sample BarcodeTissueHistologySexAgeStageTherapy TypesDrugsOutcome
LTA4HSNVMissense_Mutationc.295N>Gp.Gln99Glup.Q99EP09960protein_codingtolerated(0.47)benign(0.027)TCGA-A8-A06Q-01Breastbreast invasive carcinomaFemale<65III/IVUnknownUnknownSD
LTA4HSNVMissense_Mutationnovelc.322N>Ap.Glu108Lysp.E108KP09960protein_codingtolerated(0.1)benign(0.092)TCGA-B6-A40B-01Breastbreast invasive carcinomaFemale>=65I/IIUnknownUnknownSD
LTA4HSNVMissense_Mutationc.670N>Cp.Glu224Glnp.E224QP09960protein_codingdeleterious(0)probably_damaging(1)TCGA-BH-A0B6-01Breastbreast invasive carcinomaFemale<65I/IIUnknownUnknownSD
LTA4HSNVMissense_Mutationc.1228N>Ap.Ala410Thrp.A410TP09960protein_codingtolerated(0.07)benign(0.194)TCGA-AU-3779-01Colorectumcolon adenocarcinomaFemale>=65I/IIUnknownUnknownSD
LTA4HSNVMissense_Mutationc.695C>Tp.Ala232Valp.A232VP09960protein_codingdeleterious(0.04)benign(0.427)TCGA-A5-A1OF-01Endometriumuterine corpus endometrioid carcinomaFemale<65I/IIUnknownUnknownSD
LTA4HSNVMissense_Mutationnovelc.275N>Tp.Pro92Leup.P92LP09960protein_codingdeleterious(0.04)possibly_damaging(0.743)TCGA-AJ-A3EK-01Endometriumuterine corpus endometrioid carcinomaFemale<65I/IIChemotherapycarboplatinCR
LTA4HSNVMissense_Mutationc.523N>Tp.Arg175Cysp.R175CP09960protein_codingdeleterious(0.01)possibly_damaging(0.832)TCGA-AJ-A3EL-01Endometriumuterine corpus endometrioid carcinomaFemale<65I/IIUnknownUnknownSD
LTA4HSNVMissense_Mutationnovelc.1195N>Ap.Gly399Argp.G399RP09960protein_codingdeleterious(0)probably_damaging(0.997)TCGA-AP-A1DK-01Endometriumuterine corpus endometrioid carcinomaFemale<65I/IIUnknownUnknownSD
LTA4HSNVMissense_Mutationrs776850878c.1651G>Ap.Ala551Thrp.A551TP09960protein_codingtolerated(0.3)possibly_damaging(0.561)TCGA-AX-A2HC-01Endometriumuterine corpus endometrioid carcinomaFemale<65III/IVChemotherapypaclitaxelPD
LTA4HSNVMissense_Mutationnovelc.134C>Ap.Ser45Tyrp.S45YP09960protein_codingtolerated(0.14)benign(0.262)TCGA-AX-A2HC-01Endometriumuterine corpus endometrioid carcinomaFemale<65III/IVChemotherapypaclitaxelPD
Page: 1 2 3 4 

Top

Related drugs of malignant transformation related genes

check buttonIdentification of chemicals and drugs interact with genes involved in malignant transfromation
(DGIdb 4.0)
Entrez IDSymbolCategoryInteraction TypesDrug Claim NameDrug NamePMIDs
4048LTA4HENZYME, DRUGGABLE GENOME, PROTEASEANTIINFLAMMATORY AGENTS8423594
4048LTA4HENZYME, DRUGGABLE GENOME, PROTEASEDIPHENYLETHERDIPHENYLETHER18952425
4048LTA4HENZYME, DRUGGABLE GENOME, PROTEASEmontelukastMONTELUKAST
4048LTA4HENZYME, DRUGGABLE GENOME, PROTEASEinhibitor315661176
4048LTA4HENZYME, DRUGGABLE GENOME, PROTEASEinhibitor315661187CHEMBL119054
4048LTA4HENZYME, DRUGGABLE GENOME, PROTEASEinhibitor178101843
4048LTA4HENZYME, DRUGGABLE GENOME, PROTEASE4-PHENOXYPHENOLCHEMBL22431818952425
4048LTA4HENZYME, DRUGGABLE GENOME, PROTEASEDG051
4048LTA4HENZYME, DRUGGABLE GENOME, PROTEASE4-METHOXYPHENOXYBENZENECHEMBL39802118952425
4048LTA4HENZYME, DRUGGABLE GENOME, PROTEASEOPIOID1410529
Page: 1 2