
|
|||||
|
 | |
| |
| |
| |
| |
| |
|
Gene: LSP1 |
Gene summary for LSP1 |
| Gene information | Species | Human | Gene symbol | LSP1 | Gene ID | 4046 |
| Gene name | lymphocyte specific protein 1 | |
| Gene Alias | WP34 | |
| Cytomap | 11p15.5 | |
| Gene Type | protein-coding | GO ID | GO:0006935 | UniProtAcc | P33241 |
Top |
Malignant transformation analysis |
| Identification of the aberrant gene expression in precancerous and cancerous lesions by comparing the gene expression of stem-like cells in diseased tissues with normal stem cells |
| Entrez ID | Symbol | Replicates | Species | Organ | Tissue | Adj P-value | Log2FC | Malignancy |
| 4046 | LSP1 | LZE20T | Human | Esophagus | ESCC | 4.31e-04 | 7.70e-01 | 0.0662 |
| 4046 | LSP1 | LZE6T | Human | Esophagus | ESCC | 4.44e-11 | 1.21e+00 | 0.0845 |
| 4046 | LSP1 | P2T-E | Human | Esophagus | ESCC | 3.70e-02 | -1.29e-01 | 0.1177 |
| 4046 | LSP1 | P4T-E | Human | Esophagus | ESCC | 5.41e-05 | -1.50e-01 | 0.1323 |
| 4046 | LSP1 | P16T-E | Human | Esophagus | ESCC | 3.97e-04 | -2.17e-01 | 0.1153 |
| 4046 | LSP1 | P20T-E | Human | Esophagus | ESCC | 2.17e-17 | 7.48e-01 | 0.1124 |
| 4046 | LSP1 | P21T-E | Human | Esophagus | ESCC | 1.78e-37 | 1.50e+00 | 0.1617 |
| 4046 | LSP1 | P24T-E | Human | Esophagus | ESCC | 8.42e-03 | -1.55e-01 | 0.1287 |
| 4046 | LSP1 | P26T-E | Human | Esophagus | ESCC | 8.84e-05 | -2.05e-01 | 0.1276 |
| 4046 | LSP1 | P27T-E | Human | Esophagus | ESCC | 1.19e-33 | 9.78e-01 | 0.1055 |
| 4046 | LSP1 | P30T-E | Human | Esophagus | ESCC | 2.55e-05 | 7.03e-02 | 0.137 |
| 4046 | LSP1 | P31T-E | Human | Esophagus | ESCC | 1.15e-03 | -1.84e-01 | 0.1251 |
| 4046 | LSP1 | P32T-E | Human | Esophagus | ESCC | 1.07e-02 | -1.94e-01 | 0.1666 |
| 4046 | LSP1 | P37T-E | Human | Esophagus | ESCC | 4.42e-02 | -1.26e-01 | 0.1371 |
| 4046 | LSP1 | P39T-E | Human | Esophagus | ESCC | 3.27e-02 | 4.48e-01 | 0.0894 |
| 4046 | LSP1 | P42T-E | Human | Esophagus | ESCC | 4.90e-02 | 3.39e-01 | 0.1175 |
| 4046 | LSP1 | P47T-E | Human | Esophagus | ESCC | 1.48e-05 | 7.93e-02 | 0.1067 |
| 4046 | LSP1 | P62T-E | Human | Esophagus | ESCC | 2.10e-36 | 1.65e+00 | 0.1302 |
| 4046 | LSP1 | P74T-E | Human | Esophagus | ESCC | 4.28e-44 | 1.78e+00 | 0.1479 |
| 4046 | LSP1 | P80T-E | Human | Esophagus | ESCC | 9.37e-60 | 3.30e+00 | 0.155 |
| Page: 1 2 3 4 |
| Tissue | Expression Dynamics | Abbreviation |
| Esophagus | 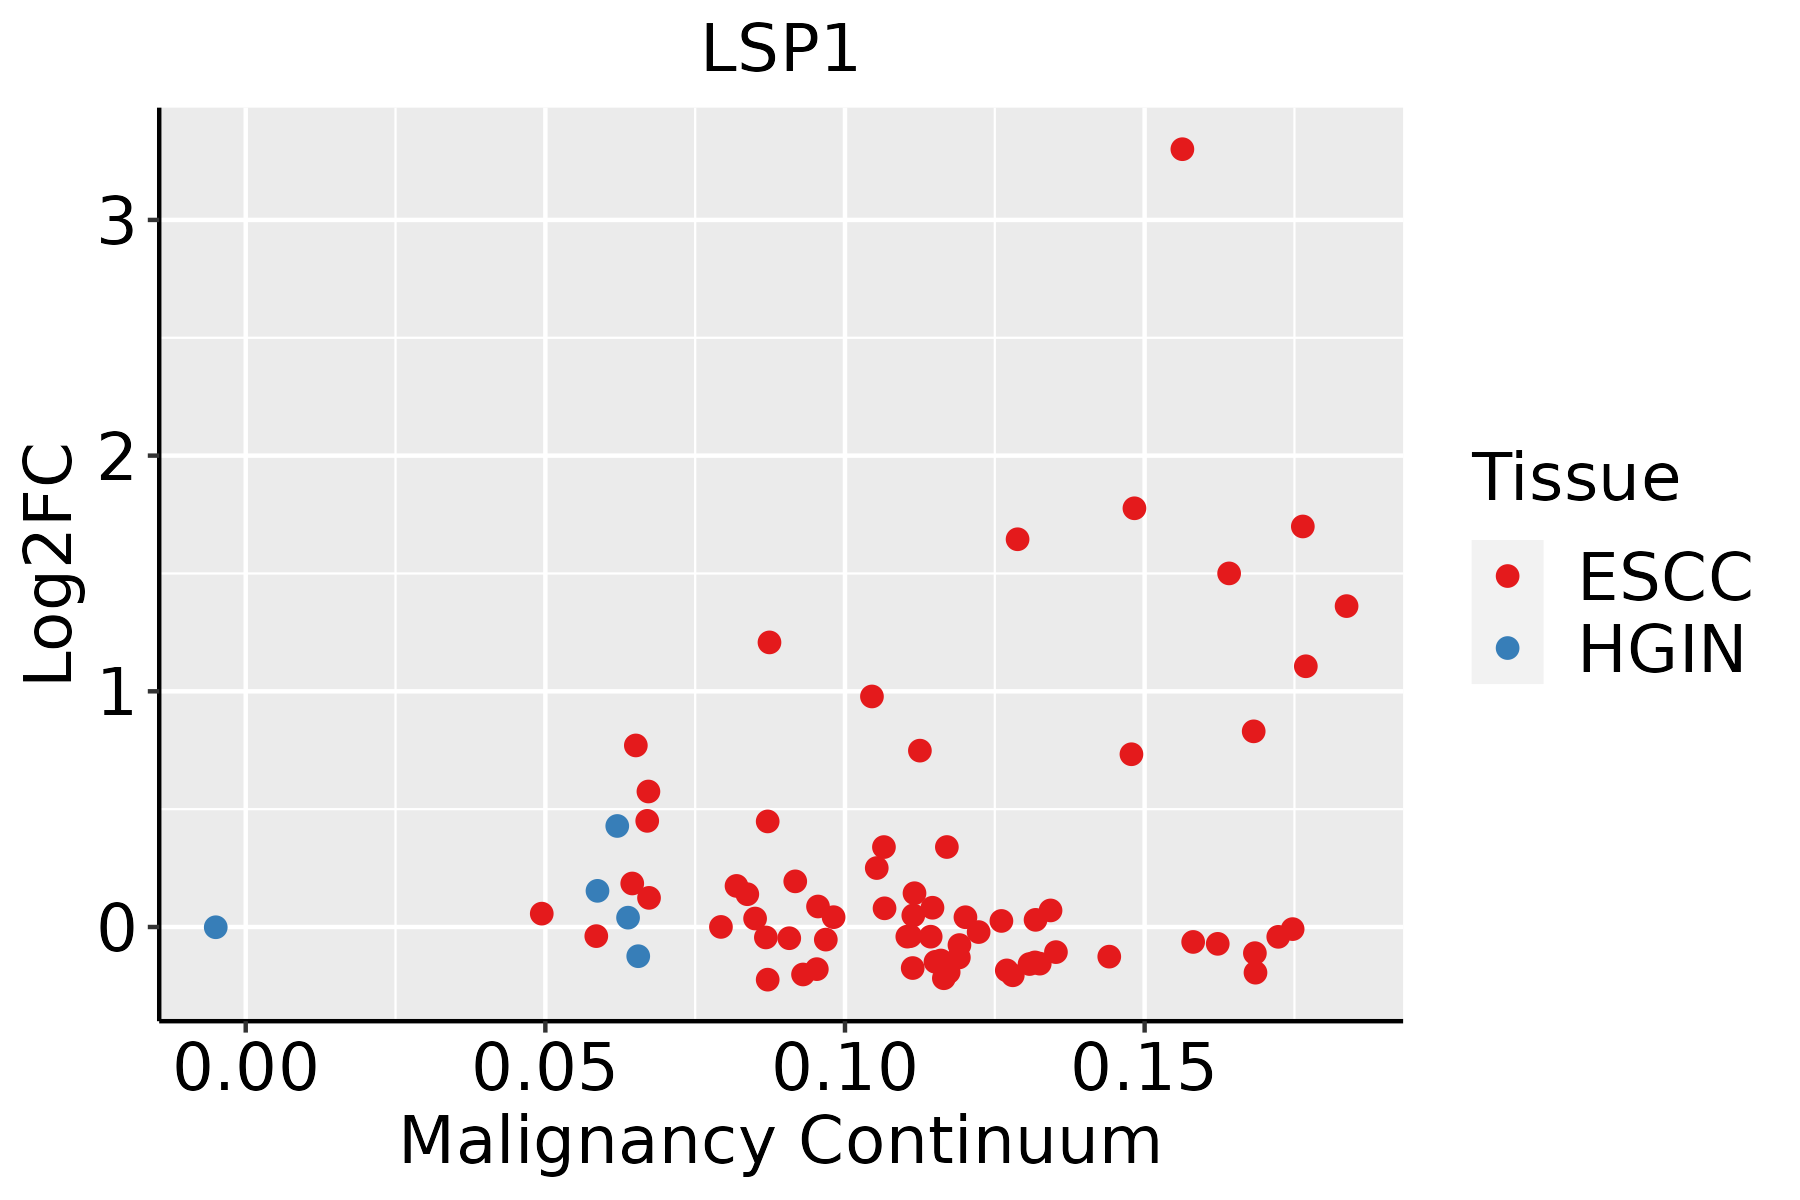 | ESCC: Esophageal squamous cell carcinoma |
| HGIN: High-grade intraepithelial neoplasias | ||
| LGIN: Low-grade intraepithelial neoplasias | ||
| Oral Cavity | 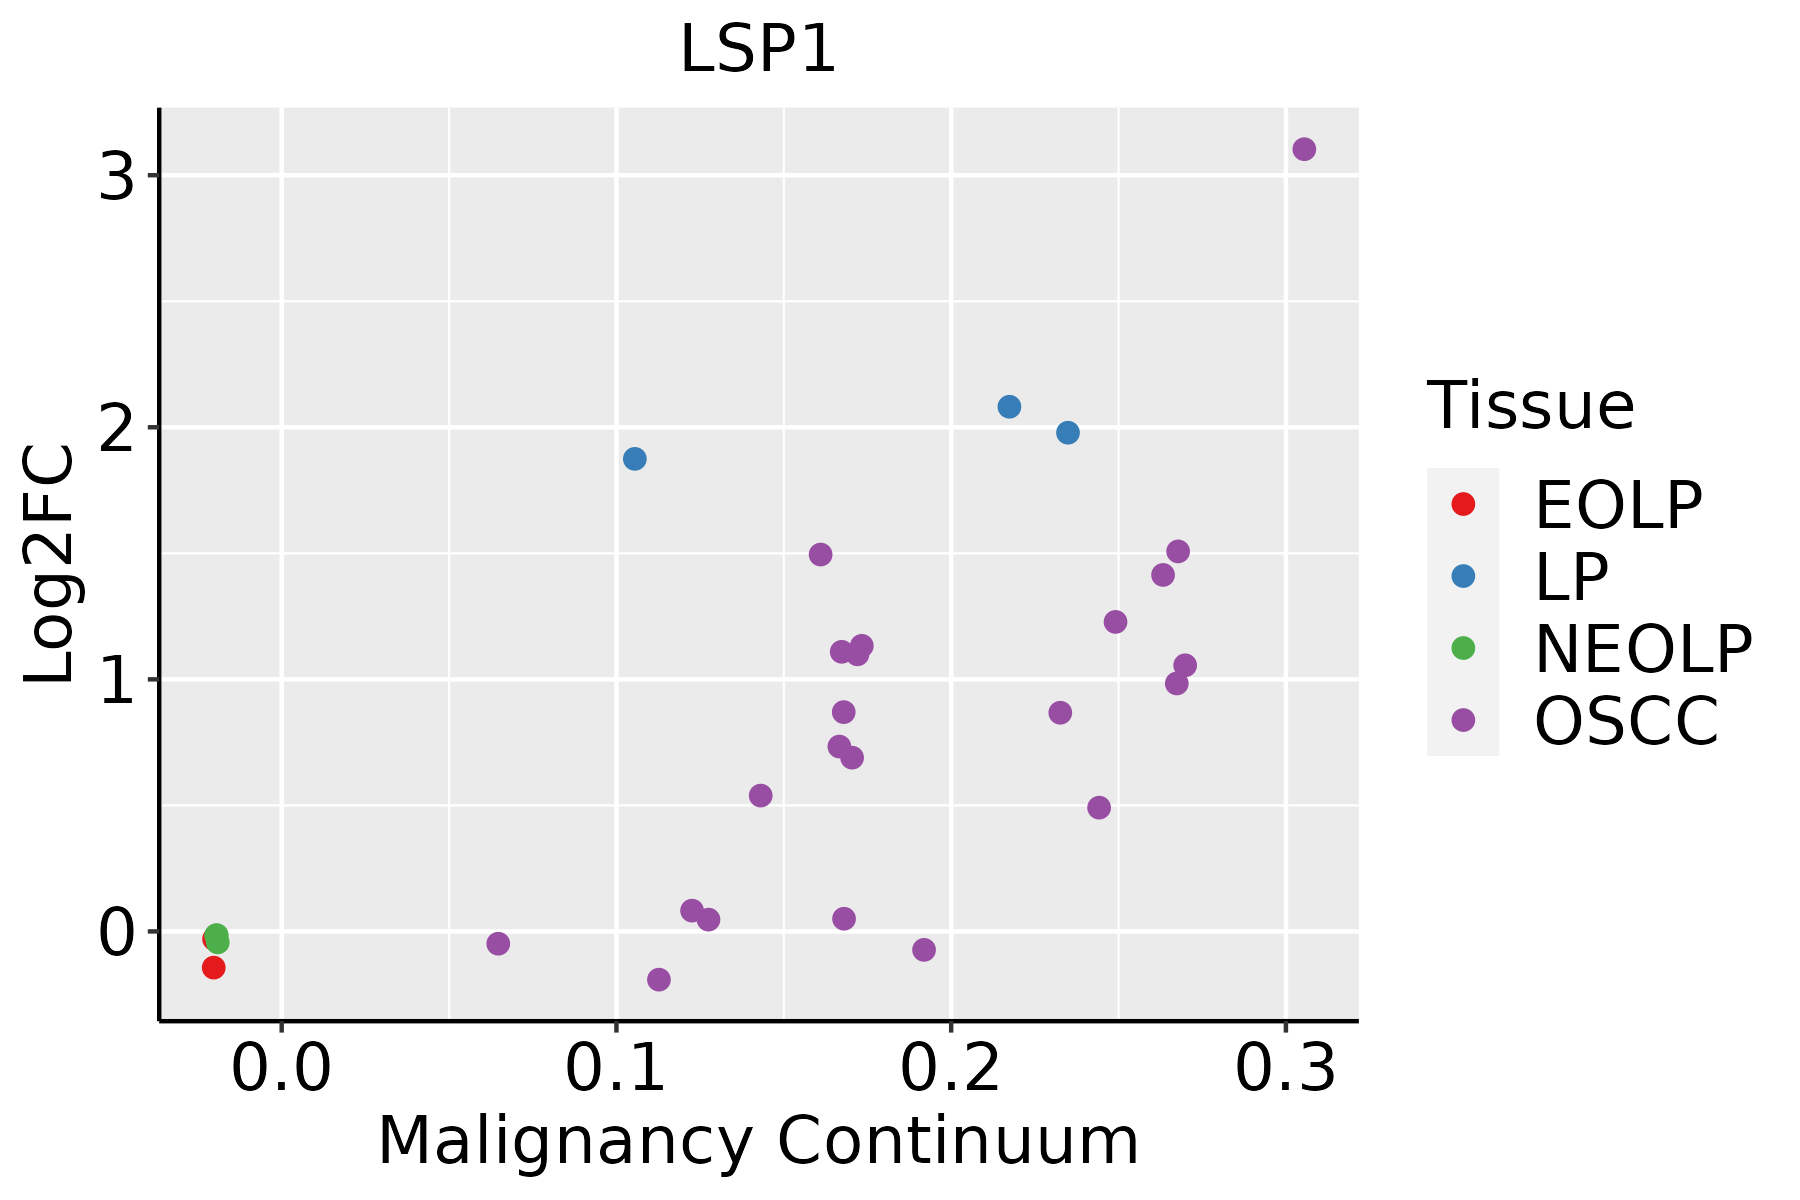 | EOLP: Erosive Oral lichen planus |
| LP: leukoplakia | ||
| NEOLP: Non-erosive oral lichen planus | ||
| OSCC: Oral squamous cell carcinoma | ||
| Skin | 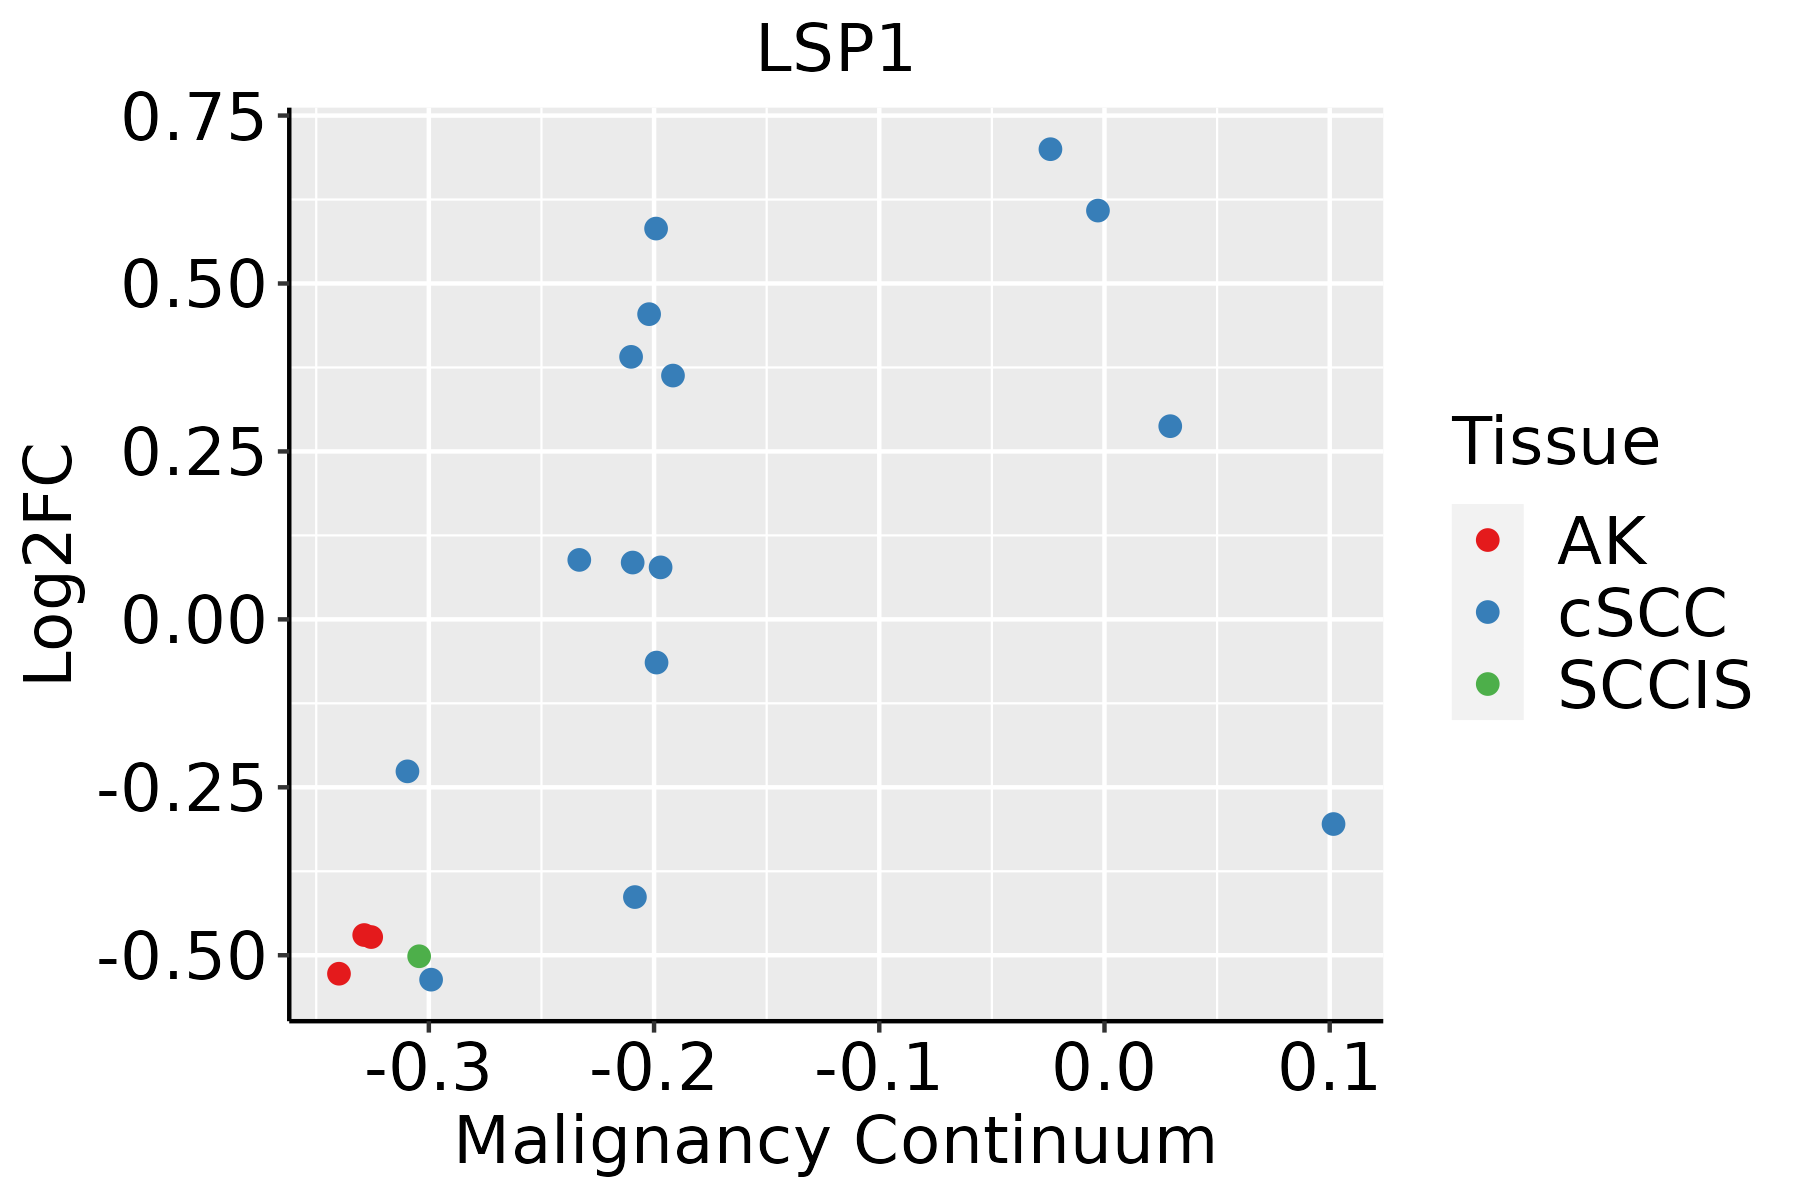 | AK: Actinic keratosis |
| cSCC: Cutaneous squamous cell carcinoma | ||
| SCCIS:squamous cell carcinoma in situ | ||
| Thyroid |  | ATC: Anaplastic thyroid cancer |
| HT: Hashimoto's thyroiditis | ||
| PTC: Papillary thyroid cancer |
| ∗log2FC in expression of this searched gene in stem-like cells from each diseased tissue sample relative to stem-like cells in normal samples in each tissue plotted against the malignancy continuum. Samples are colored based on if they are from different disease stage. |
Top |
Malignant transformation related pathway analysis |
| Find out the enriched GO biological processes and KEGG pathways involved in transition from healthy to precancer to cancer |
| Tissue | Disease Stage | Enriched GO biological Processes |
| Colorectum | AD |  |
| Colorectum | SER |  |
| Colorectum | MSS |  |
| Colorectum | MSI-H |  |
| Colorectum | FAP |  |
| ∗Top 15 enriched GO BP terms are showed in the bar plot of each disease state in each tissue. Each row represents a significant GO biological process which is colored according to the -log10(p.adjust). |
| Page: 1 2 3 4 5 6 7 8 9 |
| GO ID | Tissue | Disease Stage | Description | Gene Ratio | Bg Ratio | pvalue | p.adjust | Count |
| GO:0098760110 | Esophagus | ESCC | response to interleukin-7 | 14/8552 | 15/18723 | 1.47e-04 | 9.85e-04 | 14 |
| GO:0098761110 | Esophagus | ESCC | cellular response to interleukin-7 | 14/8552 | 15/18723 | 1.47e-04 | 9.85e-04 | 14 |
| GO:009876017 | Oral cavity | OSCC | response to interleukin-7 | 14/7305 | 15/18723 | 1.79e-05 | 1.74e-04 | 14 |
| GO:009876117 | Oral cavity | OSCC | cellular response to interleukin-7 | 14/7305 | 15/18723 | 1.79e-05 | 1.74e-04 | 14 |
| GO:009876018 | Oral cavity | LP | response to interleukin-7 | 11/4623 | 15/18723 | 1.01e-04 | 1.24e-03 | 11 |
| GO:009876118 | Oral cavity | LP | cellular response to interleukin-7 | 11/4623 | 15/18723 | 1.01e-04 | 1.24e-03 | 11 |
| GO:009876020 | Skin | cSCC | response to interleukin-7 | 11/4864 | 15/18723 | 1.67e-04 | 1.45e-03 | 11 |
| GO:009876120 | Skin | cSCC | cellular response to interleukin-7 | 11/4864 | 15/18723 | 1.67e-04 | 1.45e-03 | 11 |
| GO:009876024 | Thyroid | HT | response to interleukin-7 | 8/1272 | 15/18723 | 1.86e-06 | 6.84e-05 | 8 |
| GO:009876124 | Thyroid | HT | cellular response to interleukin-7 | 8/1272 | 15/18723 | 1.86e-06 | 6.84e-05 | 8 |
| GO:009876025 | Thyroid | ATC | response to interleukin-7 | 12/6293 | 15/18723 | 3.10e-04 | 1.94e-03 | 12 |
| GO:009876125 | Thyroid | ATC | cellular response to interleukin-7 | 12/6293 | 15/18723 | 3.10e-04 | 1.94e-03 | 12 |
| Page: 1 |
| Pathway ID | Tissue | Disease Stage | Description | Gene Ratio | Bg Ratio | pvalue | p.adjust | qvalue | Count |
| hsa046259 | Esophagus | ESCC | C-type lectin receptor signaling pathway | 73/4205 | 104/8465 | 1.57e-05 | 7.98e-05 | 4.09e-05 | 73 |
| hsa051527 | Esophagus | ESCC | Tuberculosis | 111/4205 | 180/8465 | 7.14e-04 | 2.32e-03 | 1.19e-03 | 111 |
| hsa0462513 | Esophagus | ESCC | C-type lectin receptor signaling pathway | 73/4205 | 104/8465 | 1.57e-05 | 7.98e-05 | 4.09e-05 | 73 |
| hsa0515212 | Esophagus | ESCC | Tuberculosis | 111/4205 | 180/8465 | 7.14e-04 | 2.32e-03 | 1.19e-03 | 111 |
| hsa046258 | Oral cavity | OSCC | C-type lectin receptor signaling pathway | 73/3704 | 104/8465 | 3.83e-08 | 3.12e-07 | 1.59e-07 | 73 |
| hsa051526 | Oral cavity | OSCC | Tuberculosis | 105/3704 | 180/8465 | 5.00e-05 | 2.04e-04 | 1.04e-04 | 105 |
| hsa0462512 | Oral cavity | OSCC | C-type lectin receptor signaling pathway | 73/3704 | 104/8465 | 3.83e-08 | 3.12e-07 | 1.59e-07 | 73 |
| hsa0515211 | Oral cavity | OSCC | Tuberculosis | 105/3704 | 180/8465 | 5.00e-05 | 2.04e-04 | 1.04e-04 | 105 |
| hsa0462521 | Oral cavity | LP | C-type lectin receptor signaling pathway | 43/2418 | 104/8465 | 3.33e-03 | 1.41e-02 | 9.06e-03 | 43 |
| hsa0515221 | Oral cavity | LP | Tuberculosis | 65/2418 | 180/8465 | 1.60e-02 | 4.92e-02 | 3.17e-02 | 65 |
| hsa0462531 | Oral cavity | LP | C-type lectin receptor signaling pathway | 43/2418 | 104/8465 | 3.33e-03 | 1.41e-02 | 9.06e-03 | 43 |
| hsa0515231 | Oral cavity | LP | Tuberculosis | 65/2418 | 180/8465 | 1.60e-02 | 4.92e-02 | 3.17e-02 | 65 |
| Page: 1 |
Top |
Cell-cell communication analysis |
| Identification of potential cell-cell interactions between two cell types and their ligand-receptor pairs for different disease states |
| Ligand | Receptor | LRpair | Pathway | Tissue | Disease Stage |
| Page: 1 |
Top |
Single-cell gene regulatory network inference analysis |
| Find out the significant the regulons (TFs) and the target genes of each regulon across cell types for different disease states |
| TF | Cell Type | Tissue | Disease Stage | Target Gene | RSS | Regulon Activity |
| ∗The dot plots of a searched regulon are shown for all cell subpopulations in each disease state of each tissue based on the regulon specific score inferred using pySCENIC and by calculating the average expression. |
| Page: 1 |
Top |
Somatic mutation of malignant transformation related genes |
| Annotation of somatic variants for genes involved in malignant transformation |
| Hugo Symbol | Variant Class | Variant Classification | dbSNP RS | HGVSc | HGVSp | HGVSp Short | SWISSPROT | BIOTYPE | SIFT | PolyPhen | Tumor Sample Barcode | Tissue | Histology | Sex | Age | Stage | Therapy Types | Drugs | Outcome |
| LSP1 | SNV | Missense_Mutation | rs769418125 | c.1079N>G | p.Glu360Gly | p.E360G | P33241 | protein_coding | deleterious_low_confidence(0) | probably_damaging(0.985) | TCGA-AR-A1AY-01 | Breast | breast invasive carcinoma | Female | >=65 | I/II | Unspecific | Doxorubicin | SD |
| LSP1 | SNV | Missense_Mutation | novel | c.995N>A | p.Ser332Tyr | p.S332Y | P33241 | protein_coding | deleterious_low_confidence(0.02) | probably_damaging(0.993) | TCGA-BH-A2L8-01 | Breast | breast invasive carcinoma | Female | <65 | I/II | Chemotherapy | cytoxan | CR |
| LSP1 | SNV | Missense_Mutation | rs769418125 | c.1079N>G | p.Glu360Gly | p.E360G | P33241 | protein_coding | deleterious_low_confidence(0) | probably_damaging(0.985) | TCGA-C8-A1HO-01 | Breast | breast invasive carcinoma | Female | <65 | III/IV | Chemotherapy | 5-fluorouracil | CR |
| LSP1 | SNV | Missense_Mutation | rs769418125 | c.1079A>G | p.Glu360Gly | p.E360G | P33241 | protein_coding | deleterious_low_confidence(0) | probably_damaging(0.985) | TCGA-D8-A1JP-01 | Breast | breast invasive carcinoma | Female | >=65 | I/II | Hormone Therapy | tamoxiphen | SD |
| LSP1 | SNV | Missense_Mutation | novel | c.5N>T | p.Ala2Val | p.A2V | P33241 | protein_coding | deleterious_low_confidence(0) | probably_damaging(0.986) | TCGA-2W-A8YY-01 | Cervix | cervical & endocervical cancer | Female | <65 | I/II | Chemotherapy | cisplatin | CR |
| LSP1 | SNV | Missense_Mutation | novel | c.631N>A | p.Asp211Asn | p.D211N | P33241 | protein_coding | tolerated_low_confidence(0.18) | probably_damaging(0.996) | TCGA-2W-A8YY-01 | Cervix | cervical & endocervical cancer | Female | <65 | I/II | Chemotherapy | cisplatin | CR |
| LSP1 | SNV | Missense_Mutation | novel | c.1314N>T | p.Lys438Asn | p.K438N | P33241 | protein_coding | deleterious_low_confidence(0.01) | probably_damaging(0.999) | TCGA-AA-A010-01 | Colorectum | colon adenocarcinoma | Female | <65 | I/II | Chemotherapy | folinic | CR |
| LSP1 | SNV | Missense_Mutation | c.1134N>T | p.Gln378His | p.Q378H | P33241 | protein_coding | deleterious_low_confidence(0.01) | probably_damaging(0.986) | TCGA-AD-6964-01 | Colorectum | colon adenocarcinoma | Male | <65 | III/IV | Chemotherapy | folfox | PD | |
| LSP1 | SNV | Missense_Mutation | novel | c.392G>A | p.Gly131Asp | p.G131D | P33241 | protein_coding | deleterious_low_confidence(0.01) | benign(0.255) | TCGA-CM-5861-01 | Colorectum | colon adenocarcinoma | Female | <65 | I/II | Unknown | Unknown | PD |
| LSP1 | SNV | Missense_Mutation | rs201040841 | c.760N>A | p.Glu254Lys | p.E254K | P33241 | protein_coding | deleterious_low_confidence(0.05) | benign(0.071) | TCGA-NH-A5IV-01 | Colorectum | colon adenocarcinoma | Female | >=65 | I/II | Unknown | Unknown | SD |
| Page: 1 2 3 4 5 |
Top |
Related drugs of malignant transformation related genes |
| Identification of chemicals and drugs interact with genes involved in malignant transfromation |
| (DGIdb 4.0) |
| Entrez ID | Symbol | Category | Interaction Types | Drug Claim Name | Drug Name | PMIDs |
| Page: 1 |

Copyright 2023-Present -The University of Texas Health Science Center at Houston |