
|
|||||
|
 | |
| |
| |
| |
| |
| |
|
Gene: LSM8 |
Gene summary for LSM8 |
| Gene information | Species | Human | Gene symbol | LSM8 | Gene ID | 51691 |
| Gene name | LSM8 homolog, U6 small nuclear RNA associated | |
| Gene Alias | NAA38 | |
| Cytomap | 7q31.31 | |
| Gene Type | protein-coding | GO ID | GO:0000375 | UniProtAcc | A4D0W0 |
Top |
Malignant transformation analysis |
| Identification of the aberrant gene expression in precancerous and cancerous lesions by comparing the gene expression of stem-like cells in diseased tissues with normal stem cells |
| Entrez ID | Symbol | Replicates | Species | Organ | Tissue | Adj P-value | Log2FC | Malignancy |
| 51691 | LSM8 | CA_HPV_1 | Human | Cervix | CC | 4.17e-08 | -1.60e-01 | 0.0264 |
| 51691 | LSM8 | CCI_1 | Human | Cervix | CC | 8.63e-06 | -5.72e-01 | 0.528 |
| 51691 | LSM8 | CCI_3 | Human | Cervix | CC | 1.30e-03 | -4.20e-01 | 0.516 |
| 51691 | LSM8 | CCII_1 | Human | Cervix | CC | 8.58e-10 | -5.46e-01 | 0.3249 |
| 51691 | LSM8 | AEH-subject1 | Human | Endometrium | AEH | 3.20e-03 | -1.06e-01 | -0.3059 |
| 51691 | LSM8 | AEH-subject2 | Human | Endometrium | AEH | 5.21e-03 | -1.60e-01 | -0.2525 |
| 51691 | LSM8 | AEH-subject3 | Human | Endometrium | AEH | 4.17e-06 | -2.50e-01 | -0.2576 |
| 51691 | LSM8 | AEH-subject4 | Human | Endometrium | AEH | 4.87e-05 | -2.49e-01 | -0.2657 |
| 51691 | LSM8 | EEC-subject1 | Human | Endometrium | EEC | 1.73e-09 | -2.82e-01 | -0.2682 |
| 51691 | LSM8 | EEC-subject2 | Human | Endometrium | EEC | 2.98e-08 | -2.60e-01 | -0.2607 |
| 51691 | LSM8 | EEC-subject3 | Human | Endometrium | EEC | 9.47e-36 | -3.66e-01 | -0.2525 |
| 51691 | LSM8 | EEC-subject4 | Human | Endometrium | EEC | 5.73e-05 | -2.25e-01 | -0.2571 |
| 51691 | LSM8 | GSM5276934 | Human | Endometrium | EEC | 1.21e-07 | -2.56e-01 | -0.0913 |
| 51691 | LSM8 | GSM6177620_NYU_UCEC1_lib1_lib1 | Human | Endometrium | EEC | 9.97e-25 | -1.81e-01 | -0.1869 |
| 51691 | LSM8 | GSM6177620_NYU_UCEC1_lib2_lib2 | Human | Endometrium | EEC | 1.06e-32 | -5.50e-02 | -0.1875 |
| 51691 | LSM8 | GSM6177620_NYU_UCEC1_lib3_lib3 | Human | Endometrium | EEC | 2.88e-36 | 4.27e-03 | -0.1883 |
| 51691 | LSM8 | GSM6177621_NYU_UCEC2_lib1_lib1 | Human | Endometrium | EEC | 2.68e-36 | -3.35e-01 | -0.1934 |
| 51691 | LSM8 | GSM6177622_NYU_UCEC3_lib1_lib1 | Human | Endometrium | EEC | 1.13e-46 | -2.78e-01 | -0.1917 |
| 51691 | LSM8 | GSM6177622_NYU_UCEC3_lib2_lib2 | Human | Endometrium | EEC | 7.60e-38 | -3.25e-01 | -0.1916 |
| 51691 | LSM8 | GSM6177623_NYU_UCEC3_Vis | Human | Endometrium | EEC | 1.59e-09 | 1.42e-01 | -0.1269 |
| Page: 1 2 3 4 5 6 7 8 |
| Tissue | Expression Dynamics | Abbreviation |
| Cervix |  | CC: Cervix cancer |
| HSIL_HPV: HPV-infected high-grade squamous intraepithelial lesions | ||
| N_HPV: HPV-infected normal cervix | ||
| Endometrium | 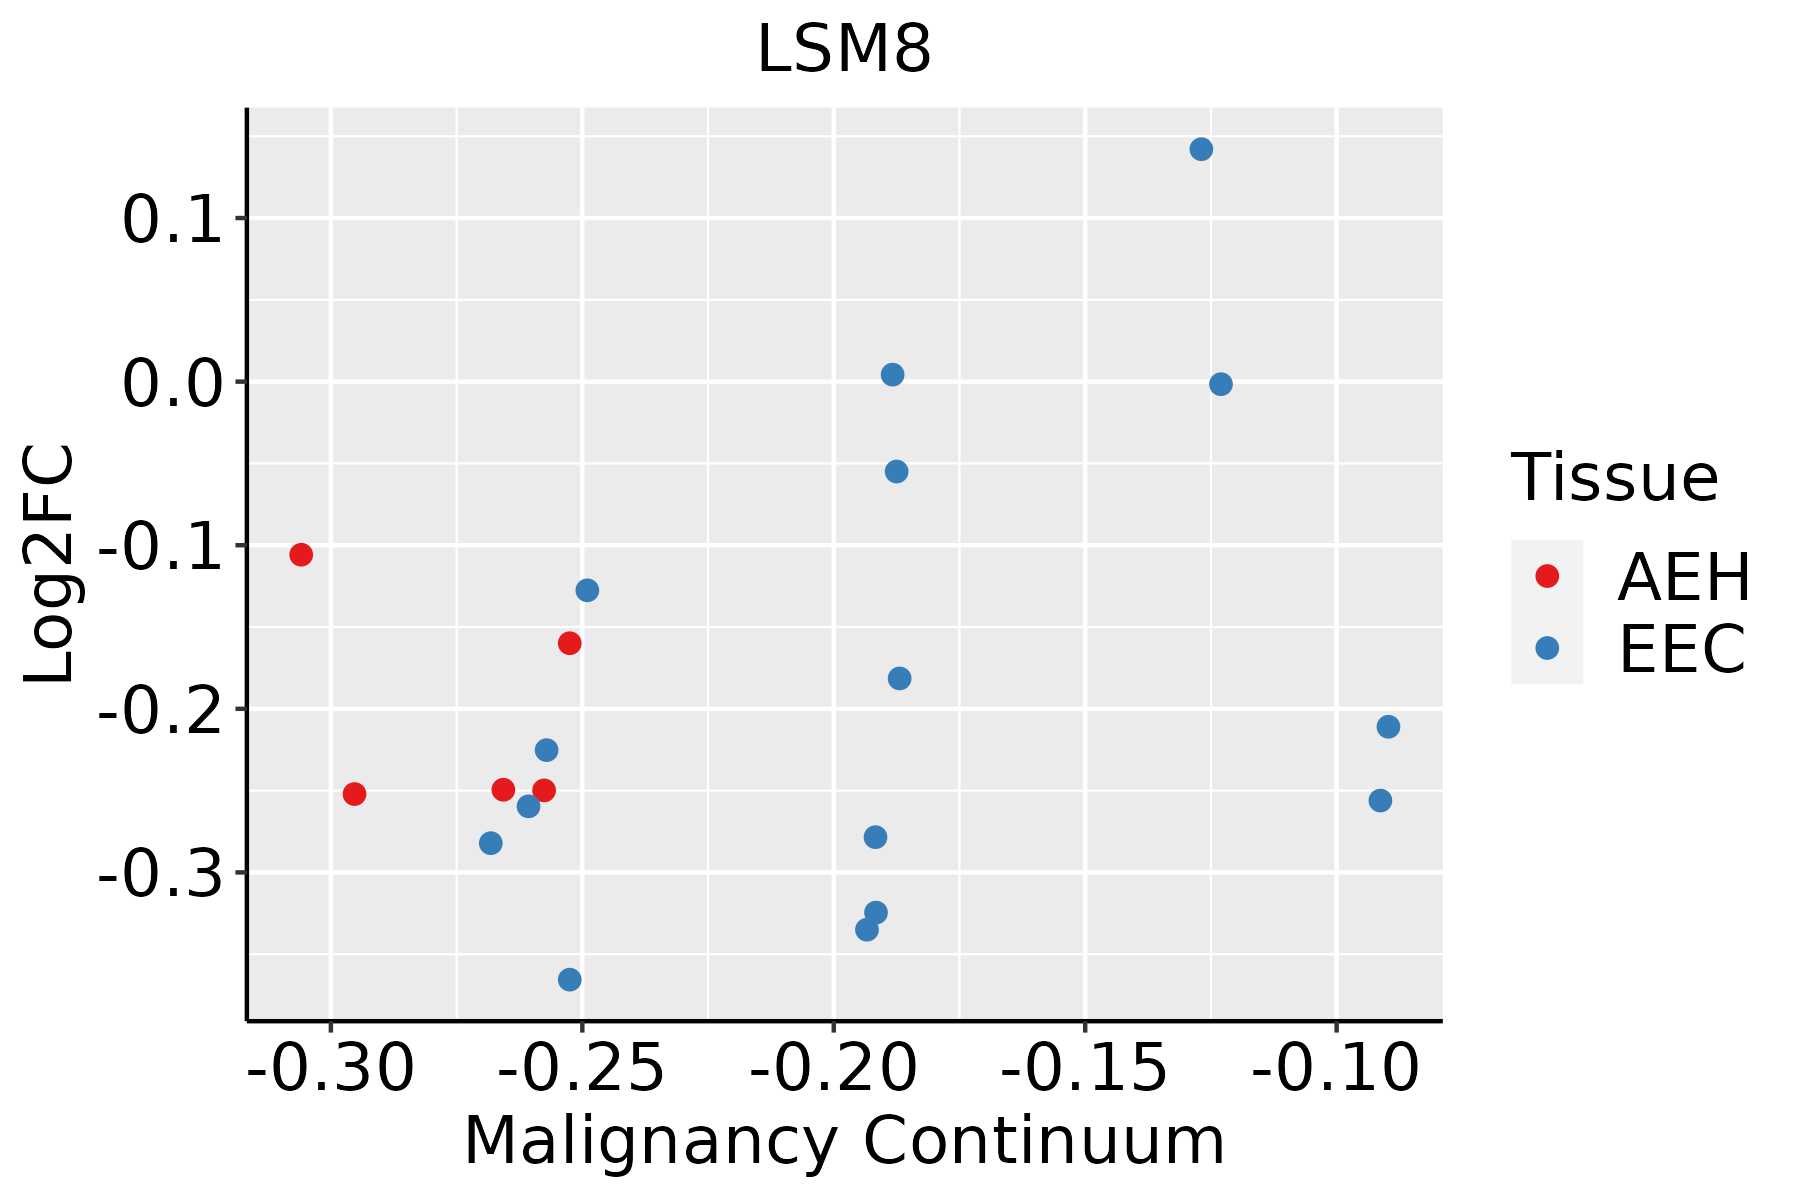 | AEH: Atypical endometrial hyperplasia |
| EEC: Endometrioid Cancer | ||
| Esophagus | 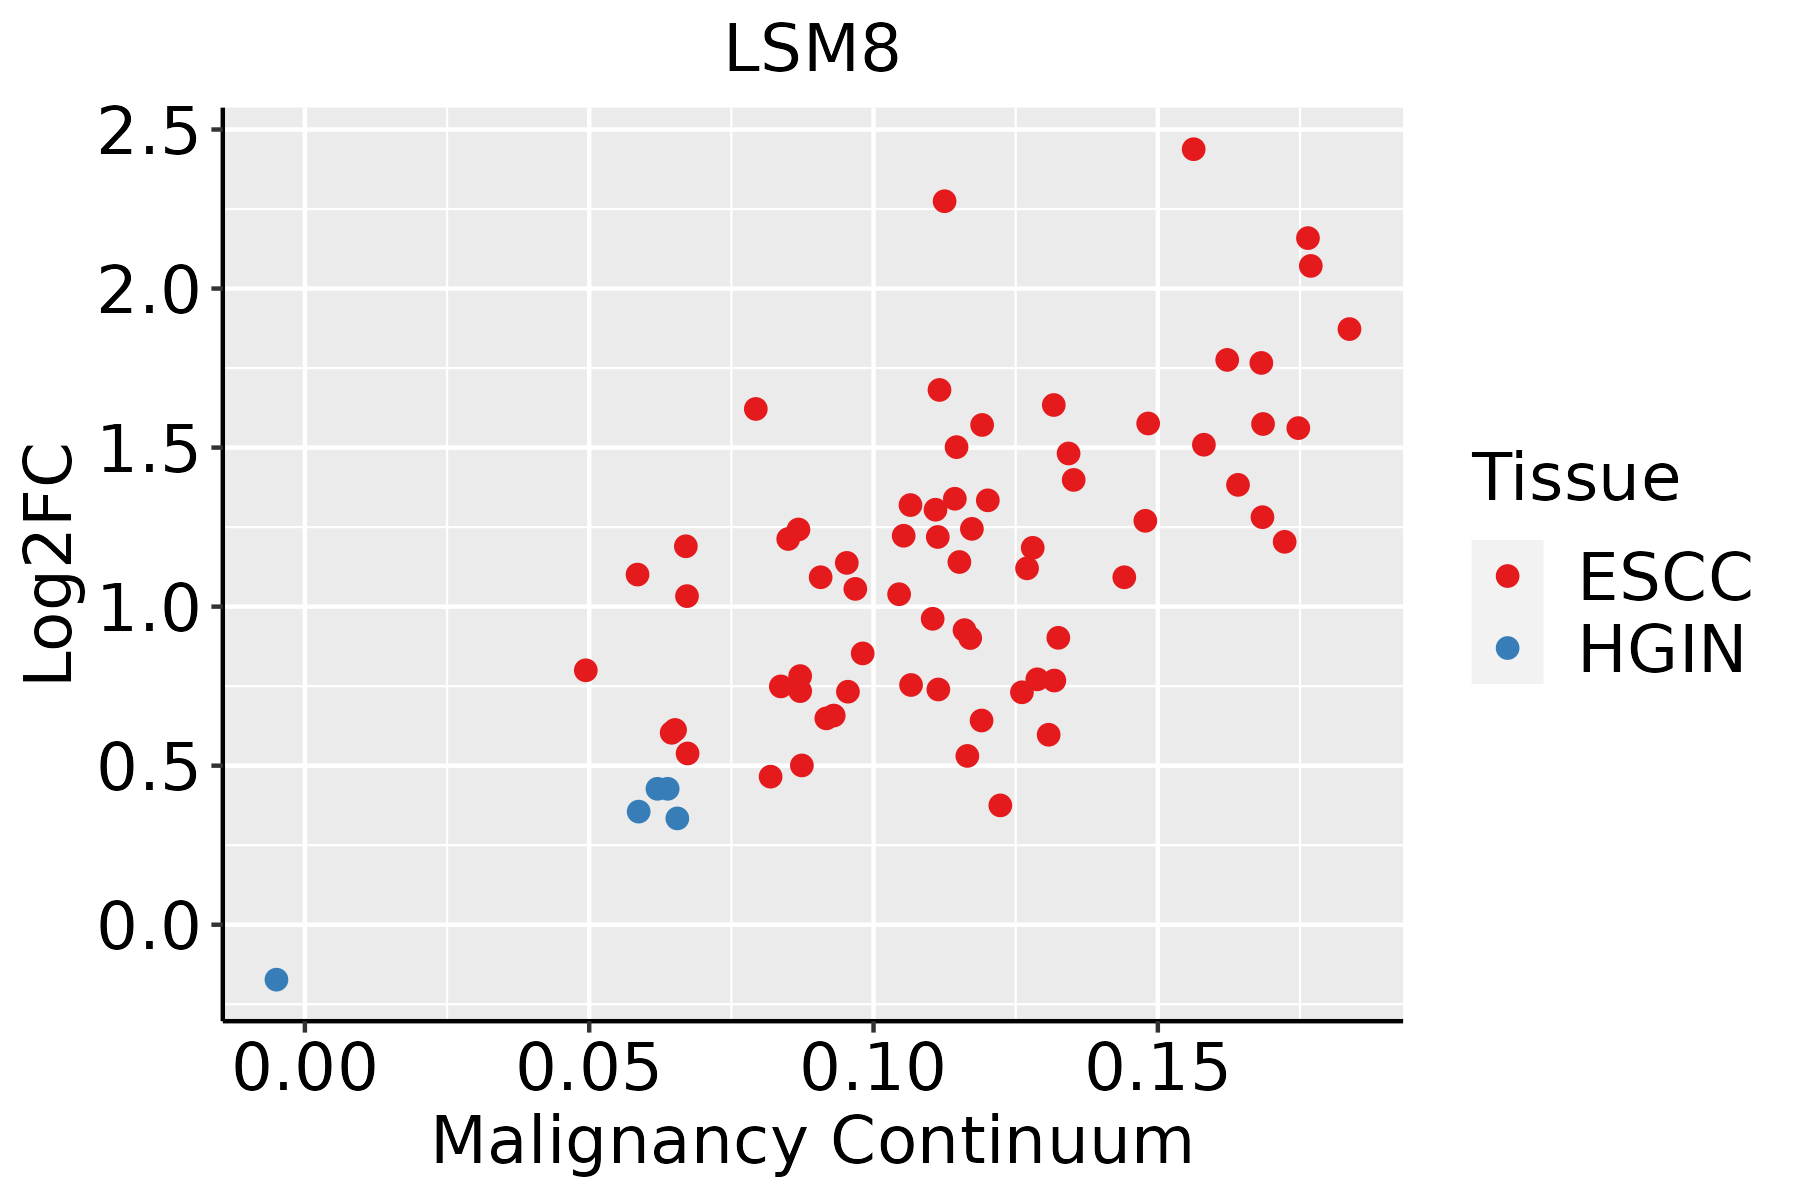 | ESCC: Esophageal squamous cell carcinoma |
| HGIN: High-grade intraepithelial neoplasias | ||
| LGIN: Low-grade intraepithelial neoplasias | ||
| Liver | 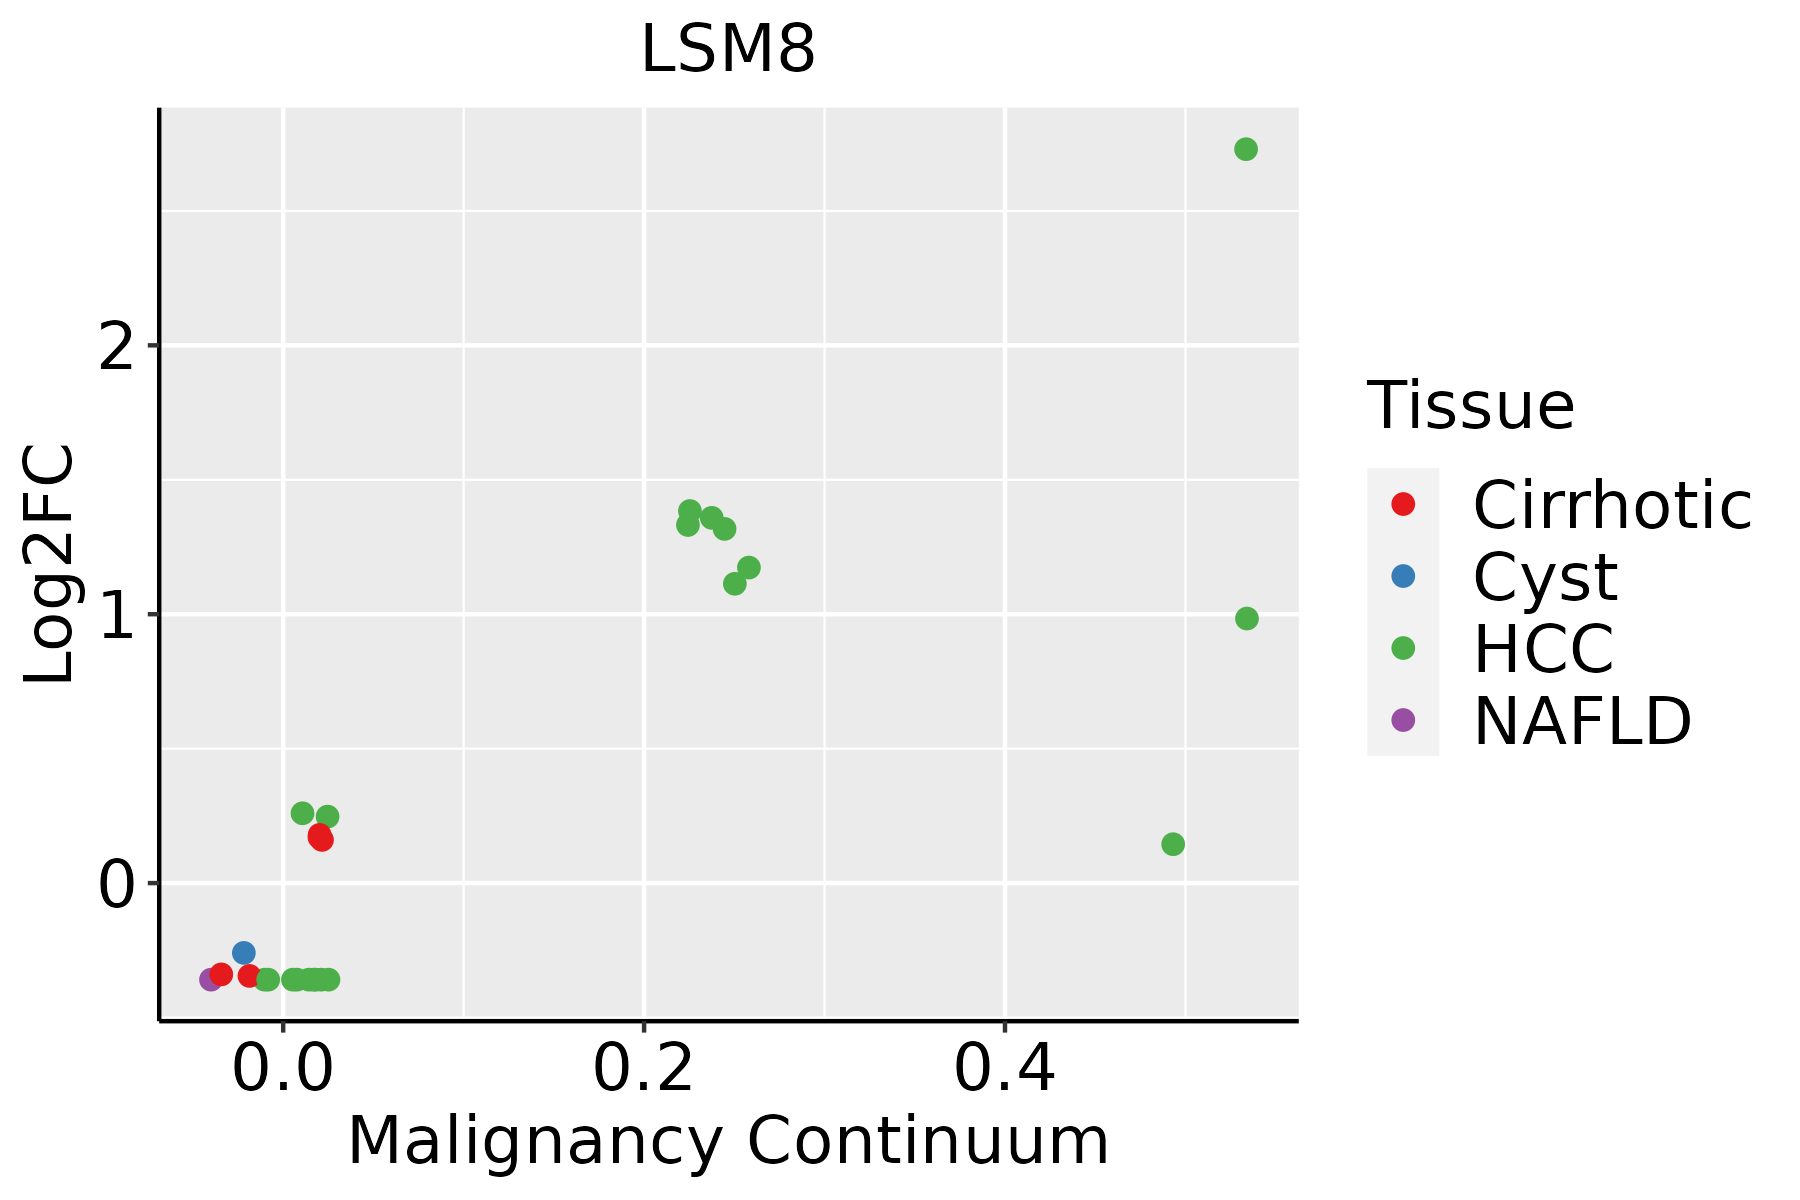 | HCC: Hepatocellular carcinoma |
| NAFLD: Non-alcoholic fatty liver disease | ||
| Oral Cavity |  | EOLP: Erosive Oral lichen planus |
| LP: leukoplakia | ||
| NEOLP: Non-erosive oral lichen planus | ||
| OSCC: Oral squamous cell carcinoma | ||
| Prostate | 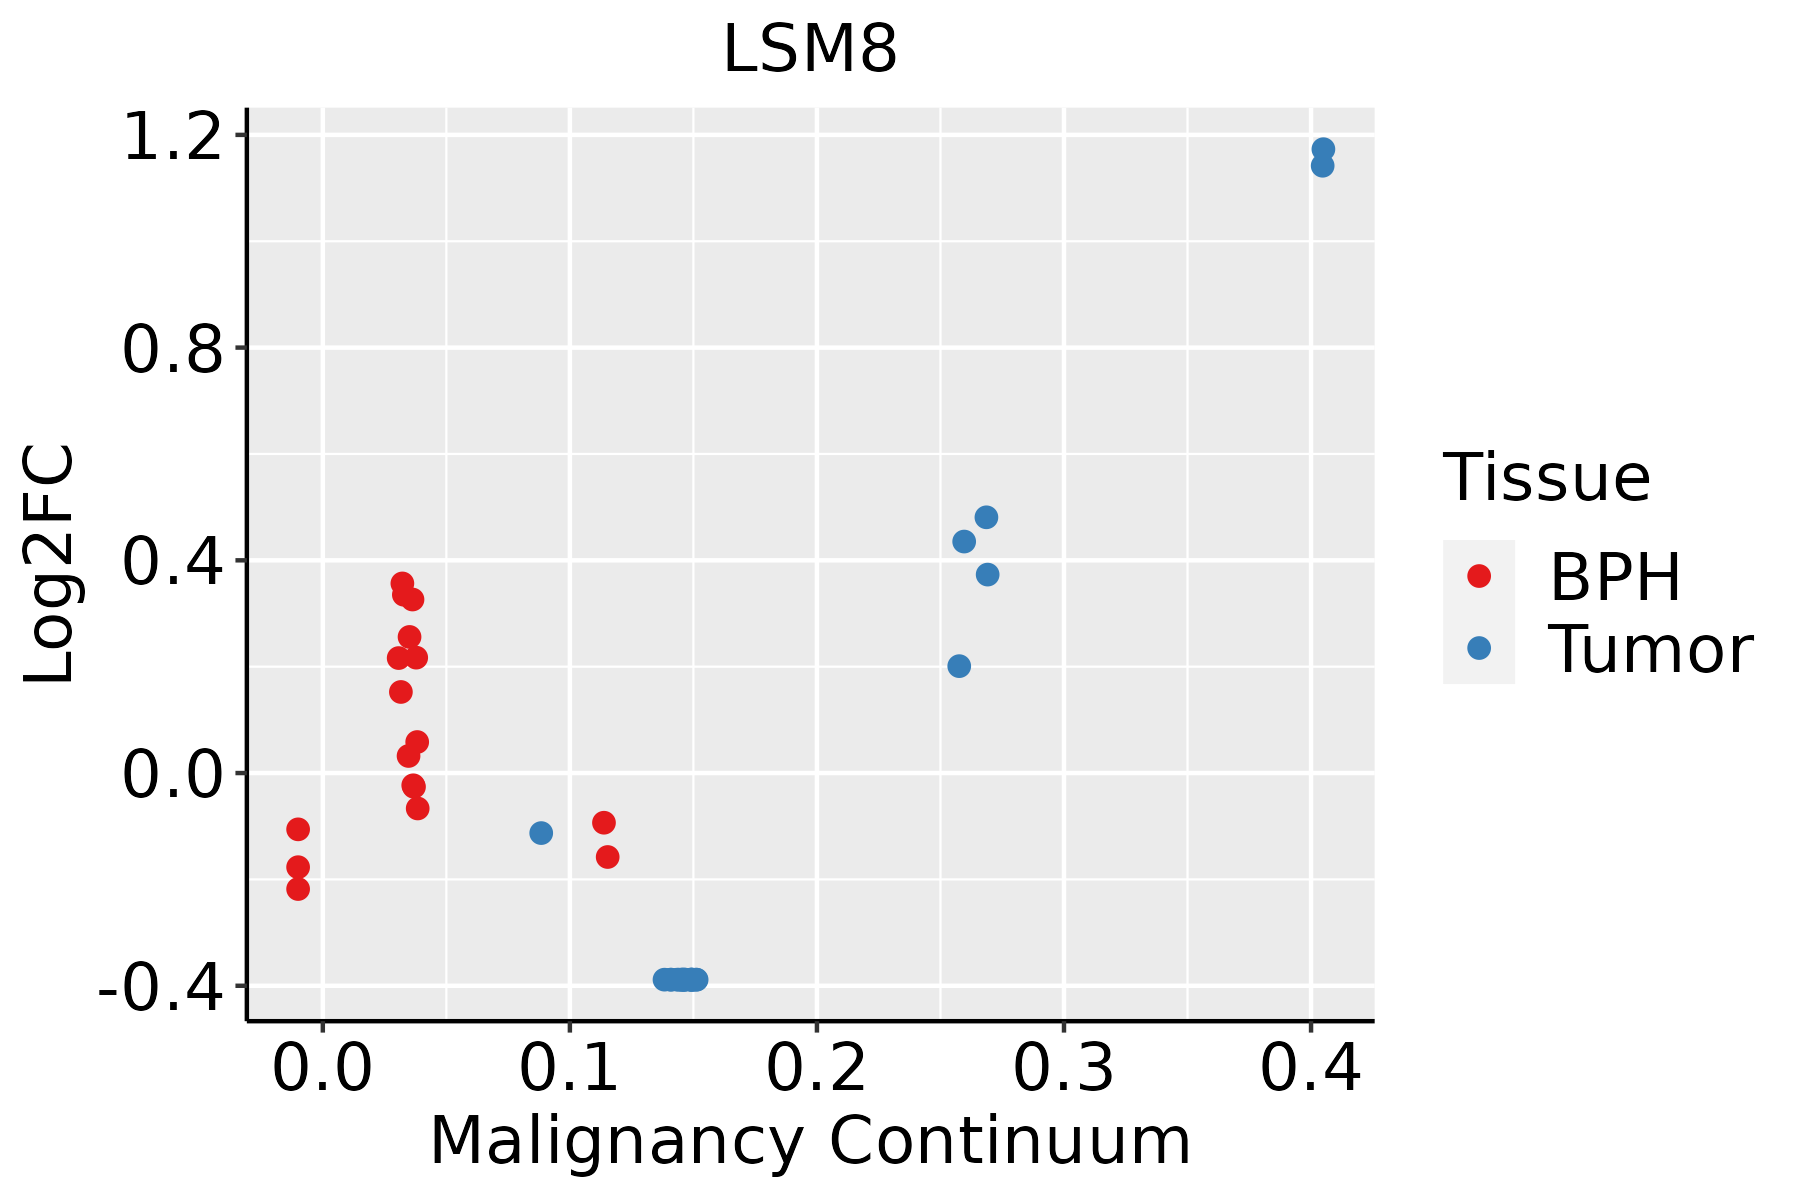 | BPH: Benign Prostatic Hyperplasia |
| Thyroid |  | ATC: Anaplastic thyroid cancer |
| HT: Hashimoto's thyroiditis | ||
| PTC: Papillary thyroid cancer |
| ∗log2FC in expression of this searched gene in stem-like cells from each diseased tissue sample relative to stem-like cells in normal samples in each tissue plotted against the malignancy continuum. Samples are colored based on if they are from different disease stage. |
Top |
Malignant transformation related pathway analysis |
| Find out the enriched GO biological processes and KEGG pathways involved in transition from healthy to precancer to cancer |
| Tissue | Disease Stage | Enriched GO biological Processes |
| Colorectum | AD |  |
| Colorectum | SER |  |
| Colorectum | MSS |  |
| Colorectum | MSI-H |  |
| Colorectum | FAP |  |
| ∗Top 15 enriched GO BP terms are showed in the bar plot of each disease state in each tissue. Each row represents a significant GO biological process which is colored according to the -log10(p.adjust). |
| Page: 1 2 3 4 5 6 7 8 9 |
| GO ID | Tissue | Disease Stage | Description | Gene Ratio | Bg Ratio | pvalue | p.adjust | Count |
| GO:000838010 | Cervix | CC | RNA splicing | 76/2311 | 434/18723 | 9.79e-04 | 8.19e-03 | 76 |
| GO:000037710 | Cervix | CC | RNA splicing, via transesterification reactions with bulged adenosine as nucleophile | 55/2311 | 320/18723 | 6.71e-03 | 3.70e-02 | 55 |
| GO:000039810 | Cervix | CC | mRNA splicing, via spliceosome | 55/2311 | 320/18723 | 6.71e-03 | 3.70e-02 | 55 |
| GO:000037510 | Cervix | CC | RNA splicing, via transesterification reactions | 55/2311 | 324/18723 | 8.61e-03 | 4.44e-02 | 55 |
| GO:000838016 | Endometrium | AEH | RNA splicing | 111/2100 | 434/18723 | 2.42e-17 | 1.12e-14 | 111 |
| GO:000037515 | Endometrium | AEH | RNA splicing, via transesterification reactions | 88/2100 | 324/18723 | 1.11e-15 | 3.91e-13 | 88 |
| GO:000037715 | Endometrium | AEH | RNA splicing, via transesterification reactions with bulged adenosine as nucleophile | 87/2100 | 320/18723 | 1.51e-15 | 4.78e-13 | 87 |
| GO:000039815 | Endometrium | AEH | mRNA splicing, via spliceosome | 87/2100 | 320/18723 | 1.51e-15 | 4.78e-13 | 87 |
| GO:000838017 | Endometrium | EEC | RNA splicing | 111/2168 | 434/18723 | 2.45e-16 | 1.13e-13 | 111 |
| GO:000037516 | Endometrium | EEC | RNA splicing, via transesterification reactions | 88/2168 | 324/18723 | 7.46e-15 | 2.63e-12 | 88 |
| GO:000037716 | Endometrium | EEC | RNA splicing, via transesterification reactions with bulged adenosine as nucleophile | 87/2168 | 320/18723 | 9.97e-15 | 3.15e-12 | 87 |
| GO:000039816 | Endometrium | EEC | mRNA splicing, via spliceosome | 87/2168 | 320/18723 | 9.97e-15 | 3.15e-12 | 87 |
| GO:000838026 | Esophagus | HGIN | RNA splicing | 160/2587 | 434/18723 | 3.74e-34 | 1.12e-30 | 160 |
| GO:000037520 | Esophagus | HGIN | RNA splicing, via transesterification reactions | 115/2587 | 324/18723 | 3.16e-23 | 3.80e-20 | 115 |
| GO:000037720 | Esophagus | HGIN | RNA splicing, via transesterification reactions with bulged adenosine as nucleophile | 113/2587 | 320/18723 | 1.24e-22 | 9.26e-20 | 113 |
| GO:000039820 | Esophagus | HGIN | mRNA splicing, via spliceosome | 113/2587 | 320/18723 | 1.24e-22 | 9.26e-20 | 113 |
| GO:0008380111 | Esophagus | ESCC | RNA splicing | 336/8552 | 434/18723 | 1.74e-42 | 3.67e-39 | 336 |
| GO:0000375111 | Esophagus | ESCC | RNA splicing, via transesterification reactions | 248/8552 | 324/18723 | 3.05e-30 | 1.49e-27 | 248 |
| GO:0000377111 | Esophagus | ESCC | RNA splicing, via transesterification reactions with bulged adenosine as nucleophile | 244/8552 | 320/18723 | 2.52e-29 | 1.07e-26 | 244 |
| GO:0000398111 | Esophagus | ESCC | mRNA splicing, via spliceosome | 244/8552 | 320/18723 | 2.52e-29 | 1.07e-26 | 244 |
| Page: 1 2 3 |
| Pathway ID | Tissue | Disease Stage | Description | Gene Ratio | Bg Ratio | pvalue | p.adjust | qvalue | Count |
| hsa030409 | Endometrium | AEH | Spliceosome | 54/1197 | 217/8465 | 1.47e-05 | 1.65e-04 | 1.21e-04 | 54 |
| hsa0304014 | Endometrium | AEH | Spliceosome | 54/1197 | 217/8465 | 1.47e-05 | 1.65e-04 | 1.21e-04 | 54 |
| hsa0304024 | Endometrium | EEC | Spliceosome | 54/1237 | 217/8465 | 3.78e-05 | 3.88e-04 | 2.89e-04 | 54 |
| hsa030187 | Endometrium | EEC | RNA degradation | 20/1237 | 79/8465 | 8.36e-03 | 3.88e-02 | 2.89e-02 | 20 |
| hsa0304034 | Endometrium | EEC | Spliceosome | 54/1237 | 217/8465 | 3.78e-05 | 3.88e-04 | 2.89e-04 | 54 |
| hsa0301812 | Endometrium | EEC | RNA degradation | 20/1237 | 79/8465 | 8.36e-03 | 3.88e-02 | 2.89e-02 | 20 |
| hsa0304018 | Esophagus | HGIN | Spliceosome | 79/1383 | 217/8465 | 3.22e-13 | 7.00e-12 | 5.56e-12 | 79 |
| hsa0301810 | Esophagus | HGIN | RNA degradation | 27/1383 | 79/8465 | 7.73e-05 | 9.00e-04 | 7.15e-04 | 27 |
| hsa0304019 | Esophagus | HGIN | Spliceosome | 79/1383 | 217/8465 | 3.22e-13 | 7.00e-12 | 5.56e-12 | 79 |
| hsa0301815 | Esophagus | HGIN | RNA degradation | 27/1383 | 79/8465 | 7.73e-05 | 9.00e-04 | 7.15e-04 | 27 |
| hsa0301824 | Esophagus | ESCC | RNA degradation | 62/4205 | 79/8465 | 1.18e-07 | 9.39e-07 | 4.81e-07 | 62 |
| hsa0304027 | Esophagus | ESCC | Spliceosome | 128/4205 | 217/8465 | 3.31e-03 | 8.79e-03 | 4.50e-03 | 128 |
| hsa0301834 | Esophagus | ESCC | RNA degradation | 62/4205 | 79/8465 | 1.18e-07 | 9.39e-07 | 4.81e-07 | 62 |
| hsa0304037 | Esophagus | ESCC | Spliceosome | 128/4205 | 217/8465 | 3.31e-03 | 8.79e-03 | 4.50e-03 | 128 |
| hsa030407 | Liver | Cirrhotic | Spliceosome | 102/2530 | 217/8465 | 5.69e-08 | 9.47e-07 | 5.84e-07 | 102 |
| hsa03018 | Liver | Cirrhotic | RNA degradation | 44/2530 | 79/8465 | 1.43e-06 | 1.65e-05 | 1.02e-05 | 44 |
| hsa0304012 | Liver | Cirrhotic | Spliceosome | 102/2530 | 217/8465 | 5.69e-08 | 9.47e-07 | 5.84e-07 | 102 |
| hsa030181 | Liver | Cirrhotic | RNA degradation | 44/2530 | 79/8465 | 1.43e-06 | 1.65e-05 | 1.02e-05 | 44 |
| hsa030182 | Liver | HCC | RNA degradation | 58/4020 | 79/8465 | 2.29e-06 | 2.19e-05 | 1.22e-05 | 58 |
| hsa0304022 | Liver | HCC | Spliceosome | 122/4020 | 217/8465 | 5.55e-03 | 1.60e-02 | 8.91e-03 | 122 |
| Page: 1 2 |
Top |
Cell-cell communication analysis |
| Identification of potential cell-cell interactions between two cell types and their ligand-receptor pairs for different disease states |
| Ligand | Receptor | LRpair | Pathway | Tissue | Disease Stage |
| Page: 1 |
Top |
Single-cell gene regulatory network inference analysis |
| Find out the significant the regulons (TFs) and the target genes of each regulon across cell types for different disease states |
| TF | Cell Type | Tissue | Disease Stage | Target Gene | RSS | Regulon Activity |
| ∗The dot plots of a searched regulon are shown for all cell subpopulations in each disease state of each tissue based on the regulon specific score inferred using pySCENIC and by calculating the average expression. |
| Page: 1 |
Top |
Somatic mutation of malignant transformation related genes |
| Annotation of somatic variants for genes involved in malignant transformation |
| Hugo Symbol | Variant Class | Variant Classification | dbSNP RS | HGVSc | HGVSp | HGVSp Short | SWISSPROT | BIOTYPE | SIFT | PolyPhen | Tumor Sample Barcode | Tissue | Histology | Sex | Age | Stage | Therapy Types | Drugs | Outcome |
| LSM8 | deletion | Frame_Shift_Del | c.139delN | p.Ser47AlafsTer6 | p.S47Afs*6 | O95777 | protein_coding | TCGA-D8-A27V-01 | Breast | breast invasive carcinoma | Female | <65 | I/II | Hormone Therapy | tamoxiphen | SD | |||
| LSM8 | SNV | Missense_Mutation | c.250G>A | p.Gly84Arg | p.G84R | O95777 | protein_coding | deleterious(0.05) | benign(0.045) | TCGA-D1-A17Q-01 | Endometrium | uterine corpus endometrioid carcinoma | Female | <65 | I/II | Unknown | Unknown | SD | |
| LSM8 | SNV | Missense_Mutation | c.114N>T | p.Leu38Phe | p.L38F | O95777 | protein_coding | deleterious(0) | probably_damaging(0.997) | TCGA-BC-A10T-01 | Liver | liver hepatocellular carcinoma | Male | >=65 | III/IV | Unknown | Unknown | PD | |
| LSM8 | SNV | Missense_Mutation | c.139N>T | p.Ser47Cys | p.S47C | O95777 | protein_coding | deleterious(0) | probably_damaging(0.994) | TCGA-21-5787-01 | Lung | lung squamous cell carcinoma | Male | >=65 | III/IV | Unknown | Unknown | PD | |
| LSM8 | SNV | Missense_Mutation | c.114N>T | p.Leu38Phe | p.L38F | O95777 | protein_coding | deleterious(0) | probably_damaging(0.997) | TCGA-21-A5DI-01 | Lung | lung squamous cell carcinoma | Male | >=65 | I/II | Unknown | Unknown | SD | |
| LSM8 | SNV | Missense_Mutation | c.184N>T | p.Val62Leu | p.V62L | O95777 | protein_coding | tolerated(0.15) | benign(0.052) | TCGA-22-5480-01 | Lung | lung squamous cell carcinoma | Female | >=65 | I/II | Chemotherapy | gemzar | PD | |
| LSM8 | SNV | Missense_Mutation | novel | c.125N>G | p.His42Arg | p.H42R | O95777 | protein_coding | tolerated(0.15) | benign(0.06) | TCGA-77-8130-01 | Lung | lung squamous cell carcinoma | Male | >=65 | I/II | Unknown | Unknown | PD |
| LSM8 | SNV | Missense_Mutation | rs201785919 | c.220N>A | p.Asp74Asn | p.D74N | O95777 | protein_coding | deleterious(0.03) | benign(0.147) | TCGA-VQ-A8P2-01 | Stomach | stomach adenocarcinoma | Male | >=65 | III/IV | Unspecific | Complete Response |
| Page: 1 |
Top |
Related drugs of malignant transformation related genes |
| Identification of chemicals and drugs interact with genes involved in malignant transfromation |
| (DGIdb 4.0) |
| Entrez ID | Symbol | Category | Interaction Types | Drug Claim Name | Drug Name | PMIDs |
| Page: 1 |

Copyright 2023-Present -The University of Texas Health Science Center at Houston |