
|
|||||
|
 | |
| |
| |
| |
| |
| |
|
Gene: LSM14B |
Gene summary for LSM14B |
| Gene information | Species | Human | Gene symbol | LSM14B | Gene ID | 149986 |
| Gene name | LSM family member 14B | |
| Gene Alias | C20orf40 | |
| Cytomap | 20q13.33 | |
| Gene Type | protein-coding | GO ID | GO:0006412 | UniProtAcc | Q9BX40 |
Top |
Malignant transformation analysis |
| Identification of the aberrant gene expression in precancerous and cancerous lesions by comparing the gene expression of stem-like cells in diseased tissues with normal stem cells |
| Entrez ID | Symbol | Replicates | Species | Organ | Tissue | Adj P-value | Log2FC | Malignancy |
| 149986 | LSM14B | LZE2T | Human | Esophagus | ESCC | 1.47e-04 | 3.17e-01 | 0.082 |
| 149986 | LSM14B | LZE7T | Human | Esophagus | ESCC | 5.57e-03 | 9.39e-02 | 0.0667 |
| 149986 | LSM14B | LZE24T | Human | Esophagus | ESCC | 3.18e-07 | 5.35e-02 | 0.0596 |
| 149986 | LSM14B | P2T-E | Human | Esophagus | ESCC | 1.89e-09 | 1.50e-01 | 0.1177 |
| 149986 | LSM14B | P4T-E | Human | Esophagus | ESCC | 9.63e-11 | 1.24e-01 | 0.1323 |
| 149986 | LSM14B | P5T-E | Human | Esophagus | ESCC | 2.61e-06 | 1.04e-01 | 0.1327 |
| 149986 | LSM14B | P8T-E | Human | Esophagus | ESCC | 1.53e-07 | 6.05e-02 | 0.0889 |
| 149986 | LSM14B | P9T-E | Human | Esophagus | ESCC | 2.25e-06 | 4.15e-02 | 0.1131 |
| 149986 | LSM14B | P10T-E | Human | Esophagus | ESCC | 2.37e-14 | 1.94e-01 | 0.116 |
| 149986 | LSM14B | P11T-E | Human | Esophagus | ESCC | 1.29e-10 | 1.77e-01 | 0.1426 |
| 149986 | LSM14B | P12T-E | Human | Esophagus | ESCC | 9.20e-10 | 2.06e-01 | 0.1122 |
| 149986 | LSM14B | P15T-E | Human | Esophagus | ESCC | 5.98e-10 | 1.18e-01 | 0.1149 |
| 149986 | LSM14B | P16T-E | Human | Esophagus | ESCC | 1.29e-18 | 1.58e-01 | 0.1153 |
| 149986 | LSM14B | P17T-E | Human | Esophagus | ESCC | 6.01e-03 | 7.85e-02 | 0.1278 |
| 149986 | LSM14B | P20T-E | Human | Esophagus | ESCC | 8.07e-15 | 2.05e-01 | 0.1124 |
| 149986 | LSM14B | P21T-E | Human | Esophagus | ESCC | 2.52e-11 | 1.18e-01 | 0.1617 |
| 149986 | LSM14B | P22T-E | Human | Esophagus | ESCC | 1.06e-05 | 7.81e-02 | 0.1236 |
| 149986 | LSM14B | P23T-E | Human | Esophagus | ESCC | 1.94e-16 | 1.61e-01 | 0.108 |
| 149986 | LSM14B | P24T-E | Human | Esophagus | ESCC | 1.06e-03 | 1.20e-01 | 0.1287 |
| 149986 | LSM14B | P26T-E | Human | Esophagus | ESCC | 5.57e-10 | 1.28e-01 | 0.1276 |
| Page: 1 2 3 |
| Tissue | Expression Dynamics | Abbreviation |
| Esophagus | 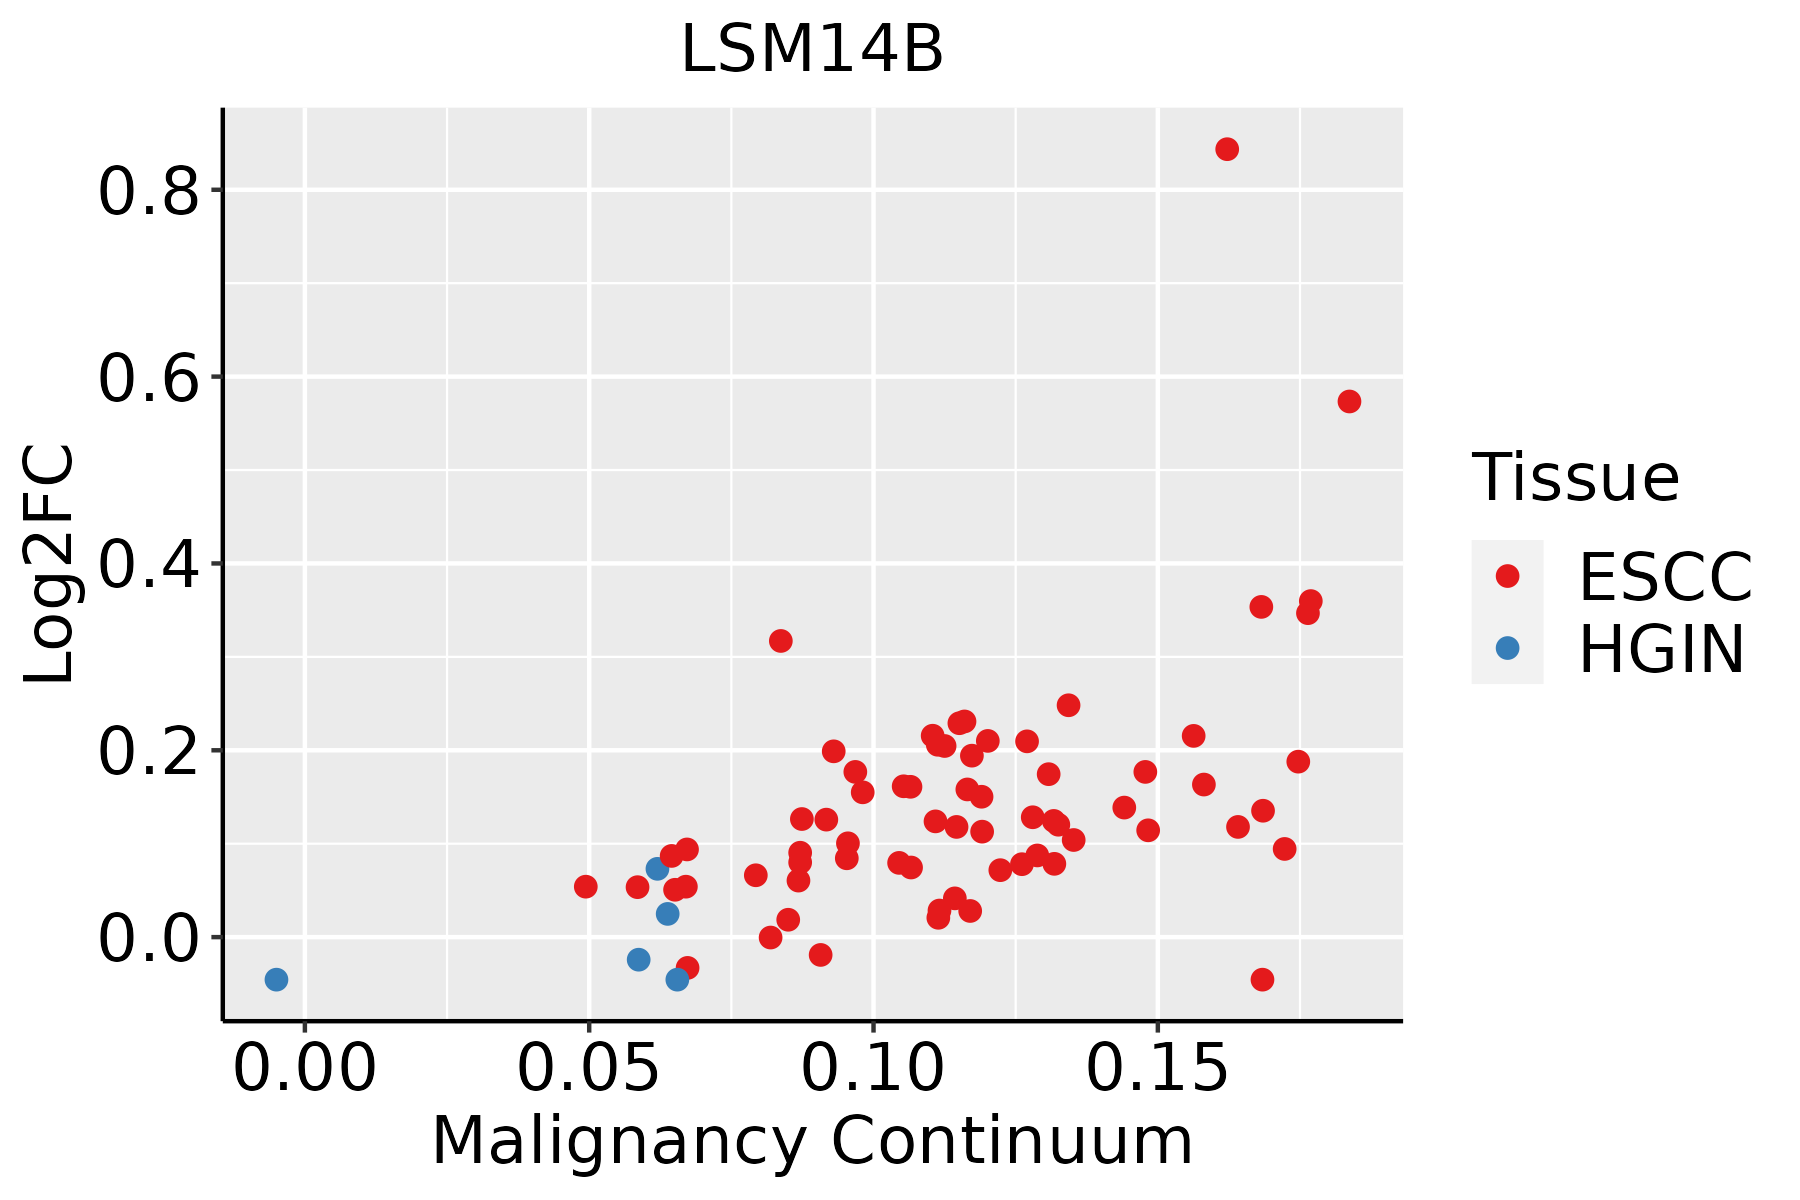 | ESCC: Esophageal squamous cell carcinoma |
| HGIN: High-grade intraepithelial neoplasias | ||
| LGIN: Low-grade intraepithelial neoplasias |
| ∗log2FC in expression of this searched gene in stem-like cells from each diseased tissue sample relative to stem-like cells in normal samples in each tissue plotted against the malignancy continuum. Samples are colored based on if they are from different disease stage. |
Top |
Malignant transformation related pathway analysis |
| Find out the enriched GO biological processes and KEGG pathways involved in transition from healthy to precancer to cancer |
| Tissue | Disease Stage | Enriched GO biological Processes |
| Colorectum | AD |  |
| Colorectum | SER |  |
| Colorectum | MSS |  |
| Colorectum | MSI-H |  |
| Colorectum | FAP |  |
| ∗Top 15 enriched GO BP terms are showed in the bar plot of each disease state in each tissue. Each row represents a significant GO biological process which is colored according to the -log10(p.adjust). |
| Page: 1 2 3 4 5 6 7 8 9 |
| GO ID | Tissue | Disease Stage | Description | Gene Ratio | Bg Ratio | pvalue | p.adjust | Count |
| GO:0006417111 | Esophagus | ESCC | regulation of translation | 304/8552 | 468/18723 | 1.53e-17 | 1.33e-15 | 304 |
| Page: 1 |
| Pathway ID | Tissue | Disease Stage | Description | Gene Ratio | Bg Ratio | pvalue | p.adjust | qvalue | Count |
| Page: 1 |
Top |
Cell-cell communication analysis |
| Identification of potential cell-cell interactions between two cell types and their ligand-receptor pairs for different disease states |
| Ligand | Receptor | LRpair | Pathway | Tissue | Disease Stage |
| Page: 1 |
Top |
Single-cell gene regulatory network inference analysis |
| Find out the significant the regulons (TFs) and the target genes of each regulon across cell types for different disease states |
| TF | Cell Type | Tissue | Disease Stage | Target Gene | RSS | Regulon Activity |
| ∗The dot plots of a searched regulon are shown for all cell subpopulations in each disease state of each tissue based on the regulon specific score inferred using pySCENIC and by calculating the average expression. |
| Page: 1 |
Top |
Somatic mutation of malignant transformation related genes |
| Annotation of somatic variants for genes involved in malignant transformation |
| Hugo Symbol | Variant Class | Variant Classification | dbSNP RS | HGVSc | HGVSp | HGVSp Short | SWISSPROT | BIOTYPE | SIFT | PolyPhen | Tumor Sample Barcode | Tissue | Histology | Sex | Age | Stage | Therapy Types | Drugs | Outcome |
| LSM14B | SNV | Missense_Mutation | c.1076N>C | p.Arg359Pro | p.R359P | Q9BX40 | protein_coding | deleterious(0.02) | possibly_damaging(0.615) | TCGA-AN-A04D-01 | Breast | breast invasive carcinoma | Female | <65 | I/II | Unknown | Unknown | SD | |
| LSM14B | SNV | Missense_Mutation | c.154N>T | p.Pro52Ser | p.P52S | Q9BX40 | protein_coding | deleterious(0.01) | probably_damaging(0.999) | TCGA-AR-A251-01 | Breast | breast invasive carcinoma | Female | <65 | III/IV | Chemotherapy | doxorubicin | SD | |
| LSM14B | SNV | Missense_Mutation | c.842A>T | p.Lys281Met | p.K281M | Q9BX40 | protein_coding | deleterious(0) | possibly_damaging(0.905) | TCGA-E9-A1RH-01 | Breast | breast invasive carcinoma | Female | <65 | I/II | Chemotherapy | 5-fluorouracil | SD | |
| LSM14B | SNV | Missense_Mutation | rs755543275 | c.995N>A | p.Arg332Gln | p.R332Q | Q9BX40 | protein_coding | deleterious(0) | probably_damaging(0.994) | TCGA-EA-A410-01 | Cervix | cervical & endocervical cancer | Female | <65 | I/II | Unknown | Unknown | SD |
| LSM14B | SNV | Missense_Mutation | novel | c.241N>C | p.Glu81Gln | p.E81Q | Q9BX40 | protein_coding | deleterious(0) | probably_damaging(0.996) | TCGA-JW-AAVH-01 | Cervix | cervical & endocervical cancer | Female | <65 | I/II | Unknown | Unknown | SD |
| LSM14B | SNV | Missense_Mutation | c.1009N>A | p.Glu337Lys | p.E337K | Q9BX40 | protein_coding | deleterious(0) | probably_damaging(0.995) | TCGA-AA-3811-01 | Colorectum | colon adenocarcinoma | Female | >=65 | III/IV | Unknown | Unknown | PD | |
| LSM14B | SNV | Missense_Mutation | novel | c.216N>A | p.Ser72Arg | p.S72R | Q9BX40 | protein_coding | deleterious(0) | probably_damaging(0.996) | TCGA-AA-3949-01 | Colorectum | colon adenocarcinoma | Female | >=65 | III/IV | Unknown | Unknown | SD |
| LSM14B | SNV | Missense_Mutation | novel | c.39G>T | p.Lys13Asn | p.K13N | Q9BX40 | protein_coding | deleterious(0.01) | possibly_damaging(0.729) | TCGA-AA-A00N-01 | Colorectum | colon adenocarcinoma | Male | >=65 | I/II | Unknown | Unknown | PD |
| LSM14B | SNV | Missense_Mutation | c.152G>A | p.Arg51His | p.R51H | Q9BX40 | protein_coding | deleterious(0) | probably_damaging(0.998) | TCGA-NH-A5IV-01 | Colorectum | colon adenocarcinoma | Female | >=65 | I/II | Unknown | Unknown | SD | |
| LSM14B | SNV | Missense_Mutation | novel | c.412N>A | p.Ala138Thr | p.A138T | Q9BX40 | protein_coding | tolerated(0.08) | benign(0.078) | TCGA-A5-A0G2-01 | Endometrium | uterine corpus endometrioid carcinoma | Female | <65 | III/IV | Unknown | Unknown | SD |
| Page: 1 2 3 4 |
Top |
Related drugs of malignant transformation related genes |
| Identification of chemicals and drugs interact with genes involved in malignant transfromation |
| (DGIdb 4.0) |
| Entrez ID | Symbol | Category | Interaction Types | Drug Claim Name | Drug Name | PMIDs |
| Page: 1 |

Copyright 2023-Present -The University of Texas Health Science Center at Houston |