
|
|||||
|
 | |
| |
| |
| |
| |
| |
|
Gene: LSM11 |
Gene summary for LSM11 |
| Gene information | Species | Human | Gene symbol | LSM11 | Gene ID | 134353 |
| Gene name | LSM11, U7 small nuclear RNA associated | |
| Gene Alias | AGS8 | |
| Cytomap | 5q33.3 | |
| Gene Type | protein-coding | GO ID | GO:0000082 | UniProtAcc | P83369 |
Top |
Malignant transformation analysis |
| Identification of the aberrant gene expression in precancerous and cancerous lesions by comparing the gene expression of stem-like cells in diseased tissues with normal stem cells |
| Entrez ID | Symbol | Replicates | Species | Organ | Tissue | Adj P-value | Log2FC | Malignancy |
| 134353 | LSM11 | HCC1_Meng | Human | Liver | HCC | 1.49e-15 | 4.29e-03 | 0.0246 |
| 134353 | LSM11 | HCC1 | Human | Liver | HCC | 4.42e-19 | 1.68e+00 | 0.5336 |
| 134353 | LSM11 | HCC2 | Human | Liver | HCC | 2.54e-30 | 2.05e+00 | 0.5341 |
| 134353 | LSM11 | HCC5 | Human | Liver | HCC | 8.28e-21 | 1.94e+00 | 0.4932 |
| Page: 1 |
| Tissue | Expression Dynamics | Abbreviation |
| Liver | 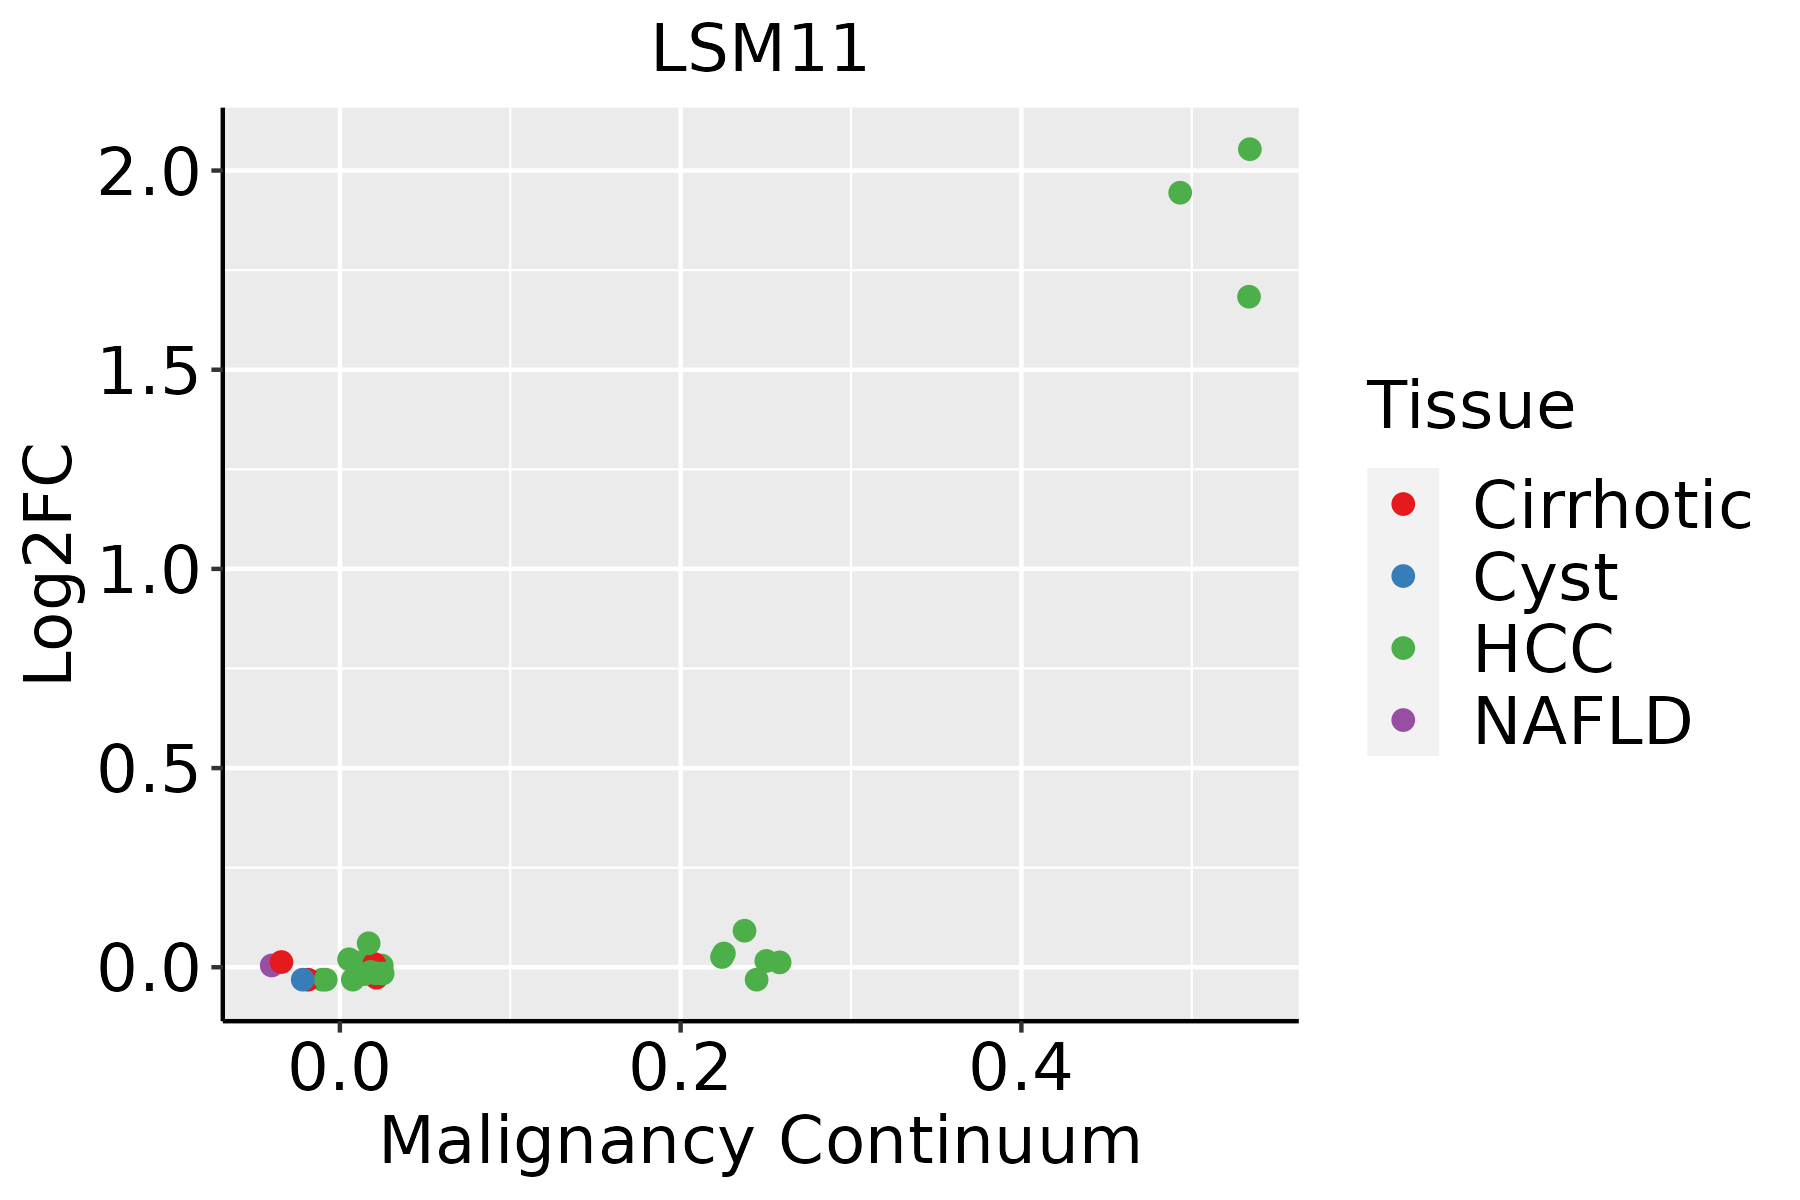 | HCC: Hepatocellular carcinoma |
| NAFLD: Non-alcoholic fatty liver disease |
| ∗log2FC in expression of this searched gene in stem-like cells from each diseased tissue sample relative to stem-like cells in normal samples in each tissue plotted against the malignancy continuum. Samples are colored based on if they are from different disease stage. |
Top |
Malignant transformation related pathway analysis |
| Find out the enriched GO biological processes and KEGG pathways involved in transition from healthy to precancer to cancer |
| Tissue | Disease Stage | Enriched GO biological Processes |
| Colorectum | AD |  |
| Colorectum | SER |  |
| Colorectum | MSS |  |
| Colorectum | MSI-H |  |
| Colorectum | FAP |  |
| ∗Top 15 enriched GO BP terms are showed in the bar plot of each disease state in each tissue. Each row represents a significant GO biological process which is colored according to the -log10(p.adjust). |
| Page: 1 2 3 4 5 6 7 8 9 |
| GO ID | Tissue | Disease Stage | Description | Gene Ratio | Bg Ratio | pvalue | p.adjust | Count |
| GO:00311241 | Liver | HCC | mRNA 3'-end processing | 50/7958 | 62/18723 | 8.44e-10 | 2.60e-08 | 50 |
| GO:00311231 | Liver | HCC | RNA 3'-end processing | 81/7958 | 116/18723 | 2.27e-09 | 6.32e-08 | 81 |
| GO:00447722 | Liver | HCC | mitotic cell cycle phase transition | 240/7958 | 424/18723 | 2.47e-09 | 6.84e-08 | 240 |
| GO:000734611 | Liver | HCC | regulation of mitotic cell cycle | 255/7958 | 457/18723 | 4.96e-09 | 1.30e-07 | 255 |
| GO:19019901 | Liver | HCC | regulation of mitotic cell cycle phase transition | 167/7958 | 299/18723 | 1.96e-06 | 2.71e-05 | 167 |
| GO:19019871 | Liver | HCC | regulation of cell cycle phase transition | 211/7958 | 390/18723 | 2.11e-06 | 2.89e-05 | 211 |
| GO:004578711 | Liver | HCC | positive regulation of cell cycle | 172/7958 | 313/18723 | 5.29e-06 | 6.58e-05 | 172 |
| GO:00448432 | Liver | HCC | cell cycle G1/S phase transition | 134/7958 | 241/18723 | 2.60e-05 | 2.70e-04 | 134 |
| GO:00000822 | Liver | HCC | G1/S transition of mitotic cell cycle | 119/7958 | 214/18723 | 7.11e-05 | 6.39e-04 | 119 |
| GO:00900683 | Liver | HCC | positive regulation of cell cycle process | 125/7958 | 236/18723 | 7.21e-04 | 4.40e-03 | 125 |
| GO:004593111 | Liver | HCC | positive regulation of mitotic cell cycle | 69/7958 | 121/18723 | 8.79e-04 | 5.20e-03 | 69 |
| GO:1902806 | Liver | HCC | regulation of cell cycle G1/S phase transition | 91/7958 | 168/18723 | 1.47e-03 | 7.79e-03 | 91 |
| GO:20000451 | Liver | HCC | regulation of G1/S transition of mitotic cell cycle | 77/7958 | 142/18723 | 3.13e-03 | 1.45e-02 | 77 |
| GO:0008334 | Liver | HCC | histone mRNA metabolic process | 13/7958 | 17/18723 | 4.77e-03 | 2.02e-02 | 13 |
| GO:1901989 | Liver | HCC | positive regulation of cell cycle phase transition | 63/7958 | 115/18723 | 5.21e-03 | 2.18e-02 | 63 |
| GO:19019921 | Liver | HCC | positive regulation of mitotic cell cycle phase transition | 51/7958 | 93/18723 | 1.09e-02 | 4.04e-02 | 51 |
| Page: 1 |
| Pathway ID | Tissue | Disease Stage | Description | Gene Ratio | Bg Ratio | pvalue | p.adjust | qvalue | Count |
| Page: 1 |
Top |
Cell-cell communication analysis |
| Identification of potential cell-cell interactions between two cell types and their ligand-receptor pairs for different disease states |
| Ligand | Receptor | LRpair | Pathway | Tissue | Disease Stage |
| Page: 1 |
Top |
Single-cell gene regulatory network inference analysis |
| Find out the significant the regulons (TFs) and the target genes of each regulon across cell types for different disease states |
| TF | Cell Type | Tissue | Disease Stage | Target Gene | RSS | Regulon Activity |
| ∗The dot plots of a searched regulon are shown for all cell subpopulations in each disease state of each tissue based on the regulon specific score inferred using pySCENIC and by calculating the average expression. |
| Page: 1 |
Top |
Somatic mutation of malignant transformation related genes |
| Annotation of somatic variants for genes involved in malignant transformation |
| Hugo Symbol | Variant Class | Variant Classification | dbSNP RS | HGVSc | HGVSp | HGVSp Short | SWISSPROT | BIOTYPE | SIFT | PolyPhen | Tumor Sample Barcode | Tissue | Histology | Sex | Age | Stage | Therapy Types | Drugs | Outcome |
| LSM11 | SNV | Missense_Mutation | c.538N>T | p.Arg180Trp | p.R180W | P83369 | protein_coding | deleterious(0) | probably_damaging(1) | TCGA-AN-A046-01 | Breast | breast invasive carcinoma | Female | >=65 | I/II | Unknown | Unknown | SD | |
| LSM11 | SNV | Missense_Mutation | c.547N>C | p.Cys183Arg | p.C183R | P83369 | protein_coding | deleterious(0) | probably_damaging(0.999) | TCGA-B6-A0RO-01 | Breast | breast invasive carcinoma | Female | >=65 | III/IV | Unknown | Unknown | SD | |
| LSM11 | SNV | Missense_Mutation | c.878N>G | p.Ser293Cys | p.S293C | P83369 | protein_coding | tolerated(0.09) | possibly_damaging(0.862) | TCGA-D8-A1JG-01 | Breast | breast invasive carcinoma | Female | <65 | I/II | Chemotherapy | doxorubicin | SD | |
| LSM11 | SNV | Missense_Mutation | rs763310569 | c.907C>T | p.Arg303Trp | p.R303W | P83369 | protein_coding | deleterious(0) | benign(0.226) | TCGA-D8-A1Y1-01 | Breast | breast invasive carcinoma | Female | >=65 | III/IV | Hormone Therapy | tamoxiphen | PD |
| LSM11 | SNV | Missense_Mutation | rs141199540 | c.490N>T | p.Arg164Cys | p.R164C | P83369 | protein_coding | deleterious(0) | probably_damaging(0.926) | TCGA-A6-3808-01 | Colorectum | colon adenocarcinoma | Male | >=65 | I/II | Unknown | Unknown | SD |
| LSM11 | SNV | Missense_Mutation | c.538C>T | p.Arg180Trp | p.R180W | P83369 | protein_coding | deleterious(0) | probably_damaging(1) | TCGA-AG-A002-01 | Colorectum | rectum adenocarcinoma | Male | <65 | I/II | Unknown | Unknown | SD | |
| LSM11 | SNV | Missense_Mutation | c.538C>T | p.Arg180Trp | p.R180W | P83369 | protein_coding | deleterious(0) | probably_damaging(1) | TCGA-AP-A056-01 | Endometrium | uterine corpus endometrioid carcinoma | Female | <65 | I/II | Unknown | Unknown | SD | |
| LSM11 | SNV | Missense_Mutation | c.538C>T | p.Arg180Trp | p.R180W | P83369 | protein_coding | deleterious(0) | probably_damaging(1) | TCGA-AP-A0LM-01 | Endometrium | uterine corpus endometrioid carcinoma | Female | <65 | III/IV | Chemotherapy | cisplatin | SD | |
| LSM11 | SNV | Missense_Mutation | c.653N>A | p.Ser218Tyr | p.S218Y | P83369 | protein_coding | deleterious(0.01) | possibly_damaging(0.837) | TCGA-AX-A05Z-01 | Endometrium | uterine corpus endometrioid carcinoma | Female | <65 | III/IV | Chemotherapy | adriamycin | SD | |
| LSM11 | SNV | Missense_Mutation | novel | c.845N>A | p.Pro282His | p.P282H | P83369 | protein_coding | deleterious(0.01) | possibly_damaging(0.862) | TCGA-AX-A1CE-01 | Endometrium | uterine corpus endometrioid carcinoma | Female | <65 | I/II | Unspecific | Paclitaxel | SD |
| Page: 1 2 3 |
Top |
Related drugs of malignant transformation related genes |
| Identification of chemicals and drugs interact with genes involved in malignant transfromation |
| (DGIdb 4.0) |
| Entrez ID | Symbol | Category | Interaction Types | Drug Claim Name | Drug Name | PMIDs |
| Page: 1 |

Copyright 2023-Present -The University of Texas Health Science Center at Houston |