Schematic overview of the cellular and molecular mechanisms involved in the cancer progression, including the proposed cellular and molecular mechanisms in cancer cells trajectory. AT1: alveolar type 1 cells; AT2: alveolar type 2 cells; AAH: atypical adenomatous hyperplasia; AIS: adenocarcinoma in situ; MIA: minimally invasive adenocarcinoma; IA: invasive adenocarcinoma; EMT: epithelial-mesenchymal transition

Home

Download

Statistics

Help

Contact

Center for Computational Systems Medicine
leaf

Gene summary

leaf

Malignant transformation analysis

leaf

Malignant transformation related pathway analysis

leaf

Cell-cell communication analysis

leaf

Single-cell gene regulatory network inference analysis

leaf

Somatic mutation of malignant transformation related genes

leaf

Related drugs of malignant transformation related genes

Gene: LSG1

Gene summary for LSG1

check button Gene summary.

Gene informationSpeciesHuman
Gene symbol

LSG1

Gene ID

55341

Gene namelarge 60S subunit nuclear export GTPase 1
Gene AliasLSG1
Cytomap3q29
Gene Typeprotein-coding
GO ID

GO:0000054

UniProtAcc

Q9H089


Top

Malignant transformation analysis

check button Identification of the aberrant gene expression in precancerous and cancerous lesions by comparing the gene expression of stem-like cells in diseased tissues with normal stem cells
check button Malignant transformation involving gene list.
Entrez IDSymbolReplicatesSpeciesOrganTissueAdj P-valueLog2FCMalignancy
55341LSG1LZE2DHumanEsophagusHGIN4.57e-033.72e-010.0642
55341LSG1LZE2THumanEsophagusESCC4.28e-118.86e-010.082
55341LSG1LZE4THumanEsophagusESCC6.38e-205.60e-010.0811
55341LSG1LZE5THumanEsophagusESCC4.11e-066.44e-010.0514
55341LSG1LZE7THumanEsophagusESCC1.45e-151.12e+000.0667
55341LSG1LZE20THumanEsophagusESCC2.67e-031.98e-010.0662
55341LSG1LZE21D1HumanEsophagusHGIN1.48e-026.64e-010.0632
55341LSG1LZE22THumanEsophagusESCC4.20e-024.25e-010.068
55341LSG1LZE24THumanEsophagusESCC3.59e-258.05e-010.0596
55341LSG1LZE21THumanEsophagusESCC1.16e-129.14e-010.0655
55341LSG1LZE6THumanEsophagusESCC8.45e-031.21e-010.0845
55341LSG1P2T-EHumanEsophagusESCC1.55e-571.08e+000.1177
55341LSG1P4T-EHumanEsophagusESCC6.44e-461.15e+000.1323
55341LSG1P5T-EHumanEsophagusESCC1.01e-225.40e-010.1327
55341LSG1P8T-EHumanEsophagusESCC2.26e-254.90e-010.0889
55341LSG1P9T-EHumanEsophagusESCC4.38e-277.24e-010.1131
55341LSG1P10T-EHumanEsophagusESCC6.02e-479.61e-010.116
55341LSG1P11T-EHumanEsophagusESCC2.61e-106.54e-010.1426
55341LSG1P12T-EHumanEsophagusESCC2.37e-441.06e+000.1122
55341LSG1P15T-EHumanEsophagusESCC3.68e-379.05e-010.1149
Page: 1 2 3 4 5 

check button Transcriptomic changes along malignancy continuum.
TissueExpression DynamicsAbbreviation
EsophagusThe image shows the transcriptomic changes along malignancy continuum.log2FC in expression of this searched gene in stem-like cells from each diseased tissue sample relative to stem-like cells in normal samples in each tissue plotted against the malignancy continuum. Samples are colored based on if they are from different disease stage.
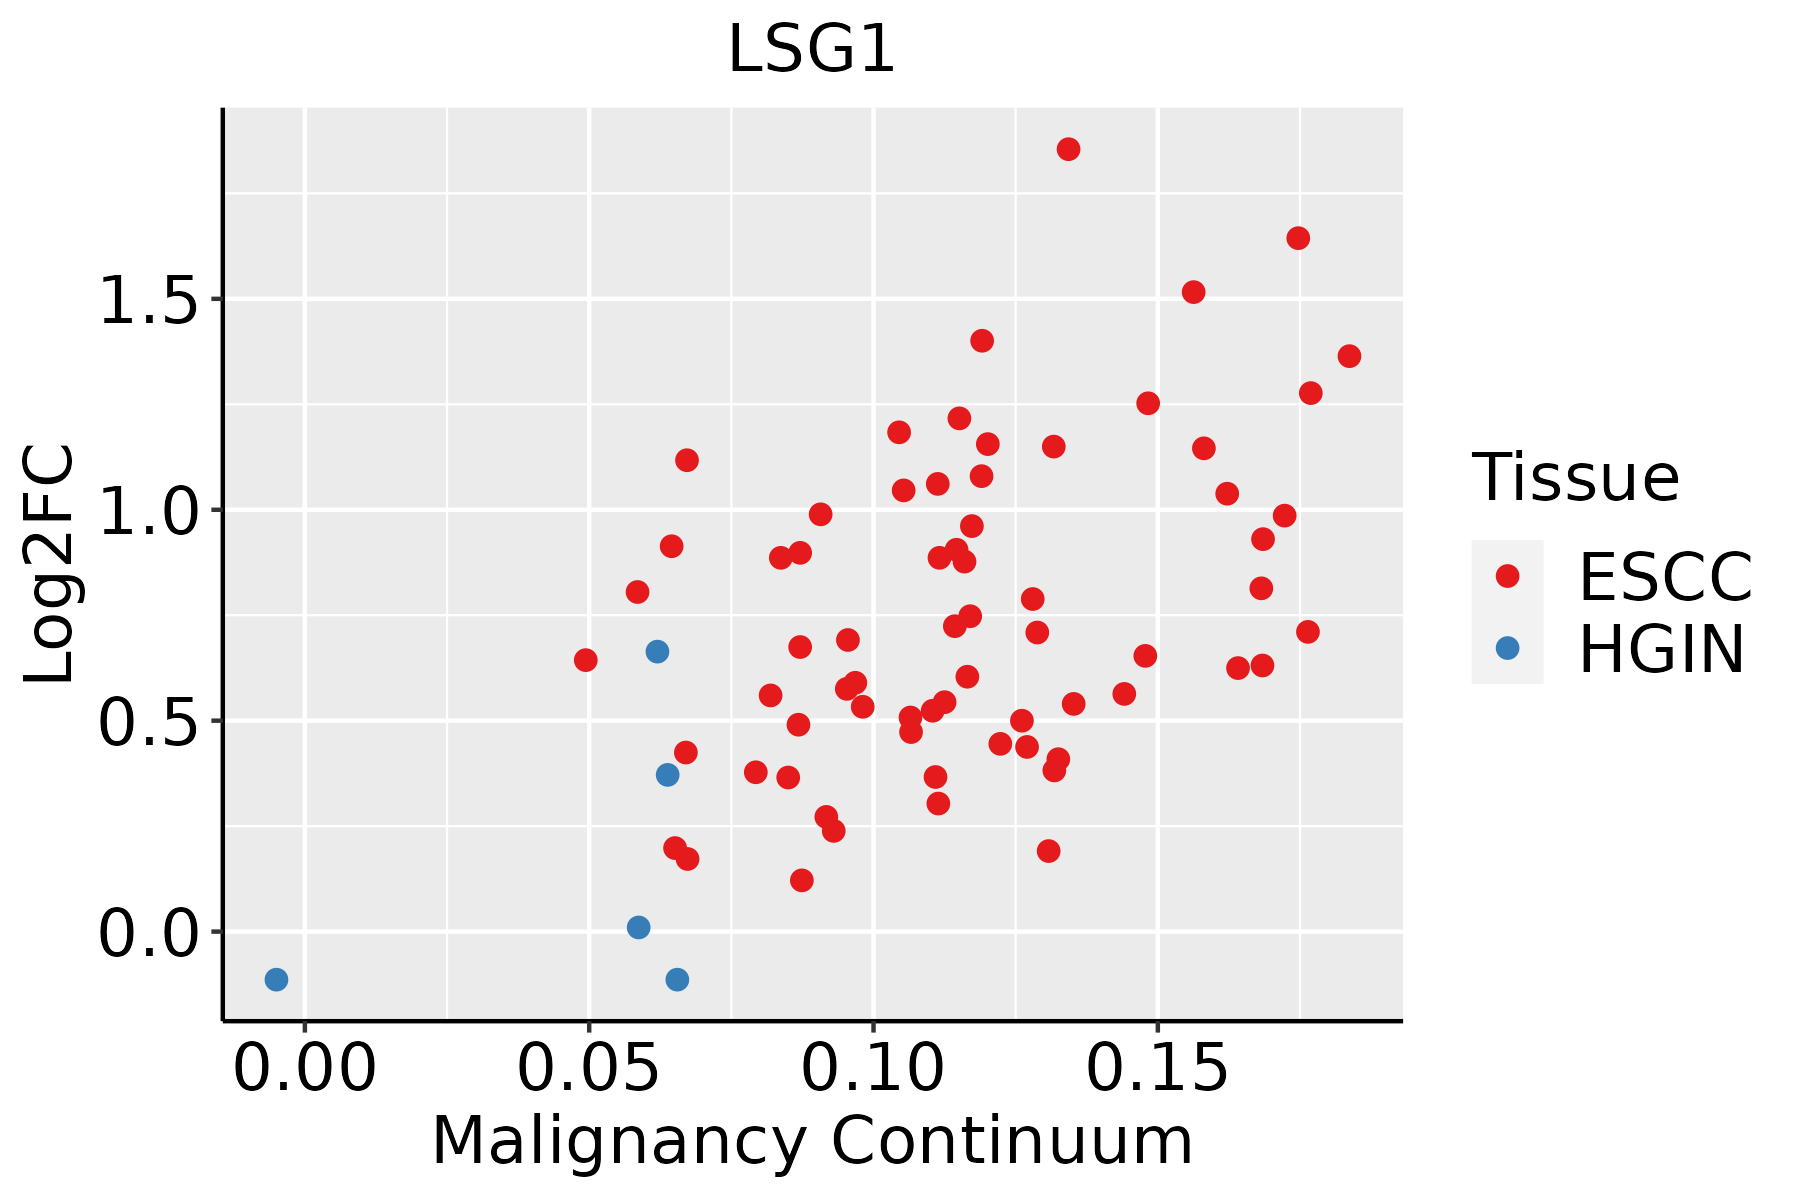
ESCC: Esophageal squamous cell carcinoma
HGIN: High-grade intraepithelial neoplasias
LGIN: Low-grade intraepithelial neoplasias
LiverThe image shows the transcriptomic changes along malignancy continuum.log2FC in expression of this searched gene in stem-like cells from each diseased tissue sample relative to stem-like cells in normal samples in each tissue plotted against the malignancy continuum. Samples are colored based on if they are from different disease stage.
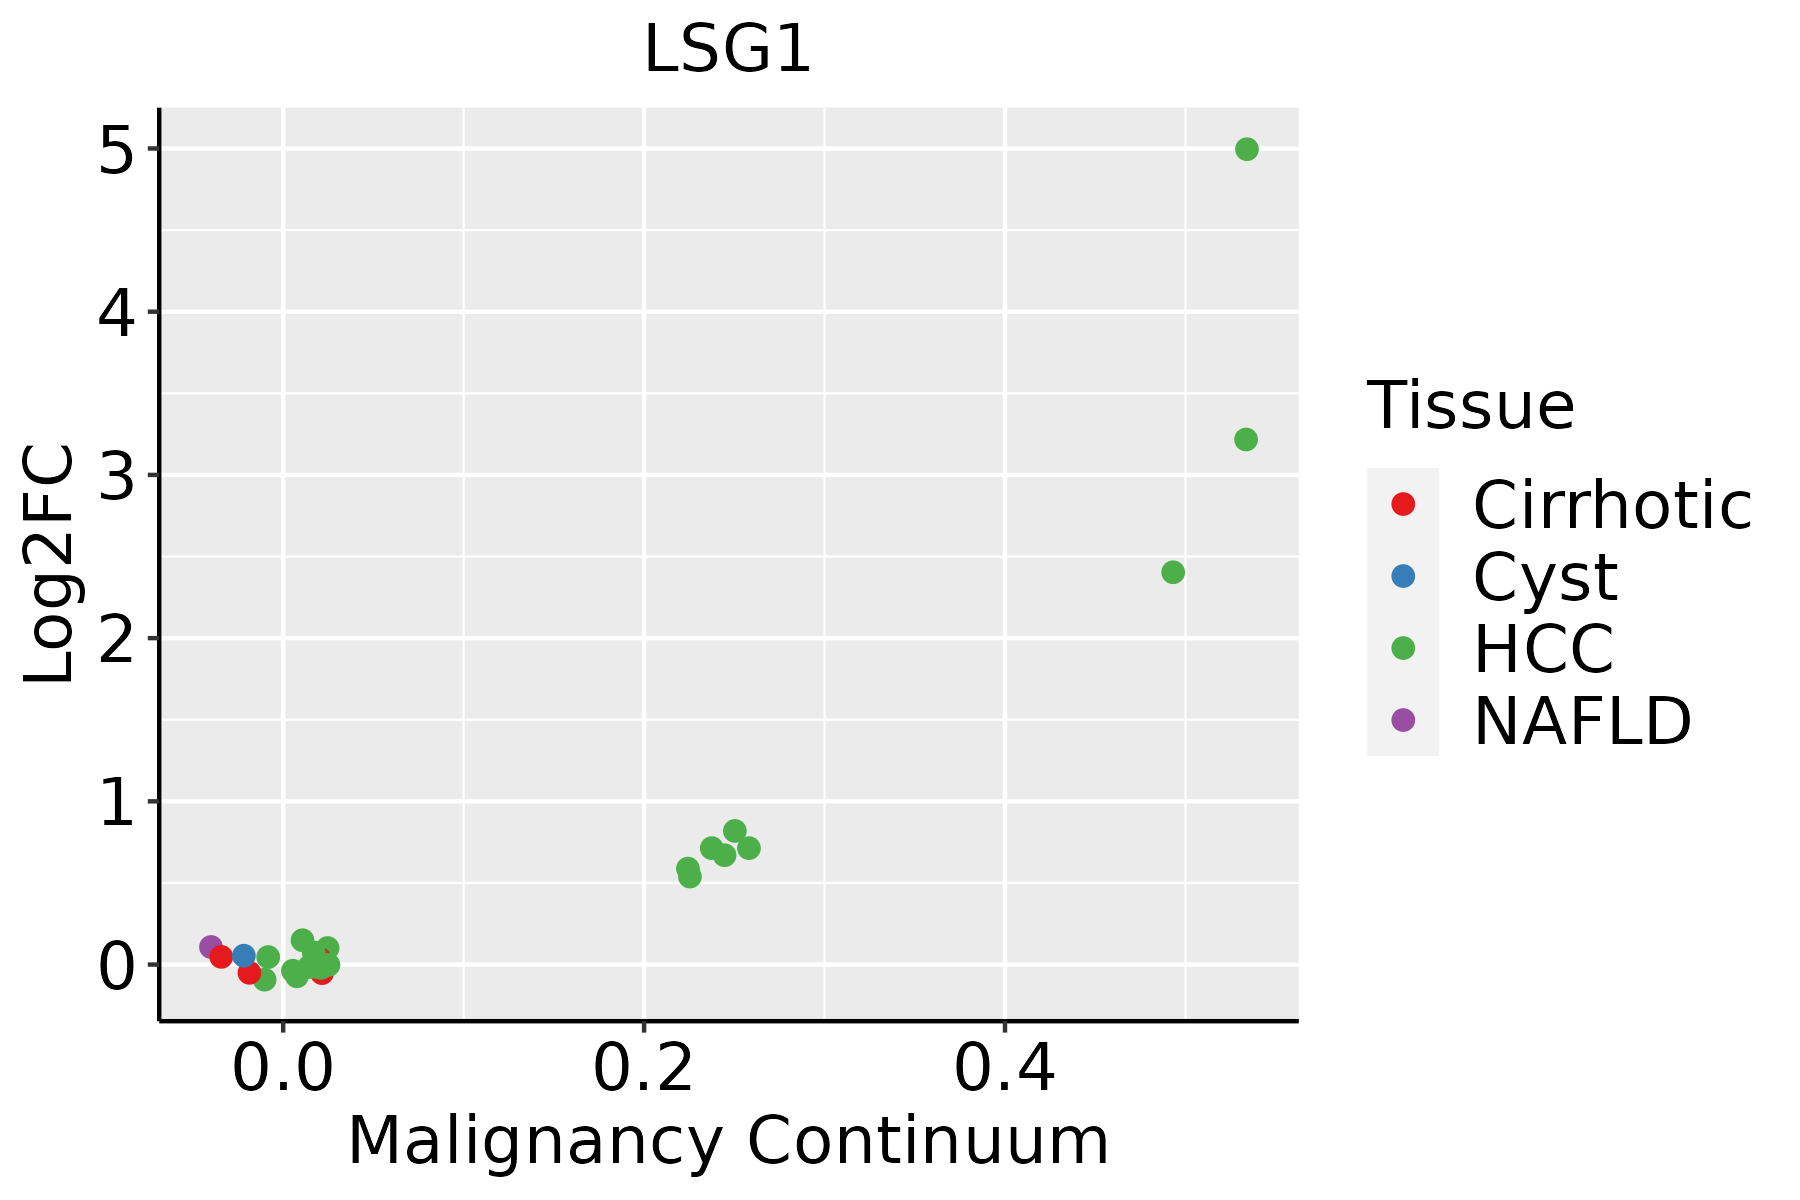
HCC: Hepatocellular carcinoma
NAFLD: Non-alcoholic fatty liver disease
Oral CavityThe image shows the transcriptomic changes along malignancy continuum.log2FC in expression of this searched gene in stem-like cells from each diseased tissue sample relative to stem-like cells in normal samples in each tissue plotted against the malignancy continuum. Samples are colored based on if they are from different disease stage.EOLP: Erosive Oral lichen planus
LP: leukoplakia
NEOLP: Non-erosive oral lichen planus
OSCC: Oral squamous cell carcinoma
SkinThe image shows the transcriptomic changes along malignancy continuum.log2FC in expression of this searched gene in stem-like cells from each diseased tissue sample relative to stem-like cells in normal samples in each tissue plotted against the malignancy continuum. Samples are colored based on if they are from different disease stage.
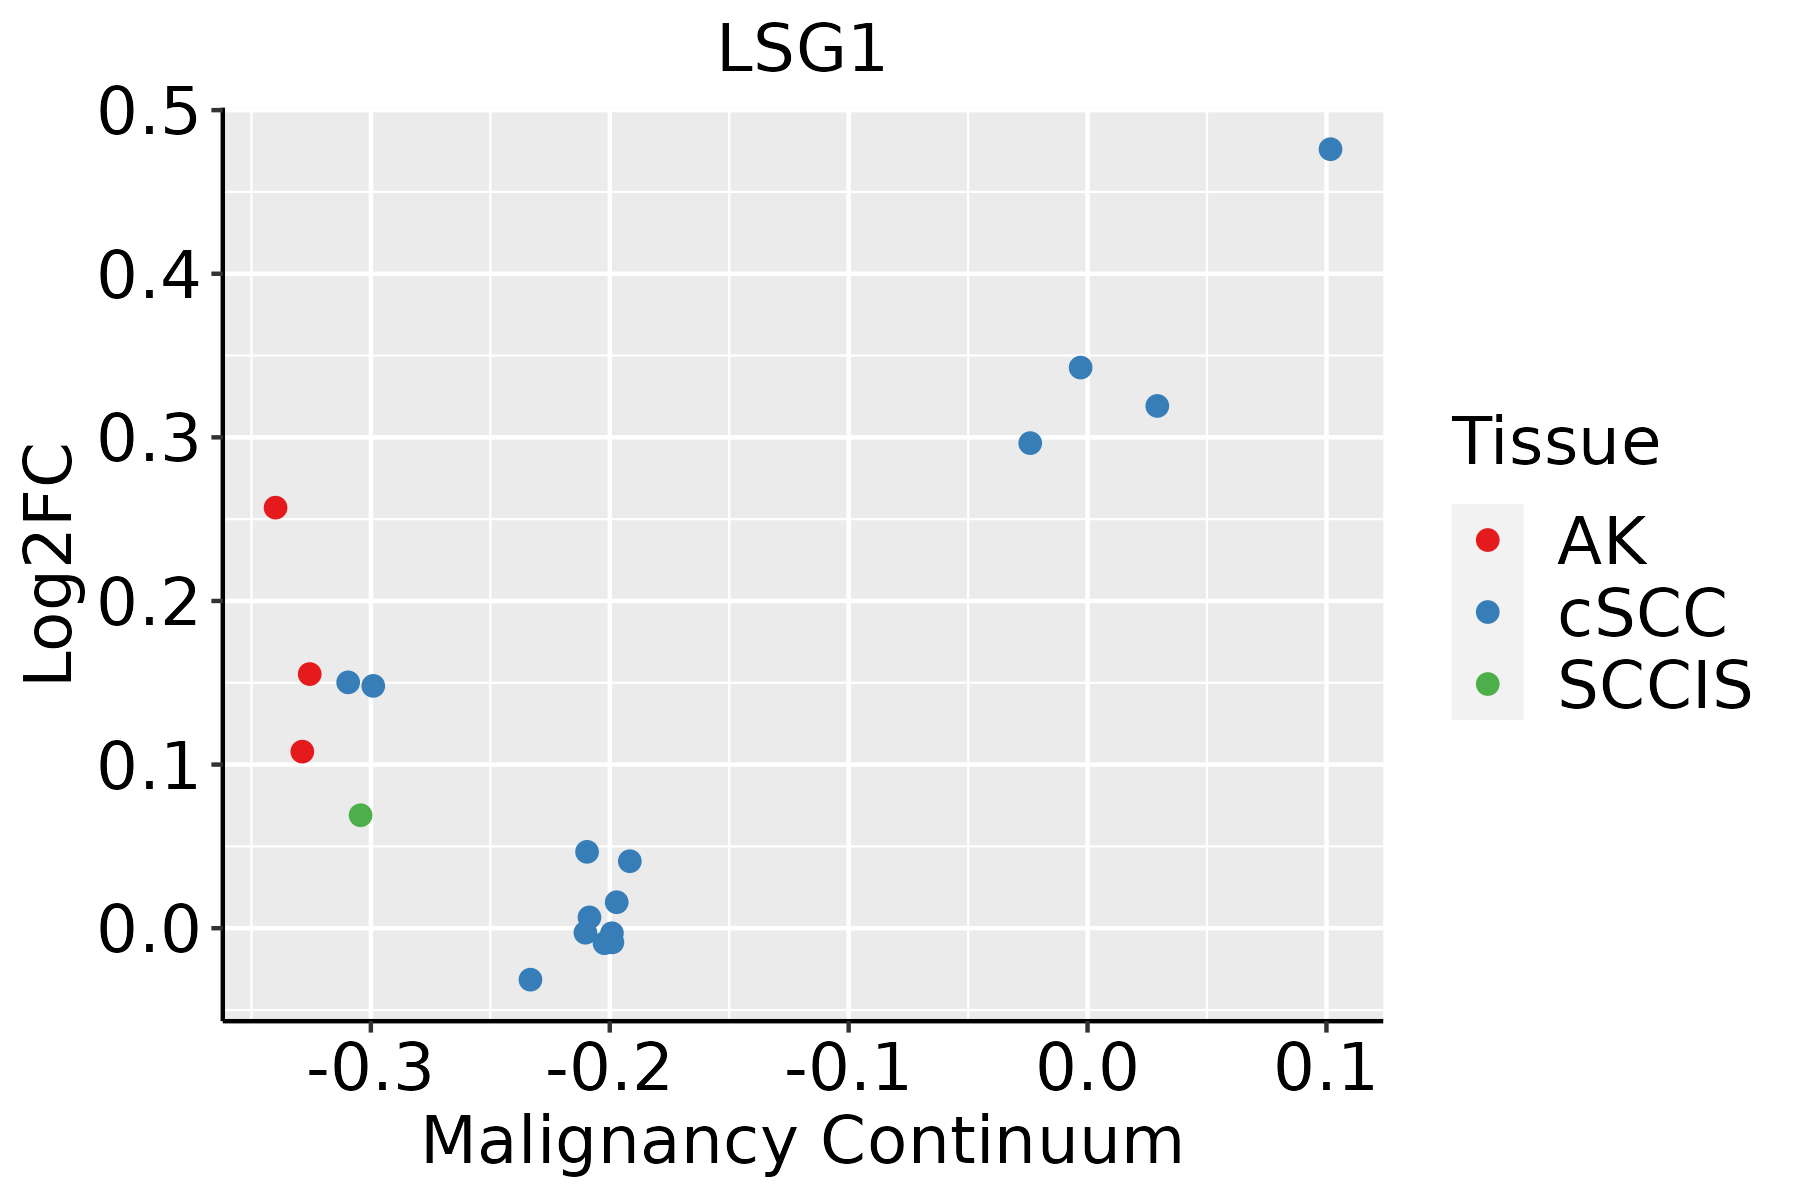
AK: Actinic keratosis
cSCC: Cutaneous squamous cell carcinoma
SCCIS:squamous cell carcinoma in situ
∗log2FC in expression of this searched gene in stem-like cells from each diseased tissue sample relative to stem-like cells in normal samples in each tissue plotted against the malignancy continuum. Samples are colored based on if they are from different disease stage.

Top

Malignant transformation related pathway analysis

check buttonFind out the enriched GO biological processes and KEGG pathways involved in transition from healthy to precancer to cancer
check button Figure of enriched GO biological processes.
TissueDisease StageEnriched GO biological Processes
ColorectumADGO analysis - Figure of enriched GO biological processes: Top 15 enriched GO BP terms are showed in the bar plot of each disease state in each tissue. Each row represents a significant GO biological process which is colored according to the -log10(p.adjust).
ColorectumSERGO analysis - Figure of enriched GO biological processes: Top 15 enriched GO BP terms are showed in the bar plot of each disease state in each tissue. Each row represents a significant GO biological process which is colored according to the -log10(p.adjust).
ColorectumMSSGO analysis - Figure of enriched GO biological processes: Top 15 enriched GO BP terms are showed in the bar plot of each disease state in each tissue. Each row represents a significant GO biological process which is colored according to the -log10(p.adjust).
ColorectumMSI-HGO analysis - Figure of enriched GO biological processes: Top 15 enriched GO BP terms are showed in the bar plot of each disease state in each tissue. Each row represents a significant GO biological process which is colored according to the -log10(p.adjust).
ColorectumFAPGO analysis - Figure of enriched GO biological processes: Top 15 enriched GO BP terms are showed in the bar plot of each disease state in each tissue. Each row represents a significant GO biological process which is colored according to the -log10(p.adjust).
∗Top 15 enriched GO BP terms are showed in the bar plot of each disease state in each tissue. Each row represents a significant GO biological process which is colored according to the -log10(p.adjust).
Page: 1 2 3 4 5 6 7 8 9 

check button Enriched GO biological processes.
GO IDTissueDisease StageDescriptionGene RatioBg Ratiopvaluep.adjustCount
GO:002261327EsophagusHGINribonucleoprotein complex biogenesis158/2587463/187232.61e-295.23e-26158
GO:004225426EsophagusHGINribosome biogenesis101/2587299/187238.74e-194.03e-16101
GO:000691319EsophagusHGINnucleocytoplasmic transport83/2587301/187232.14e-101.97e-0883
GO:005116919EsophagusHGINnuclear transport83/2587301/187232.14e-101.97e-0883
GO:005116819EsophagusHGINnuclear export48/2587154/187232.21e-081.34e-0648
GO:005165616EsophagusHGINestablishment of organelle localization90/2587390/187234.27e-071.94e-0590
GO:00711665EsophagusHGINribonucleoprotein complex localization23/258777/187232.00e-043.72e-0323
GO:00315035EsophagusHGINprotein-containing complex localization50/2587220/187232.18e-043.98e-0350
GO:00714265EsophagusHGINribonucleoprotein complex export from nucleus22/258776/187234.44e-046.62e-0322
GO:00000547EsophagusHGINribosomal subunit export from nucleus7/258714/187231.34e-031.57e-027
GO:00337507EsophagusHGINribosome localization7/258714/187231.34e-031.57e-027
GO:00714284EsophagusHGINrRNA-containing ribonucleoprotein complex export from nucleus7/258715/187232.22e-032.28e-027
GO:0022613111EsophagusESCCribonucleoprotein complex biogenesis365/8552463/187231.74e-491.11e-45365
GO:0042254111EsophagusESCCribosome biogenesis252/8552299/187233.27e-441.04e-40252
GO:0006913110EsophagusESCCnucleocytoplasmic transport230/8552301/187236.04e-282.02e-25230
GO:0051169110EsophagusESCCnuclear transport230/8552301/187236.04e-282.02e-25230
GO:005165617EsophagusESCCestablishment of organelle localization273/8552390/187239.13e-231.81e-20273
GO:0051168110EsophagusESCCnuclear export126/8552154/187231.88e-202.65e-18126
GO:007116612EsophagusESCCribonucleoprotein complex localization66/855277/187232.94e-131.38e-1166
GO:007142612EsophagusESCCribonucleoprotein complex export from nucleus65/855276/187235.56e-132.50e-1165
Page: 1 2 3 4 

check button Enriched KEGG pathways.
Pathway IDTissueDisease StageDescriptionGene RatioBg Ratiopvaluep.adjustqvalueCount
Page: 1 

Top

Cell-cell communication analysis

check buttonIdentification of potential cell-cell interactions between two cell types and their ligand-receptor pairs for different disease states
LigandReceptorLRpairPathwayTissueDisease Stage
Page: 1 

Top

Single-cell gene regulatory network inference analysis

check buttonFind out the significant the regulons (TFs) and the target genes of each regulon across cell types for different disease states
TFCell TypeTissueDisease StageTarget GeneRSSRegulon Activity
∗The dot plots of a searched regulon are shown for all cell subpopulations in each disease state of each tissue based on the regulon specific score inferred using pySCENIC and by calculating the average expression.
Page: 1 

Top

Somatic mutation of malignant transformation related genes

check buttonAnnotation of somatic variants for genes involved in malignant transformation
Hugo SymbolVariant ClassVariant ClassificationdbSNP RSHGVScHGVSpHGVSp ShortSWISSPROTBIOTYPESIFTPolyPhenTumor Sample BarcodeTissueHistologySexAgeStageTherapy TypesDrugsOutcome
LSG1SNVMissense_Mutationrs547942305c.476G>Ap.Arg159Glnp.R159QQ9H089protein_codingdeleterious(0.01)probably_damaging(0.923)TCGA-5L-AAT1-01Breastbreast invasive carcinomaFemale<65III/IVHormone TherapyletrozolSD
LSG1SNVMissense_Mutationc.1102N>Cp.Glu368Glnp.E368QQ9H089protein_codingtolerated(0.1)possibly_damaging(0.562)TCGA-AC-A23H-01Breastbreast invasive carcinomaFemale>=65I/IIUnknownUnknownPD
LSG1SNVMissense_Mutationc.1579N>Ap.Asp527Asnp.D527NQ9H089protein_codingdeleterious(0)probably_damaging(1)TCGA-AR-A1AO-01Breastbreast invasive carcinomaFemale<65I/IIChemotherapydoxorubicinSD
LSG1SNVMissense_Mutationrs147988904c.665G>Ap.Arg222Glnp.R222QQ9H089protein_codingdeleterious(0)probably_damaging(0.999)TCGA-B6-A0I6-01Breastbreast invasive carcinomaFemale<65I/IIUnknownUnknownPD
LSG1insertionNonsense_Mutationnovelc.262_263insTTGACTCCATTTGAACGAAATTTGGACTTTTGGCp.Arg88IlefsTer5p.R88Ifs*5Q9H089protein_codingTCGA-A2-A04Y-01Breastbreast invasive carcinomaFemale<65I/IIChemotherapycytoxanSD
LSG1deletionIn_Frame_Delc.456_458delNNNp.Ile153delp.I153delQ9H089protein_codingTCGA-AN-A0AK-01Breastbreast invasive carcinomaFemale>=65I/IIUnknownUnknownSD
LSG1SNVMissense_Mutationnovelc.1691G>Ap.Arg564Glnp.R564QQ9H089protein_codingtolerated(0.34)benign(0)TCGA-2W-A8YY-01Cervixcervical & endocervical cancerFemale<65I/IIChemotherapycisplatinCR
LSG1SNVMissense_Mutationnovelc.1223G>Ap.Gly408Aspp.G408DQ9H089protein_codingtolerated(0.6)possibly_damaging(0.864)TCGA-2W-A8YY-01Cervixcervical & endocervical cancerFemale<65I/IIChemotherapycisplatinCR
LSG1SNVMissense_Mutationnovelc.927C>Ap.Asp309Glup.D309EQ9H089protein_codingtolerated(0.21)benign(0.025)TCGA-2W-A8YY-01Cervixcervical & endocervical cancerFemale<65I/IIChemotherapycisplatinCR
LSG1SNVMissense_Mutationnovelc.1066N>Ap.Gln356Lysp.Q356KQ9H089protein_codingtolerated(0.93)benign(0.001)TCGA-C5-A902-01Cervixcervical & endocervical cancerFemale<65I/IIChemotherapycisplatinSD
Page: 1 2 3 4 5 6 7 

Top

Related drugs of malignant transformation related genes

check buttonIdentification of chemicals and drugs interact with genes involved in malignant transfromation
(DGIdb 4.0)
Entrez IDSymbolCategoryInteraction TypesDrug Claim NameDrug NamePMIDs
Page: 1