
|
|||||
|
 | |
| |
| |
| |
| |
| |
|
Gene: LSAMP |
Gene summary for LSAMP |
| Gene information | Species | Human | Gene symbol | LSAMP | Gene ID | 4045 |
| Gene name | limbic system associated membrane protein | |
| Gene Alias | IGLON3 | |
| Cytomap | 3q13.31 | |
| Gene Type | protein-coding | GO ID | GO:0007155 | UniProtAcc | B7Z661 |
Top |
Malignant transformation analysis |
| Identification of the aberrant gene expression in precancerous and cancerous lesions by comparing the gene expression of stem-like cells in diseased tissues with normal stem cells |
| Entrez ID | Symbol | Replicates | Species | Organ | Tissue | Adj P-value | Log2FC | Malignancy |
| 4045 | LSAMP | HTA11_2487_2000001011 | Human | Colorectum | SER | 4.35e-03 | 3.35e-01 | -0.1808 |
| 4045 | LSAMP | HTA11_78_2000001011 | Human | Colorectum | AD | 2.84e-02 | 2.38e-01 | -0.1088 |
| 4045 | LSAMP | HTA11_347_2000001011 | Human | Colorectum | AD | 2.60e-02 | 2.03e-01 | -0.1954 |
| 4045 | LSAMP | HTA11_3361_2000001011 | Human | Colorectum | AD | 3.18e-02 | 2.63e-01 | -0.1207 |
| 4045 | LSAMP | HTA11_696_2000001011 | Human | Colorectum | AD | 2.81e-02 | 2.06e-01 | -0.1464 |
| 4045 | LSAMP | HTA11_866_2000001011 | Human | Colorectum | AD | 5.44e-03 | 1.81e-01 | -0.1001 |
| 4045 | LSAMP | HTA11_1391_2000001011 | Human | Colorectum | AD | 5.73e-05 | 3.75e-01 | -0.059 |
| 4045 | LSAMP | HTA11_6818_2000001011 | Human | Colorectum | AD | 1.44e-02 | 3.75e-01 | 0.0112 |
| 4045 | LSAMP | HTA11_6818_2000001021 | Human | Colorectum | AD | 1.60e-14 | 8.62e-01 | 0.0588 |
| 4045 | LSAMP | HTA11_99999970781_79442 | Human | Colorectum | MSS | 2.31e-04 | 4.61e-01 | 0.294 |
| 4045 | LSAMP | HTA11_99999965104_69814 | Human | Colorectum | MSS | 6.34e-27 | 1.15e+00 | 0.281 |
| 4045 | LSAMP | CRC-3-11773 | Human | Colorectum | CRC | 2.14e-06 | 5.06e-01 | 0.2564 |
| 4045 | LSAMP | C38 | Human | Oral cavity | OSCC | 1.46e-04 | 7.64e-01 | 0.172 |
| 4045 | LSAMP | NEOLP-1 | Human | Oral cavity | NEOLP | 3.20e-22 | 8.41e-01 | -0.0194 |
| 4045 | LSAMP | NEOLP-2 | Human | Oral cavity | NEOLP | 1.83e-02 | 3.03e-01 | -0.0196 |
| 4045 | LSAMP | HTA12-15-2 | Human | Pancreas | PDAC | 4.32e-07 | 6.06e-01 | 0.2315 |
| 4045 | LSAMP | HTA12-18-3 | Human | Pancreas | PDAC | 4.07e-03 | 6.29e-01 | 0.0716 |
| 4045 | LSAMP | HTA12-23-1 | Human | Pancreas | PDAC | 1.06e-18 | 1.41e+00 | 0.3405 |
| 4045 | LSAMP | HTA12-25-1 | Human | Pancreas | PDAC | 2.04e-11 | 9.03e-01 | 0.313 |
| 4045 | LSAMP | HTA12-26-1 | Human | Pancreas | PDAC | 1.81e-32 | 1.39e+00 | 0.3728 |
| Page: 1 2 |
| Tissue | Expression Dynamics | Abbreviation |
| Colorectum (GSE201348) |  | FAP: Familial adenomatous polyposis |
| CRC: Colorectal cancer | ||
| Colorectum (HTA11) | 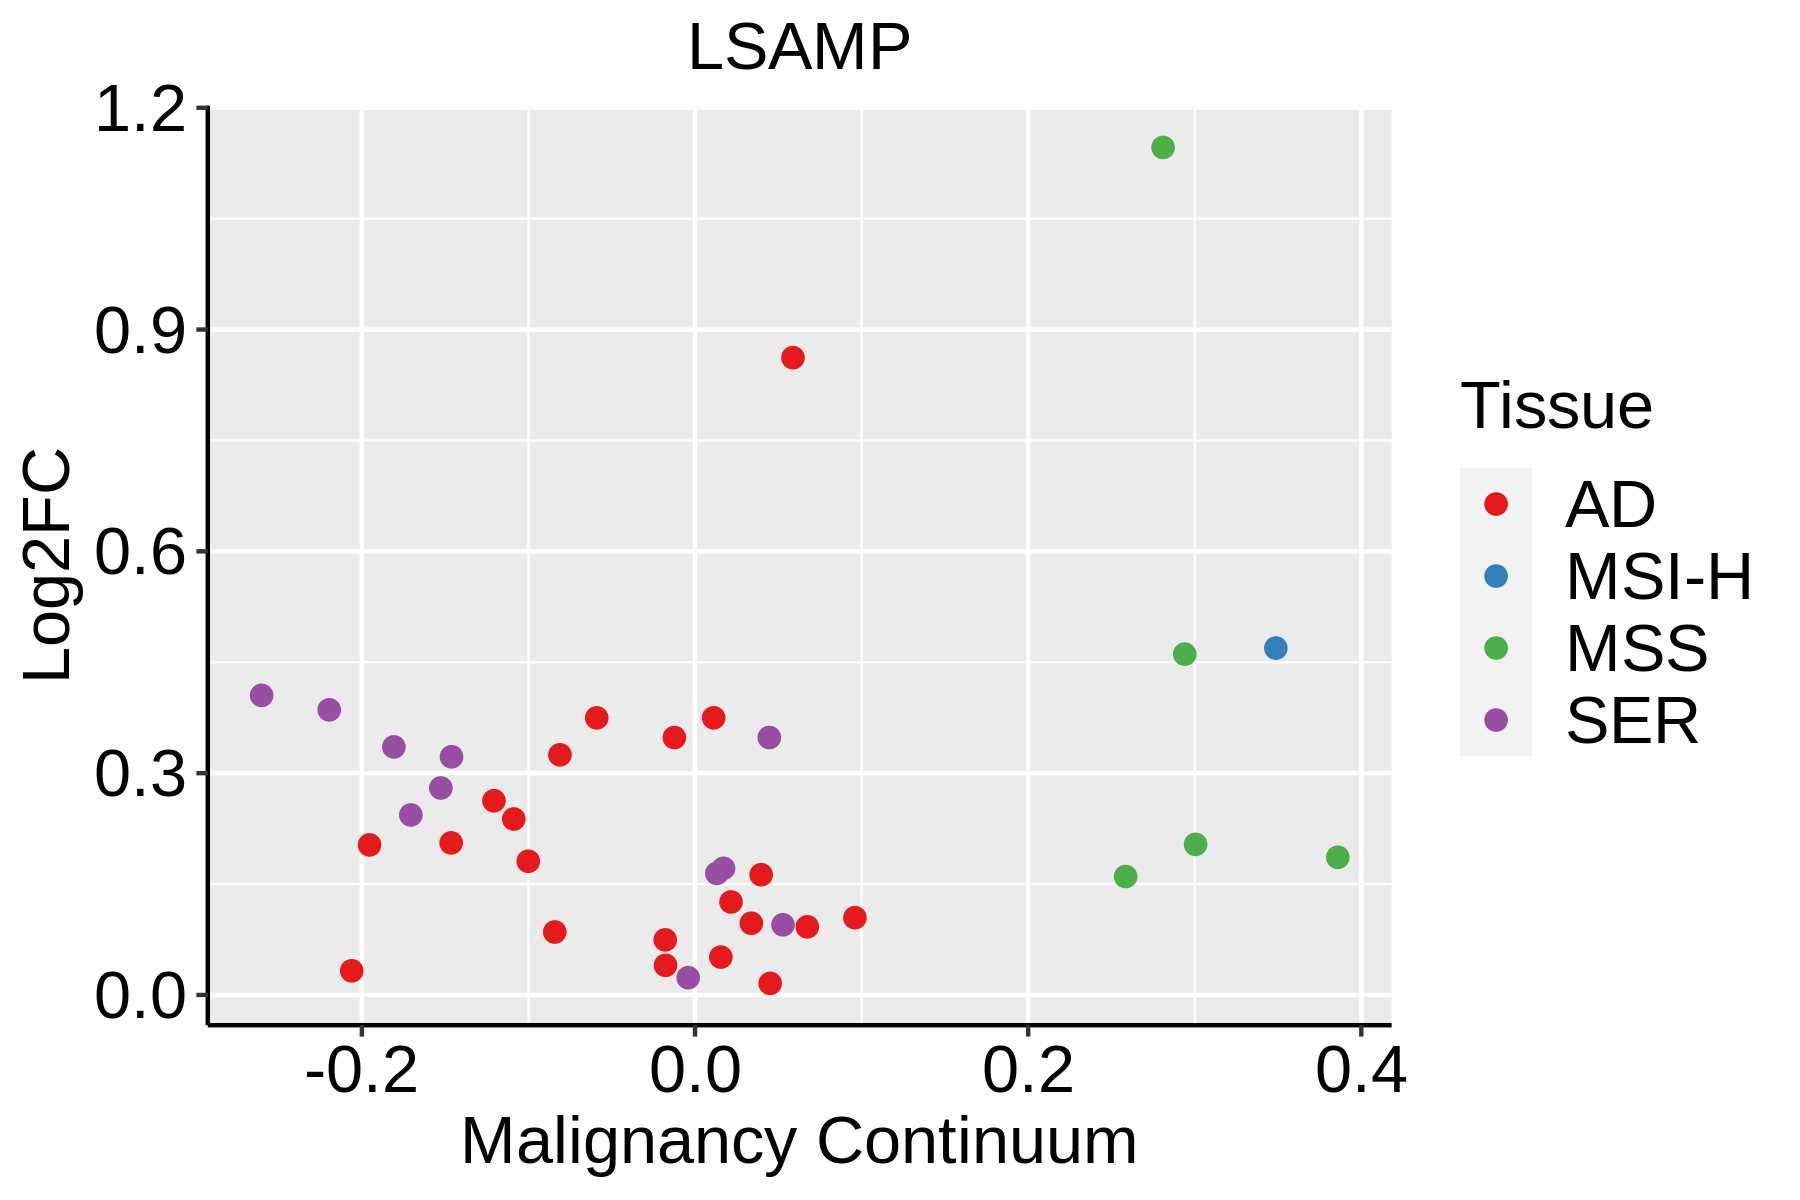 | AD: Adenomas |
| SER: Sessile serrated lesions | ||
| MSI-H: Microsatellite-high colorectal cancer | ||
| MSS: Microsatellite stable colorectal cancer | ||
| Oral Cavity | 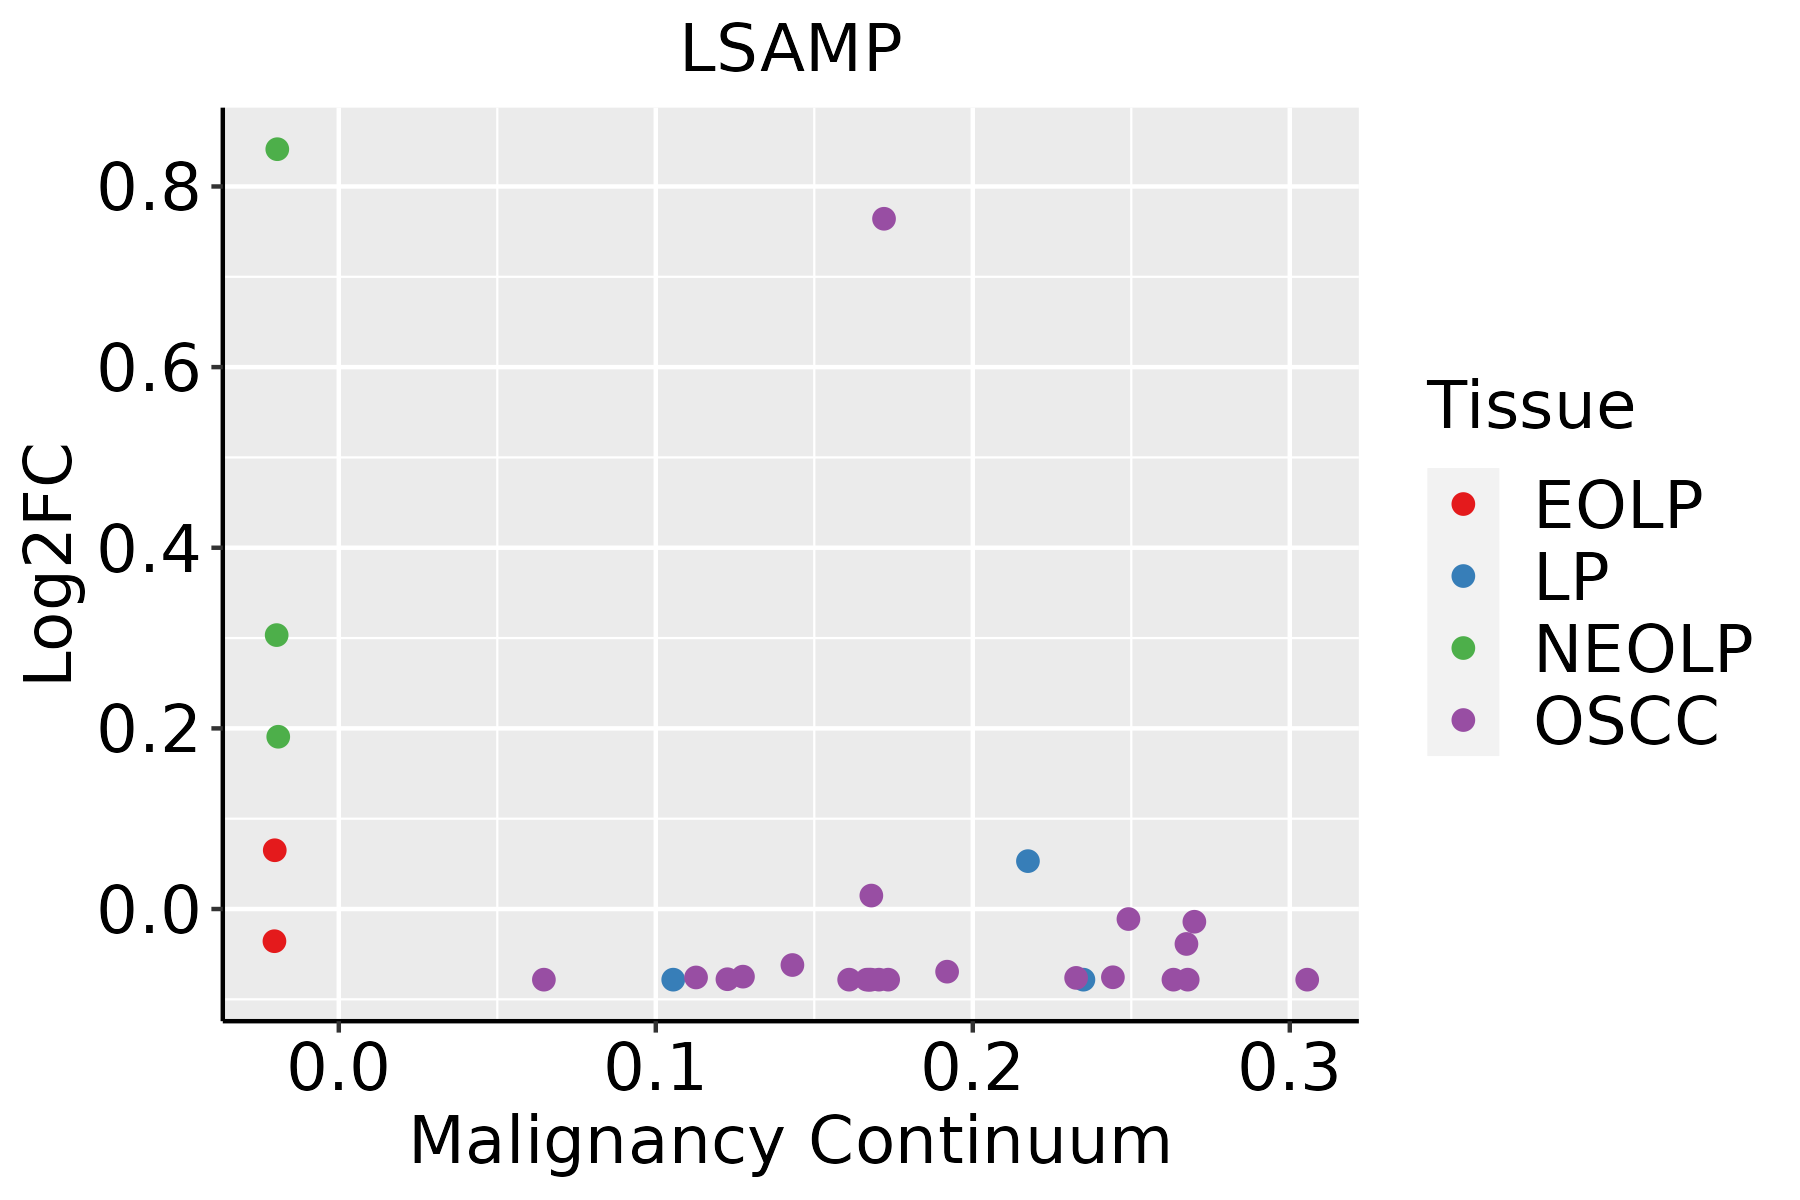 | EOLP: Erosive Oral lichen planus |
| LP: leukoplakia | ||
| NEOLP: Non-erosive oral lichen planus | ||
| OSCC: Oral squamous cell carcinoma |
| ∗log2FC in expression of this searched gene in stem-like cells from each diseased tissue sample relative to stem-like cells in normal samples in each tissue plotted against the malignancy continuum. Samples are colored based on if they are from different disease stage. |
Top |
Malignant transformation related pathway analysis |
| Find out the enriched GO biological processes and KEGG pathways involved in transition from healthy to precancer to cancer |
| Tissue | Disease Stage | Enriched GO biological Processes |
| Colorectum | AD |  |
| Colorectum | SER |  |
| Colorectum | MSS |  |
| Colorectum | MSI-H |  |
| Colorectum | FAP |  |
| ∗Top 15 enriched GO BP terms are showed in the bar plot of each disease state in each tissue. Each row represents a significant GO biological process which is colored according to the -log10(p.adjust). |
| Page: 1 2 3 4 5 6 7 8 9 |
| GO ID | Tissue | Disease Stage | Description | Gene Ratio | Bg Ratio | pvalue | p.adjust | Count |
| Page: 1 |
| Pathway ID | Tissue | Disease Stage | Description | Gene Ratio | Bg Ratio | pvalue | p.adjust | qvalue | Count |
| Page: 1 |
Top |
Cell-cell communication analysis |
| Identification of potential cell-cell interactions between two cell types and their ligand-receptor pairs for different disease states |
| Ligand | Receptor | LRpair | Pathway | Tissue | Disease Stage |
| Page: 1 |
Top |
Single-cell gene regulatory network inference analysis |
| Find out the significant the regulons (TFs) and the target genes of each regulon across cell types for different disease states |
| TF | Cell Type | Tissue | Disease Stage | Target Gene | RSS | Regulon Activity |
| ∗The dot plots of a searched regulon are shown for all cell subpopulations in each disease state of each tissue based on the regulon specific score inferred using pySCENIC and by calculating the average expression. |
| Page: 1 |
Top |
Somatic mutation of malignant transformation related genes |
| Annotation of somatic variants for genes involved in malignant transformation |
| Hugo Symbol | Variant Class | Variant Classification | dbSNP RS | HGVSc | HGVSp | HGVSp Short | SWISSPROT | BIOTYPE | SIFT | PolyPhen | Tumor Sample Barcode | Tissue | Histology | Sex | Age | Stage | Therapy Types | Drugs | Outcome |
| LSAMP | SNV | Missense_Mutation | novel | c.1008N>A | p.Ser336Arg | p.S336R | Q13449 | protein_coding | tolerated(0.38) | benign(0.363) | TCGA-AO-A0J7-01 | Breast | breast invasive carcinoma | Female | >=65 | I/II | Chemotherapy | doxorubicin | SD |
| LSAMP | insertion | Frame_Shift_Ins | novel | c.235_236insTACAATCACATTTACATAAAAACAATAAATGGTCTACATC | p.Ser79LeufsTer20 | p.S79Lfs*20 | Q13449 | protein_coding | TCGA-E9-A1NI-01 | Breast | breast invasive carcinoma | Female | <65 | I/II | Chemotherapy | doxorubicin | CR | ||
| LSAMP | SNV | Missense_Mutation | novel | c.572N>T | p.Gln191Leu | p.Q191L | Q13449 | protein_coding | deleterious(0) | probably_damaging(0.968) | TCGA-C5-A8XH-01 | Cervix | cervical & endocervical cancer | Female | <65 | I/II | Unknown | Unknown | SD |
| LSAMP | SNV | Missense_Mutation | c.793N>C | p.Glu265Gln | p.E265Q | Q13449 | protein_coding | tolerated(0.19) | benign(0.166) | TCGA-EK-A3GK-01 | Cervix | cervical & endocervical cancer | Female | <65 | I/II | Unknown | Unknown | SD | |
| LSAMP | SNV | Missense_Mutation | c.818N>A | p.Ser273Tyr | p.S273Y | Q13449 | protein_coding | deleterious(0) | probably_damaging(0.964) | TCGA-A6-6138-01 | Colorectum | colon adenocarcinoma | Male | <65 | I/II | Unknown | Unknown | SD | |
| LSAMP | SNV | Missense_Mutation | rs577289191 | c.200N>A | p.Arg67His | p.R67H | Q13449 | protein_coding | deleterious(0) | probably_damaging(0.999) | TCGA-AA-3986-01 | Colorectum | colon adenocarcinoma | Male | >=65 | I/II | Unknown | Unknown | SD |
| LSAMP | SNV | Missense_Mutation | rs779534072 | c.382G>A | p.Val128Ile | p.V128I | Q13449 | protein_coding | deleterious(0) | possibly_damaging(0.833) | TCGA-AA-A010-01 | Colorectum | colon adenocarcinoma | Female | <65 | I/II | Chemotherapy | folinic | CR |
| LSAMP | SNV | Missense_Mutation | c.44N>C | p.Val15Ala | p.V15A | Q13449 | protein_coding | deleterious(0.02) | benign(0.003) | TCGA-AM-5821-01 | Colorectum | colon adenocarcinoma | Female | >=65 | I/II | Unknown | Unknown | SD | |
| LSAMP | SNV | Missense_Mutation | novel | c.281N>G | p.Tyr94Cys | p.Y94C | Q13449 | protein_coding | deleterious(0) | probably_damaging(0.997) | TCGA-AZ-4315-01 | Colorectum | colon adenocarcinoma | Male | <65 | I/II | Unknown | Unknown | SD |
| LSAMP | SNV | Missense_Mutation | c.290N>A | p.Arg97Gln | p.R97Q | Q13449 | protein_coding | tolerated(1) | benign(0.058) | TCGA-CA-6717-01 | Colorectum | colon adenocarcinoma | Male | <65 | I/II | Chemotherapy | oxaliplatin | CR |
| Page: 1 2 3 4 5 6 7 8 |
Top |
Related drugs of malignant transformation related genes |
| Identification of chemicals and drugs interact with genes involved in malignant transfromation |
| (DGIdb 4.0) |
| Entrez ID | Symbol | Category | Interaction Types | Drug Claim Name | Drug Name | PMIDs |
| Page: 1 |

Copyright 2023-Present -The University of Texas Health Science Center at Houston |