
|
|||||
|
 | |
| |
| |
| |
| |
| |
|
Gene: LRWD1 |
Gene summary for LRWD1 |
| Gene information | Species | Human | Gene symbol | LRWD1 | Gene ID | 222229 |
| Gene name | leucine rich repeats and WD repeat domain containing 1 | |
| Gene Alias | CENP-33 | |
| Cytomap | 7q22.1 | |
| Gene Type | protein-coding | GO ID | GO:0006139 | UniProtAcc | Q9UFC0 |
Top |
Malignant transformation analysis |
| Identification of the aberrant gene expression in precancerous and cancerous lesions by comparing the gene expression of stem-like cells in diseased tissues with normal stem cells |
| Entrez ID | Symbol | Replicates | Species | Organ | Tissue | Adj P-value | Log2FC | Malignancy |
| 222229 | LRWD1 | LZE7T | Human | Esophagus | ESCC | 5.10e-04 | 2.76e-01 | 0.0667 |
| 222229 | LRWD1 | LZE22T | Human | Esophagus | ESCC | 4.69e-02 | 1.98e-01 | 0.068 |
| 222229 | LRWD1 | LZE24T | Human | Esophagus | ESCC | 5.59e-06 | 3.24e-01 | 0.0596 |
| 222229 | LRWD1 | LZE21T | Human | Esophagus | ESCC | 1.17e-04 | 2.75e-01 | 0.0655 |
| 222229 | LRWD1 | P1T-E | Human | Esophagus | ESCC | 1.80e-06 | 2.35e-01 | 0.0875 |
| 222229 | LRWD1 | P2T-E | Human | Esophagus | ESCC | 2.75e-33 | 5.41e-01 | 0.1177 |
| 222229 | LRWD1 | P4T-E | Human | Esophagus | ESCC | 2.93e-12 | 2.79e-01 | 0.1323 |
| 222229 | LRWD1 | P5T-E | Human | Esophagus | ESCC | 9.71e-11 | 2.00e-01 | 0.1327 |
| 222229 | LRWD1 | P8T-E | Human | Esophagus | ESCC | 1.96e-07 | 1.30e-01 | 0.0889 |
| 222229 | LRWD1 | P9T-E | Human | Esophagus | ESCC | 1.67e-10 | 2.03e-01 | 0.1131 |
| 222229 | LRWD1 | P10T-E | Human | Esophagus | ESCC | 4.57e-16 | 2.11e-01 | 0.116 |
| 222229 | LRWD1 | P11T-E | Human | Esophagus | ESCC | 8.33e-10 | 4.28e-01 | 0.1426 |
| 222229 | LRWD1 | P12T-E | Human | Esophagus | ESCC | 2.26e-22 | 5.17e-01 | 0.1122 |
| 222229 | LRWD1 | P15T-E | Human | Esophagus | ESCC | 3.70e-20 | 4.24e-01 | 0.1149 |
| 222229 | LRWD1 | P16T-E | Human | Esophagus | ESCC | 5.10e-32 | 5.06e-01 | 0.1153 |
| 222229 | LRWD1 | P17T-E | Human | Esophagus | ESCC | 5.25e-13 | 5.60e-01 | 0.1278 |
| 222229 | LRWD1 | P19T-E | Human | Esophagus | ESCC | 2.20e-03 | 3.81e-01 | 0.1662 |
| 222229 | LRWD1 | P20T-E | Human | Esophagus | ESCC | 3.04e-12 | 3.71e-01 | 0.1124 |
| 222229 | LRWD1 | P21T-E | Human | Esophagus | ESCC | 3.33e-30 | 6.34e-01 | 0.1617 |
| 222229 | LRWD1 | P22T-E | Human | Esophagus | ESCC | 6.77e-22 | 2.81e-01 | 0.1236 |
| Page: 1 2 3 4 5 |
| Tissue | Expression Dynamics | Abbreviation |
| Esophagus | 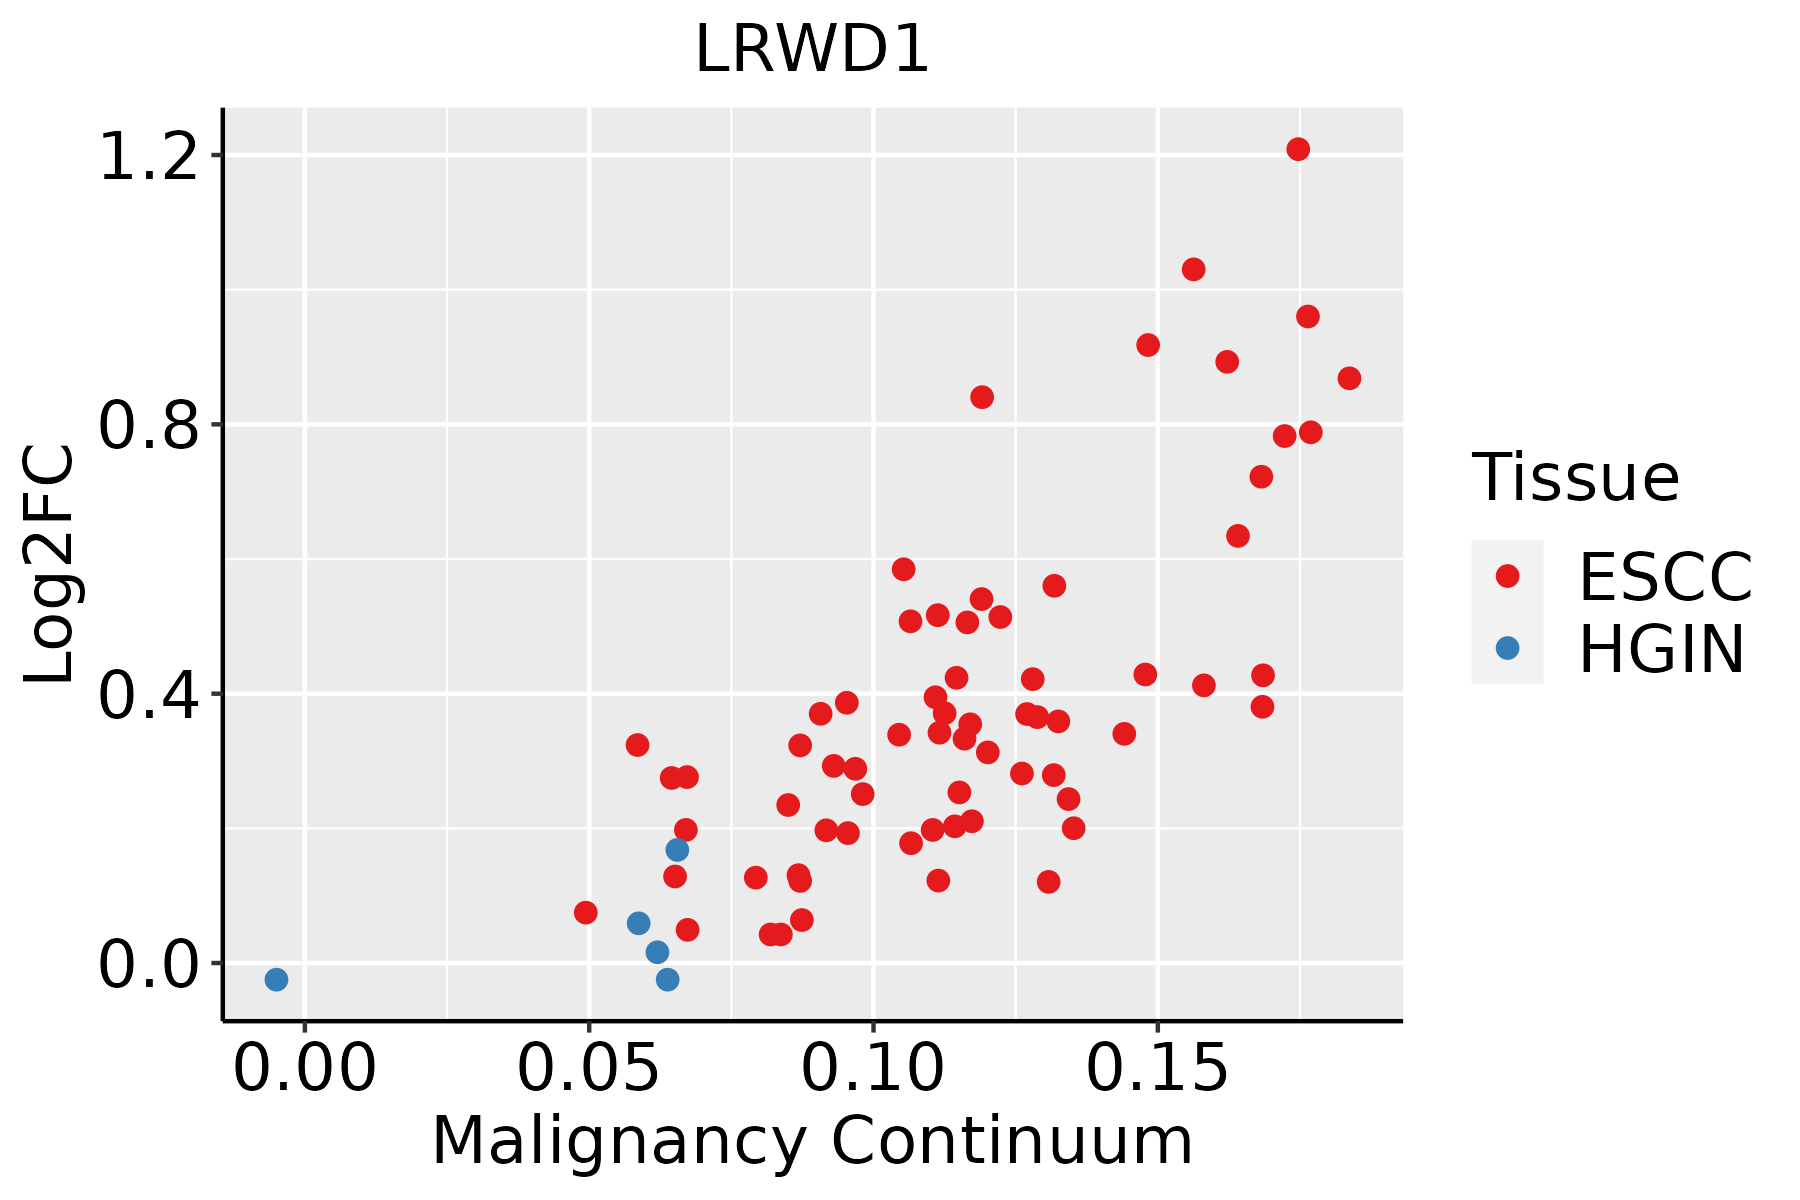 | ESCC: Esophageal squamous cell carcinoma |
| HGIN: High-grade intraepithelial neoplasias | ||
| LGIN: Low-grade intraepithelial neoplasias | ||
| Liver | 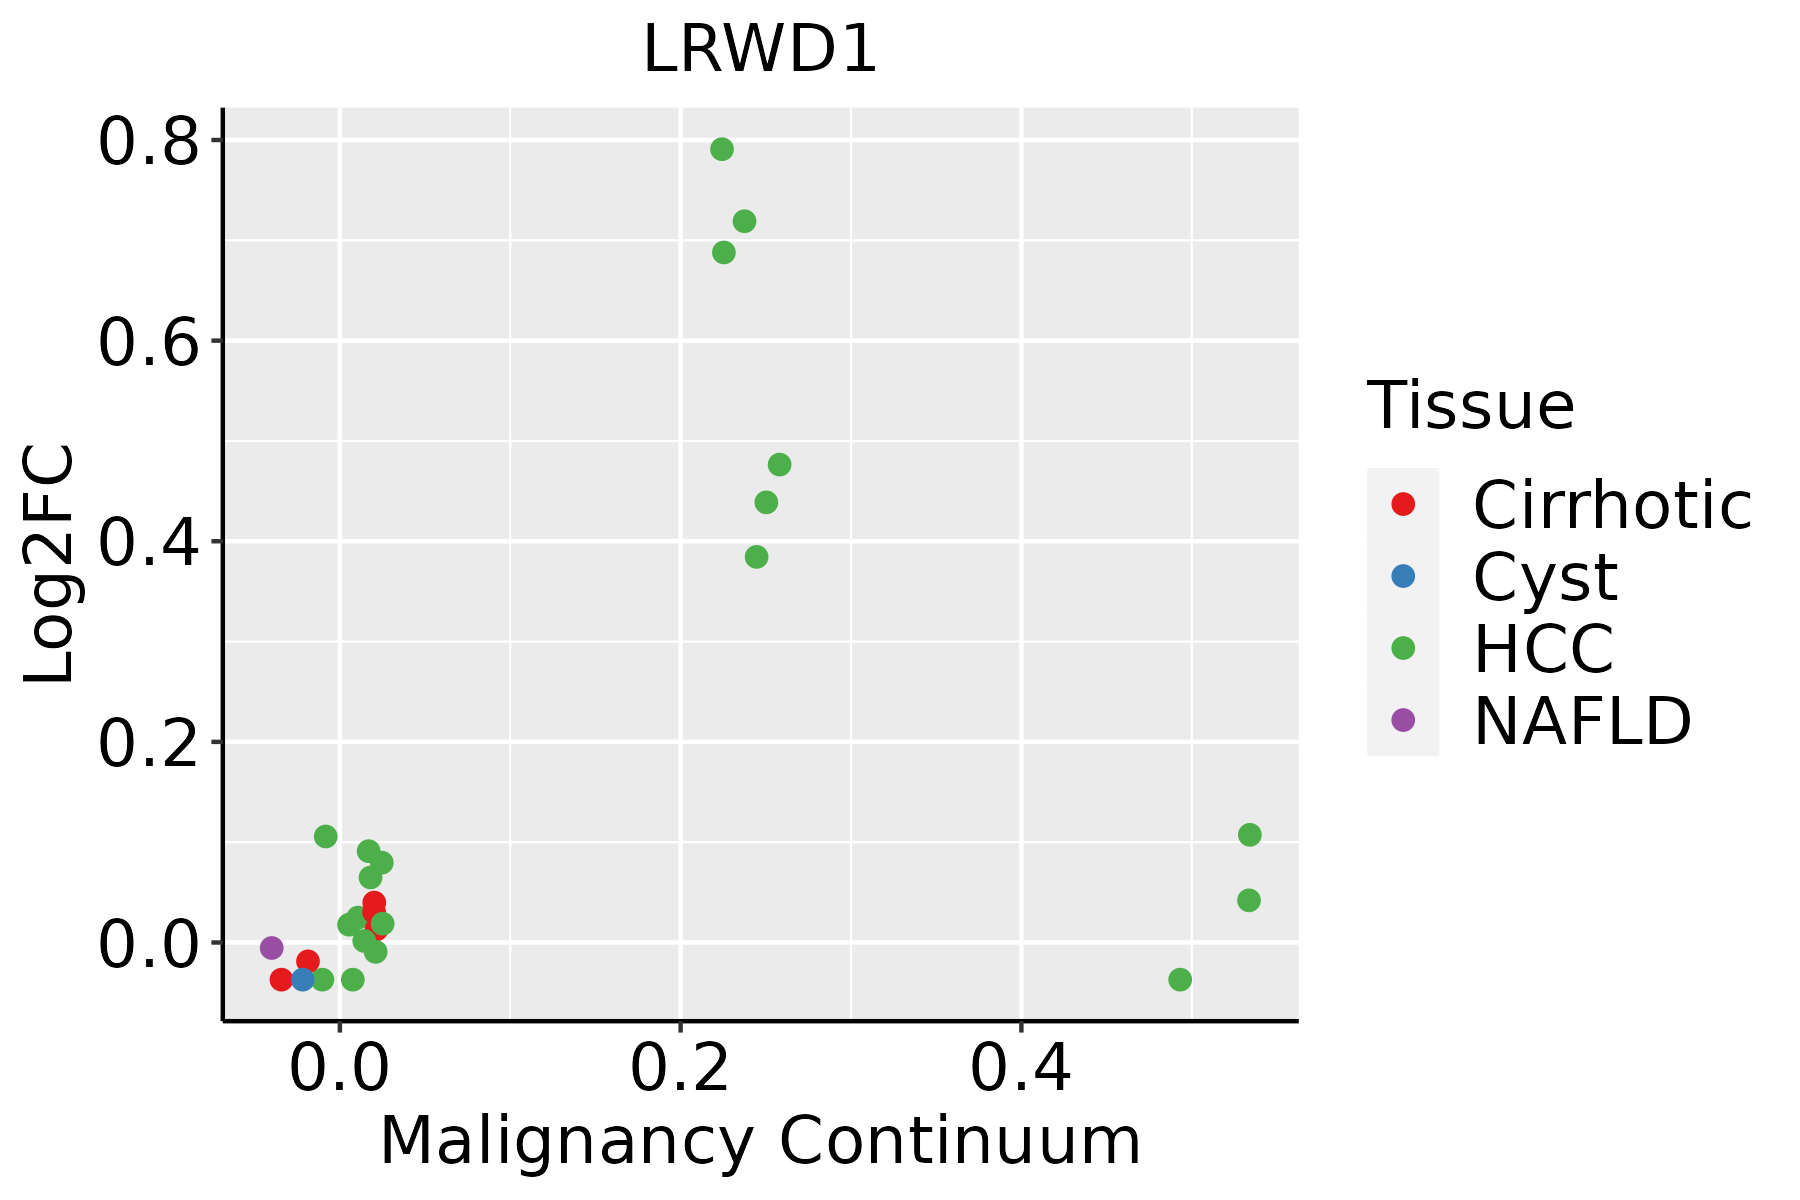 | HCC: Hepatocellular carcinoma |
| NAFLD: Non-alcoholic fatty liver disease | ||
| Oral Cavity | 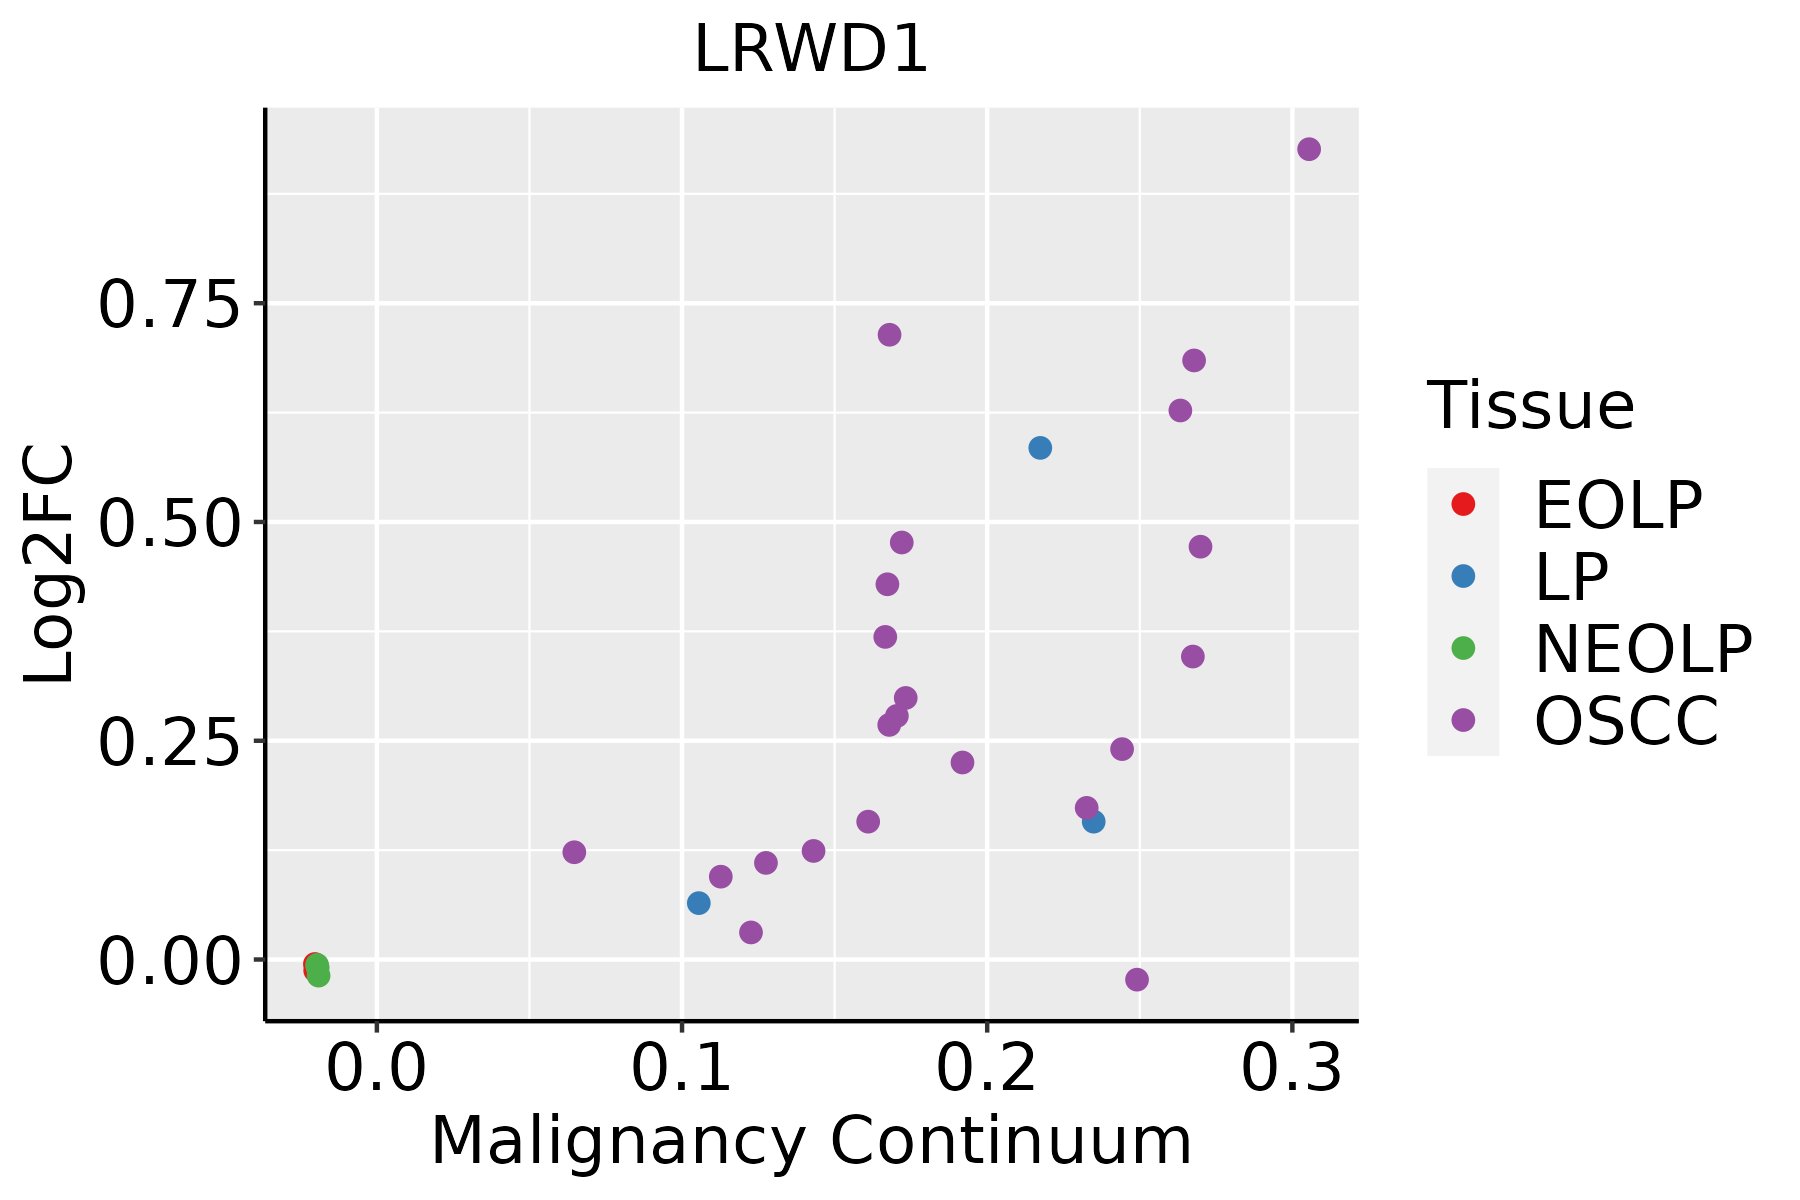 | EOLP: Erosive Oral lichen planus |
| LP: leukoplakia | ||
| NEOLP: Non-erosive oral lichen planus | ||
| OSCC: Oral squamous cell carcinoma |
| ∗log2FC in expression of this searched gene in stem-like cells from each diseased tissue sample relative to stem-like cells in normal samples in each tissue plotted against the malignancy continuum. Samples are colored based on if they are from different disease stage. |
Top |
Malignant transformation related pathway analysis |
| Find out the enriched GO biological processes and KEGG pathways involved in transition from healthy to precancer to cancer |
| Tissue | Disease Stage | Enriched GO biological Processes |
| Colorectum | AD |  |
| Colorectum | SER |  |
| Colorectum | MSS |  |
| Colorectum | MSI-H |  |
| Colorectum | FAP |  |
| ∗Top 15 enriched GO BP terms are showed in the bar plot of each disease state in each tissue. Each row represents a significant GO biological process which is colored according to the -log10(p.adjust). |
| Page: 1 2 3 4 5 6 7 8 9 |
| GO ID | Tissue | Disease Stage | Description | Gene Ratio | Bg Ratio | pvalue | p.adjust | Count |
| GO:0072594110 | Esophagus | ESCC | establishment of protein localization to organelle | 311/8552 | 422/18723 | 3.02e-32 | 2.13e-29 | 311 |
| GO:00062604 | Esophagus | ESCC | DNA replication | 181/8552 | 260/18723 | 3.55e-15 | 2.05e-13 | 181 |
| GO:003450211 | Esophagus | ESCC | protein localization to chromosome | 70/8552 | 92/18723 | 2.54e-09 | 5.64e-08 | 70 |
| GO:000632517 | Esophagus | ESCC | chromatin organization | 240/8552 | 409/18723 | 6.52e-08 | 1.14e-06 | 240 |
| GO:00062612 | Esophagus | ESCC | DNA-dependent DNA replication | 100/8552 | 151/18723 | 2.61e-07 | 3.94e-06 | 100 |
| GO:00062701 | Esophagus | ESCC | DNA replication initiation | 27/8552 | 34/18723 | 6.01e-05 | 4.62e-04 | 27 |
| GO:007019914 | Esophagus | ESCC | establishment of protein localization to chromosome | 20/8552 | 25/18723 | 4.81e-04 | 2.69e-03 | 20 |
| GO:0071168 | Esophagus | ESCC | protein localization to chromatin | 21/8552 | 31/18723 | 1.10e-02 | 3.70e-02 | 21 |
| GO:007259422 | Liver | HCC | establishment of protein localization to organelle | 299/7958 | 422/18723 | 1.06e-32 | 6.10e-30 | 299 |
| GO:00062601 | Liver | HCC | DNA replication | 146/7958 | 260/18723 | 5.68e-06 | 7.02e-05 | 146 |
| GO:00345021 | Liver | HCC | protein localization to chromosome | 55/7958 | 92/18723 | 6.12e-04 | 3.82e-03 | 55 |
| GO:000632511 | Liver | HCC | chromatin organization | 206/7958 | 409/18723 | 7.23e-04 | 4.41e-03 | 206 |
| GO:0006261 | Liver | HCC | DNA-dependent DNA replication | 80/7958 | 151/18723 | 5.91e-03 | 2.44e-02 | 80 |
| GO:00701991 | Liver | HCC | establishment of protein localization to chromosome | 17/7958 | 25/18723 | 8.94e-03 | 3.45e-02 | 17 |
| GO:007259418 | Oral cavity | OSCC | establishment of protein localization to organelle | 284/7305 | 422/18723 | 1.50e-32 | 1.35e-29 | 284 |
| GO:00062603 | Oral cavity | OSCC | DNA replication | 159/7305 | 260/18723 | 3.25e-13 | 1.59e-11 | 159 |
| GO:00345023 | Oral cavity | OSCC | protein localization to chromosome | 60/7305 | 92/18723 | 3.17e-07 | 4.79e-06 | 60 |
| GO:00062611 | Oral cavity | OSCC | DNA-dependent DNA replication | 84/7305 | 151/18723 | 2.46e-05 | 2.30e-04 | 84 |
| GO:0006270 | Oral cavity | OSCC | DNA replication initiation | 25/7305 | 34/18723 | 4.63e-05 | 3.90e-04 | 25 |
| GO:00701995 | Oral cavity | OSCC | establishment of protein localization to chromosome | 18/7305 | 25/18723 | 8.47e-04 | 4.47e-03 | 18 |
| Page: 1 2 |
| Pathway ID | Tissue | Disease Stage | Description | Gene Ratio | Bg Ratio | pvalue | p.adjust | qvalue | Count |
| Page: 1 |
Top |
Cell-cell communication analysis |
| Identification of potential cell-cell interactions between two cell types and their ligand-receptor pairs for different disease states |
| Ligand | Receptor | LRpair | Pathway | Tissue | Disease Stage |
| Page: 1 |
Top |
Single-cell gene regulatory network inference analysis |
| Find out the significant the regulons (TFs) and the target genes of each regulon across cell types for different disease states |
| TF | Cell Type | Tissue | Disease Stage | Target Gene | RSS | Regulon Activity |
| ∗The dot plots of a searched regulon are shown for all cell subpopulations in each disease state of each tissue based on the regulon specific score inferred using pySCENIC and by calculating the average expression. |
| Page: 1 |
Top |
Somatic mutation of malignant transformation related genes |
| Annotation of somatic variants for genes involved in malignant transformation |
| Hugo Symbol | Variant Class | Variant Classification | dbSNP RS | HGVSc | HGVSp | HGVSp Short | SWISSPROT | BIOTYPE | SIFT | PolyPhen | Tumor Sample Barcode | Tissue | Histology | Sex | Age | Stage | Therapy Types | Drugs | Outcome |
| LRWD1 | SNV | Missense_Mutation | c.752N>T | p.Ser251Phe | p.S251F | Q9UFC0 | protein_coding | deleterious(0.03) | benign(0.08) | TCGA-AC-A23H-01 | Breast | breast invasive carcinoma | Female | >=65 | I/II | Unknown | Unknown | PD | |
| LRWD1 | SNV | Missense_Mutation | novel | c.602C>T | p.Ala201Val | p.A201V | Q9UFC0 | protein_coding | tolerated(0.08) | possibly_damaging(0.528) | TCGA-AN-A046-01 | Breast | breast invasive carcinoma | Female | >=65 | I/II | Unknown | Unknown | SD |
| LRWD1 | SNV | Missense_Mutation | rs141553698 | c.1492C>T | p.Arg498Trp | p.R498W | Q9UFC0 | protein_coding | deleterious(0) | benign(0.328) | TCGA-BH-A0EE-01 | Breast | breast invasive carcinoma | Female | >=65 | I/II | Chemotherapy | docetaxel | SD |
| LRWD1 | SNV | Missense_Mutation | novel | c.1267N>T | p.Gly423Trp | p.G423W | Q9UFC0 | protein_coding | deleterious(0) | probably_damaging(1) | TCGA-E9-A1N3-01 | Breast | breast invasive carcinoma | Female | >=65 | III/IV | Chemotherapy | 5-fluorouracil | CR |
| LRWD1 | SNV | Missense_Mutation | c.918N>C | p.Glu306Asp | p.E306D | Q9UFC0 | protein_coding | tolerated(0.93) | benign(0.005) | TCGA-C5-A3HE-01 | Cervix | cervical & endocervical cancer | Female | <65 | I/II | Unknown | Unknown | PD | |
| LRWD1 | SNV | Missense_Mutation | novel | c.334N>T | p.Val112Phe | p.V112F | Q9UFC0 | protein_coding | deleterious(0) | possibly_damaging(0.873) | TCGA-C5-A7CJ-01 | Cervix | cervical & endocervical cancer | Female | <65 | I/II | Chemotherapy | cisplatin | SD |
| LRWD1 | SNV | Missense_Mutation | c.215N>T | p.Arg72Leu | p.R72L | Q9UFC0 | protein_coding | deleterious(0.04) | benign(0.396) | TCGA-C5-A902-01 | Cervix | cervical & endocervical cancer | Female | <65 | I/II | Chemotherapy | cisplatin | SD | |
| LRWD1 | SNV | Missense_Mutation | novel | c.1826N>T | p.Trp609Leu | p.W609L | Q9UFC0 | protein_coding | tolerated(0.65) | benign(0.001) | TCGA-MA-AA42-01 | Cervix | cervical & endocervical cancer | Female | >=65 | I/II | Unknown | Unknown | SD |
| LRWD1 | SNV | Missense_Mutation | rs781715136 | c.700N>T | p.Arg234Trp | p.R234W | Q9UFC0 | protein_coding | tolerated(0.08) | benign(0.019) | TCGA-Q1-A6DW-01 | Cervix | cervical & endocervical cancer | Female | <65 | I/II | Chemotherapy | cisplatin | SD |
| LRWD1 | insertion | Frame_Shift_Ins | novel | c.734_735insGC | p.Ser245ArgfsTer28 | p.S245Rfs*28 | Q9UFC0 | protein_coding | TCGA-DS-A1OB-01 | Cervix | cervical & endocervical cancer | Female | <65 | I/II | Chemotherapy | carboplatin | PD |
| Page: 1 2 3 4 5 6 |
Top |
Related drugs of malignant transformation related genes |
| Identification of chemicals and drugs interact with genes involved in malignant transfromation |
| (DGIdb 4.0) |
| Entrez ID | Symbol | Category | Interaction Types | Drug Claim Name | Drug Name | PMIDs |
| Page: 1 |

Copyright 2023-Present -The University of Texas Health Science Center at Houston |