
|
|||||
|
 | |
| |
| |
| |
| |
| |
|
Gene: LRRN1 |
Gene summary for LRRN1 |
| Gene information | Species | Human | Gene symbol | LRRN1 | Gene ID | 57633 |
| Gene name | leucine rich repeat neuronal 1 | |
| Gene Alias | FIGLER3 | |
| Cytomap | 3p26.2 | |
| Gene Type | protein-coding | GO ID | GO:0007275 | UniProtAcc | Q6UXK5 |
Top |
Malignant transformation analysis |
| Identification of the aberrant gene expression in precancerous and cancerous lesions by comparing the gene expression of stem-like cells in diseased tissues with normal stem cells |
| Entrez ID | Symbol | Replicates | Species | Organ | Tissue | Adj P-value | Log2FC | Malignancy |
| 57633 | LRRN1 | LZE20T | Human | Esophagus | ESCC | 2.19e-02 | 9.78e-02 | 0.0662 |
| 57633 | LRRN1 | LZE22T | Human | Esophagus | ESCC | 1.22e-02 | 1.78e-01 | 0.068 |
| 57633 | LRRN1 | P2T-E | Human | Esophagus | ESCC | 2.15e-21 | 4.49e-01 | 0.1177 |
| 57633 | LRRN1 | P8T-E | Human | Esophagus | ESCC | 1.02e-19 | 3.04e-01 | 0.0889 |
| 57633 | LRRN1 | P10T-E | Human | Esophagus | ESCC | 9.10e-08 | 1.12e-01 | 0.116 |
| 57633 | LRRN1 | P16T-E | Human | Esophagus | ESCC | 1.58e-26 | 5.20e-01 | 0.1153 |
| 57633 | LRRN1 | P44T-E | Human | Esophagus | ESCC | 1.14e-02 | 7.65e-02 | 0.1096 |
| 57633 | LRRN1 | P52T-E | Human | Esophagus | ESCC | 3.64e-03 | 8.57e-02 | 0.1555 |
| 57633 | LRRN1 | P54T-E | Human | Esophagus | ESCC | 1.26e-11 | 3.44e-01 | 0.0975 |
| 57633 | LRRN1 | P56T-E | Human | Esophagus | ESCC | 1.36e-04 | 6.60e-01 | 0.1613 |
| 57633 | LRRN1 | P57T-E | Human | Esophagus | ESCC | 4.51e-03 | 7.86e-02 | 0.0926 |
| 57633 | LRRN1 | P65T-E | Human | Esophagus | ESCC | 1.73e-03 | 1.26e-01 | 0.0978 |
| 57633 | LRRN1 | P74T-E | Human | Esophagus | ESCC | 1.61e-03 | 9.54e-02 | 0.1479 |
| 57633 | LRRN1 | P75T-E | Human | Esophagus | ESCC | 1.62e-13 | 2.38e-01 | 0.1125 |
| 57633 | LRRN1 | P76T-E | Human | Esophagus | ESCC | 8.40e-04 | 6.84e-02 | 0.1207 |
| 57633 | LRRN1 | P79T-E | Human | Esophagus | ESCC | 9.20e-06 | 7.88e-02 | 0.1154 |
| 57633 | LRRN1 | P130T-E | Human | Esophagus | ESCC | 2.51e-33 | 5.63e-01 | 0.1676 |
| Page: 1 |
| Tissue | Expression Dynamics | Abbreviation |
| Esophagus | 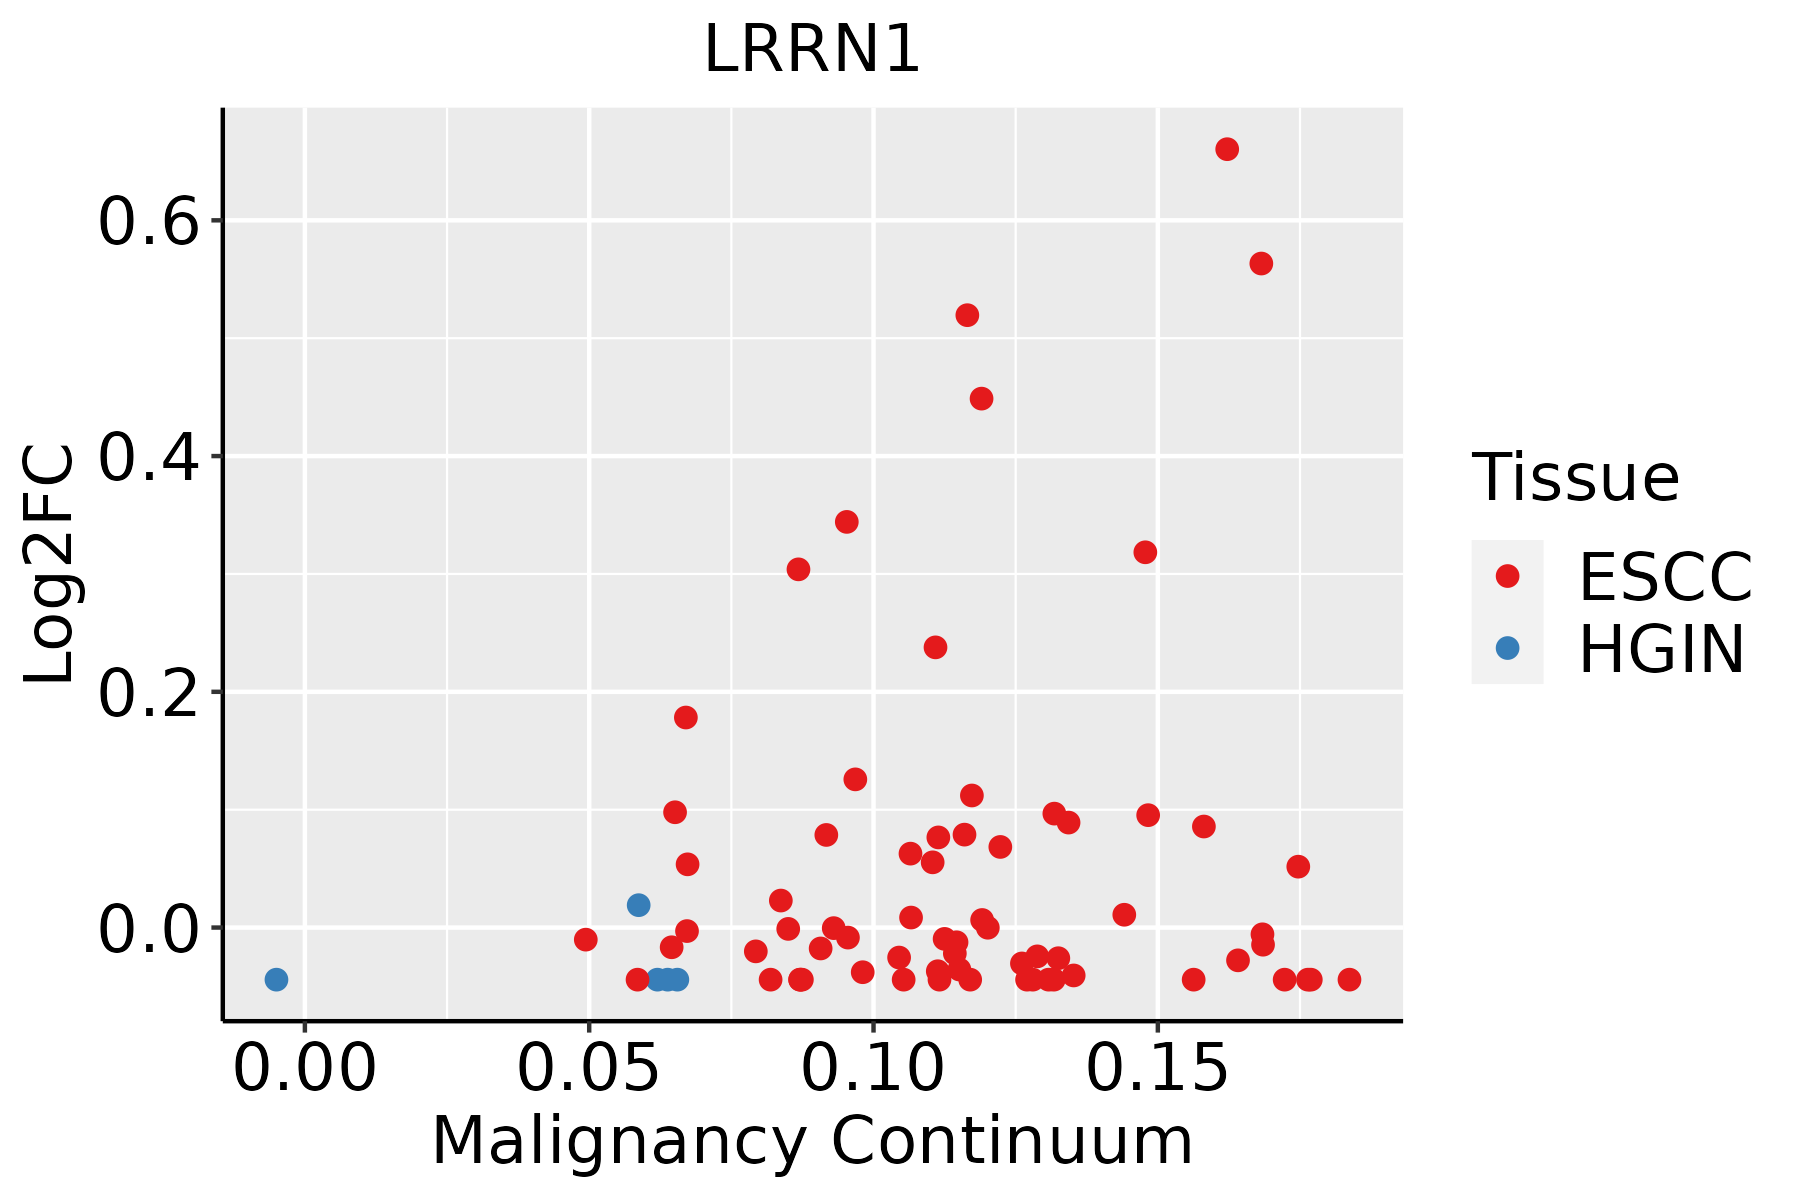 | ESCC: Esophageal squamous cell carcinoma |
| HGIN: High-grade intraepithelial neoplasias | ||
| LGIN: Low-grade intraepithelial neoplasias |
| ∗log2FC in expression of this searched gene in stem-like cells from each diseased tissue sample relative to stem-like cells in normal samples in each tissue plotted against the malignancy continuum. Samples are colored based on if they are from different disease stage. |
Top |
Malignant transformation related pathway analysis |
| Find out the enriched GO biological processes and KEGG pathways involved in transition from healthy to precancer to cancer |
| Tissue | Disease Stage | Enriched GO biological Processes |
| Colorectum | AD |  |
| Colorectum | SER |  |
| Colorectum | MSS |  |
| Colorectum | MSI-H |  |
| Colorectum | FAP |  |
| ∗Top 15 enriched GO BP terms are showed in the bar plot of each disease state in each tissue. Each row represents a significant GO biological process which is colored according to the -log10(p.adjust). |
| Page: 1 2 3 4 5 6 7 8 9 |
| GO ID | Tissue | Disease Stage | Description | Gene Ratio | Bg Ratio | pvalue | p.adjust | Count |
| GO:003432918 | Esophagus | ESCC | cell junction assembly | 227/8552 | 420/18723 | 3.06e-04 | 1.83e-03 | 227 |
| GO:00519606 | Esophagus | ESCC | regulation of nervous system development | 237/8552 | 443/18723 | 5.02e-04 | 2.78e-03 | 237 |
| GO:00519625 | Esophagus | ESCC | positive regulation of nervous system development | 149/8552 | 272/18723 | 1.50e-03 | 7.06e-03 | 149 |
| GO:190188810 | Esophagus | ESCC | regulation of cell junction assembly | 109/8552 | 204/18723 | 1.53e-02 | 4.96e-02 | 109 |
| Page: 1 |
| Pathway ID | Tissue | Disease Stage | Description | Gene Ratio | Bg Ratio | pvalue | p.adjust | qvalue | Count |
| Page: 1 |
Top |
Cell-cell communication analysis |
| Identification of potential cell-cell interactions between two cell types and their ligand-receptor pairs for different disease states |
| Ligand | Receptor | LRpair | Pathway | Tissue | Disease Stage |
| Page: 1 |
Top |
Single-cell gene regulatory network inference analysis |
| Find out the significant the regulons (TFs) and the target genes of each regulon across cell types for different disease states |
| TF | Cell Type | Tissue | Disease Stage | Target Gene | RSS | Regulon Activity |
| ∗The dot plots of a searched regulon are shown for all cell subpopulations in each disease state of each tissue based on the regulon specific score inferred using pySCENIC and by calculating the average expression. |
| Page: 1 |
Top |
Somatic mutation of malignant transformation related genes |
| Annotation of somatic variants for genes involved in malignant transformation |
| Hugo Symbol | Variant Class | Variant Classification | dbSNP RS | HGVSc | HGVSp | HGVSp Short | SWISSPROT | BIOTYPE | SIFT | PolyPhen | Tumor Sample Barcode | Tissue | Histology | Sex | Age | Stage | Therapy Types | Drugs | Outcome |
| LRRN1 | SNV | Missense_Mutation | c.1779N>C | p.Glu593Asp | p.E593D | Q6UXK5 | protein_coding | tolerated(0.16) | possibly_damaging(0.724) | TCGA-A8-A06R-01 | Breast | breast invasive carcinoma | Female | >=65 | I/II | Chemotherapy | 5-fluorouracil | CR | |
| LRRN1 | SNV | Missense_Mutation | c.742N>C | p.Asp248His | p.D248H | Q6UXK5 | protein_coding | deleterious(0) | probably_damaging(0.995) | TCGA-A8-A08L-01 | Breast | breast invasive carcinoma | Female | >=65 | III/IV | Unknown | Unknown | SD | |
| LRRN1 | SNV | Missense_Mutation | c.1339N>C | p.Cys447Arg | p.C447R | Q6UXK5 | protein_coding | deleterious(0) | probably_damaging(1) | TCGA-A8-A097-01 | Breast | breast invasive carcinoma | Female | >=65 | I/II | Hormone Therapy | tamoxiphen | SD | |
| LRRN1 | SNV | Missense_Mutation | c.791N>G | p.Asn264Ser | p.N264S | Q6UXK5 | protein_coding | tolerated(0.29) | benign(0.145) | TCGA-AN-A0AK-01 | Breast | breast invasive carcinoma | Female | >=65 | I/II | Unknown | Unknown | SD | |
| LRRN1 | SNV | Missense_Mutation | c.2018C>G | p.Ser673Cys | p.S673C | Q6UXK5 | protein_coding | deleterious(0.02) | possibly_damaging(0.894) | TCGA-AR-A0TX-01 | Breast | breast invasive carcinoma | Female | <65 | I/II | Unknown | Unknown | SD | |
| LRRN1 | SNV | Missense_Mutation | rs770349026 | c.1169N>A | p.Arg390His | p.R390H | Q6UXK5 | protein_coding | deleterious(0) | probably_damaging(0.98) | TCGA-BH-A0BT-01 | Breast | breast invasive carcinoma | Female | <65 | I/II | Chemotherapy | adriamycin | CR |
| LRRN1 | SNV | Missense_Mutation | c.122N>A | p.Arg41His | p.R41H | Q6UXK5 | protein_coding | deleterious(0) | probably_damaging(0.998) | TCGA-EW-A1IZ-01 | Breast | breast invasive carcinoma | Female | <65 | III/IV | Chemotherapy | taxotere | SD | |
| LRRN1 | deletion | Frame_Shift_Del | c.2009delN | p.Thr672ProfsTer6 | p.T672Pfs*6 | Q6UXK5 | protein_coding | TCGA-AN-A0AK-01 | Breast | breast invasive carcinoma | Female | >=65 | I/II | Unknown | Unknown | SD | |||
| LRRN1 | insertion | Nonsense_Mutation | novel | c.1938_1939insATACGCTATACTAAAAAAATTTGAAA | p.Ser647IlefsTer8 | p.S647Ifs*8 | Q6UXK5 | protein_coding | TCGA-AO-A128-01 | Breast | breast invasive carcinoma | Female | <65 | I/II | Chemotherapy | doxorubicin | SD | ||
| LRRN1 | insertion | Nonsense_Mutation | novel | c.249_250insTATTTAGCTAAAACTAAAATGGATTAGAGATACAAGATGATGA | p.Ile84TyrfsTer9 | p.I84Yfs*9 | Q6UXK5 | protein_coding | TCGA-BH-A0DP-01 | Breast | breast invasive carcinoma | Female | <65 | I/II | Hormone Therapy | arimidex | SD |
| Page: 1 2 3 4 5 6 7 8 9 10 11 12 |
Top |
Related drugs of malignant transformation related genes |
| Identification of chemicals and drugs interact with genes involved in malignant transfromation |
| (DGIdb 4.0) |
| Entrez ID | Symbol | Category | Interaction Types | Drug Claim Name | Drug Name | PMIDs |
| Page: 1 |

Copyright 2023-Present -The University of Texas Health Science Center at Houston |